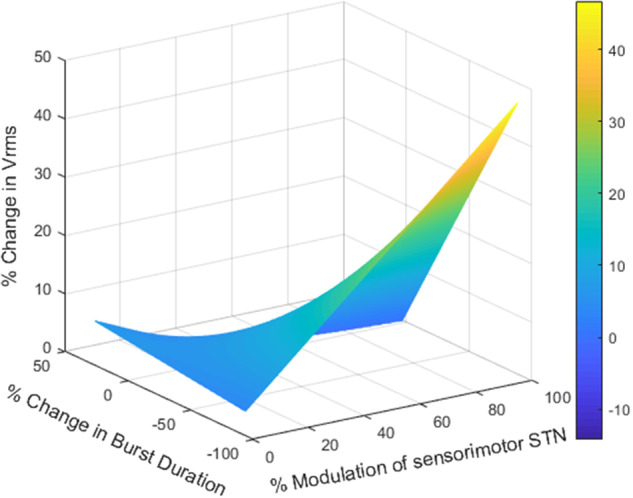
Figure 5.

Change in movement band burst duration interacted with the amount of overlap of the VTM with the sensorimotor STN to predict the increase in Vrms. The heat map represents the 3D interaction among changes in movement band burst duration, % overlap of the VTM with the sensorimotor STN, and % increase in Vrms. Greater reduction in movement band burst duration and greater overlap of the VTM with the sensorimotor STN were associated with larger increases in the % change in Vrms, P < 0.05. Colour bar represents the % change in Vrms.
