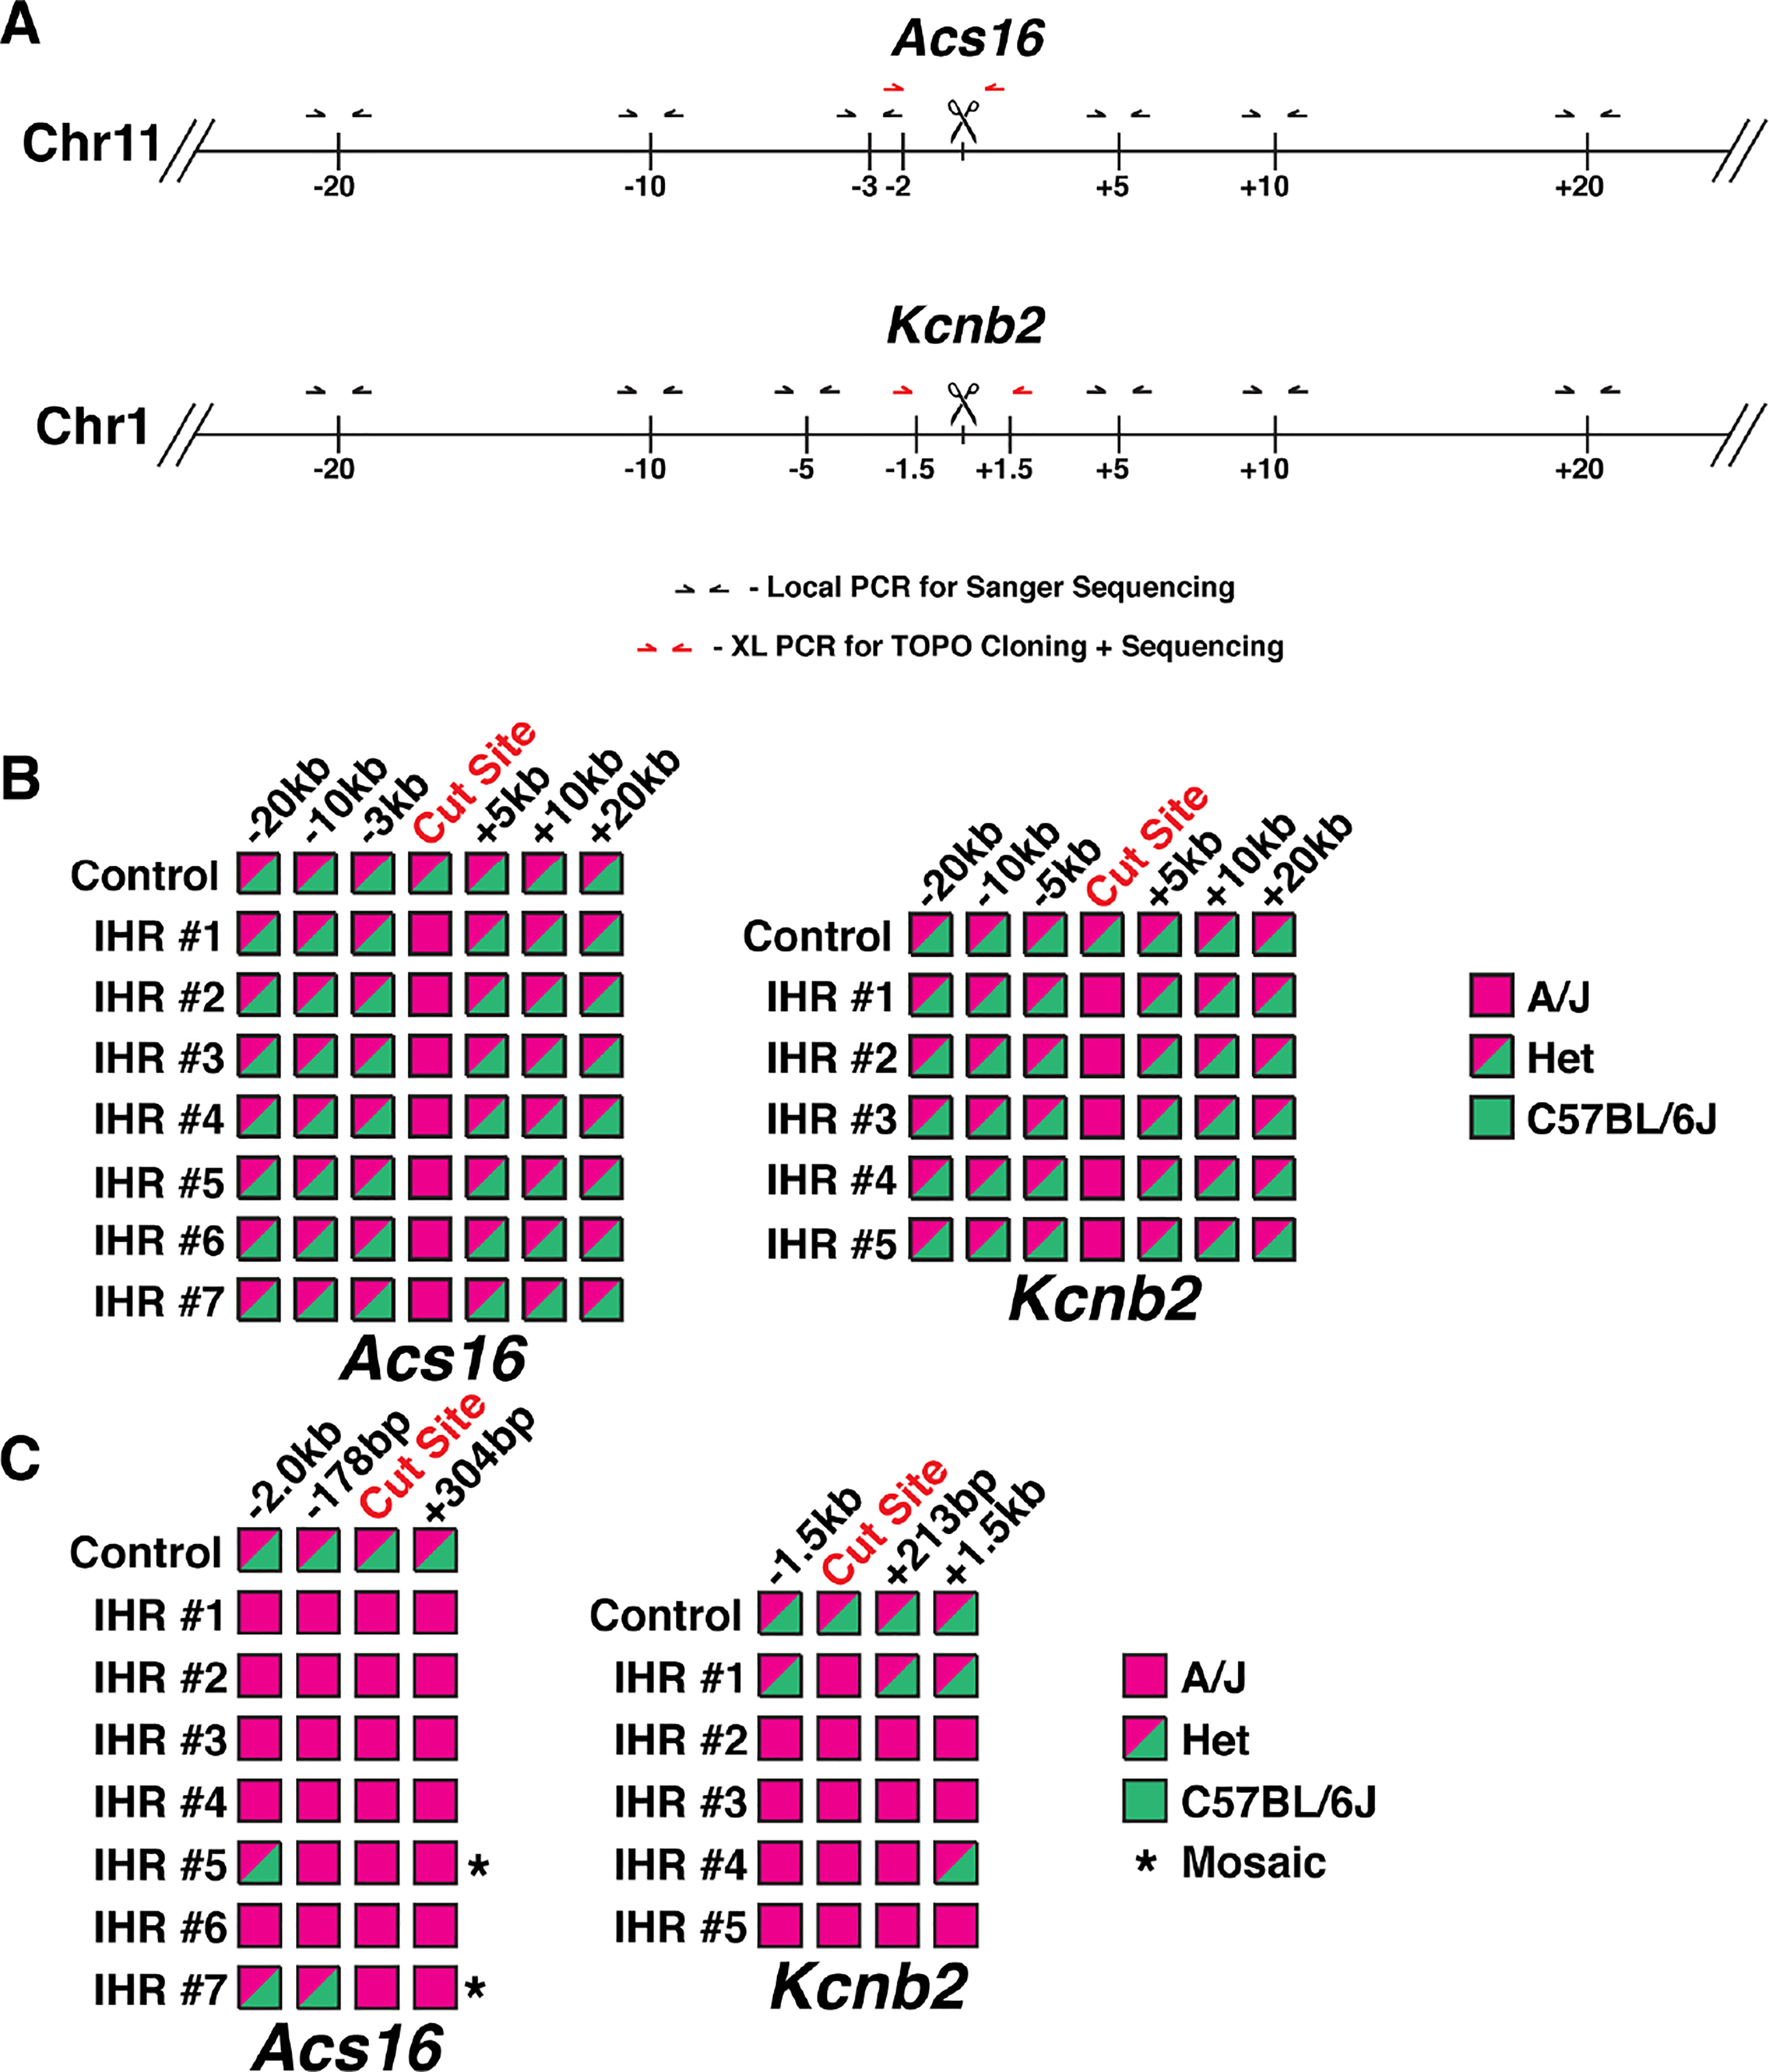
Figure 7. IHR Induces Conversion of Long Recombination Tracts.

(A) Schematic of genotyping strategies for Acs16 and Kcnb2 loci. Black arrows denote locations of primers for local PCR of SNPs tiled across regions. Red arrows denote locations of primers for long-range PCR and TOPO cloning. Vertical lines denote approximate locations of SNPs. (B) Summary of genotyping results from local PCR of tiled SNPs. Pink boxes denote homozygous A/J alleles and mixed-color boxes denote heterozygous alleles with A/J and C57BL/6J SNPs. (C) Summary of genotyping results from TOPO cloning of long-range PCR products. Mixed-color boxes are used for any sites with at least one clone of the indicated allele. Asterisks denote embryos with low level of an allele, indicating mosaicism (see also Figure S5).
