

Abstract
Hypertrophic cardiomyopathy (HCM) is a common, serious, genetic heart disorder. Rare pathogenic variants in sarcomere genes cause HCM, but with unexplained phenotypic heterogeneity. Moreover, most patients do not carry such variants. We report a genome-wide association study of 2,780 cases and 47,486 controls that identified 12 genome-wide-significant susceptibility loci for HCM. Single-nucleotide polymorphism heritability indicated a strong polygenic influence, especially for sarcomere-negative HCM (64% of cases; h2g = 0.34 ± 0.02). A genetic risk score showed substantial influence on the odds of HCM in a validation study, halving the odds in the lowest quintile and doubling them in the highest quintile, and also influenced phenotypic severity in sarcomere variant carriers. Mendelian randomization identified diastolic blood pressure (DBP) as a key modifiable risk factor for sarcomere-negative HCM, with a one standard deviation increase in DBP increasing the HCM risk fourfold. Common variants and modifiable risk factors have important roles in HCM that we suggest will be clinically actionable.
Hypertrophic cardiomyopathy (HCM) is common, affecting at least one in 500 individuals, and presents substantial unmet medical need1. It is a leading cause of sudden death, embolic stroke and heart failure in early and mid-adult life. Sarcomeric HCM, caused by mutations in myofilament genes, is inherited as an autosomal dominant disorder. However, as is commonly seen in adult-onset heterozygous disorders, HCM is characterized by reduced penetrance and variable expressivity, providing challenges for diagnosis and prognosis2,3. In the more common sarcomere-negative setting, cases are often isolated, but clustering in nuclear families is still frequent, requiring clinical surveillance in families4,5. To investigate the contribution of common genetic variants to HCM risk, we performed two independent multi-ancestry case–control genome-wide association studies (GWASs) of unrelated patients with HCM recruited to the Hypertrophic Cardiomyopathy Registry (HCMR; 2,541 unselected cases versus 40,283 UK Biobank (UKBB) controls) and the BioResource for Rare Diseases (BRRD; 239 sarcomere-negative cases versus 7,203 controls) (Fig. 1, Supplementary Table 1 and Supplementary Note). Single-nucleotide polymorphism (SNP) heritability (h2g) estimates calculated using GREML-LDMS indicated that a substantial proportion of HCM risk was attributable to the additive effects of common (minor allele frequency (MAF) > 0.01) SNPs (HCMR h2g = 0.35 ± 0.01; BRRD h2g = 0.68 ± 0.16).
Fig. 1 |. Study design for the HCM genome-wide association analysis.
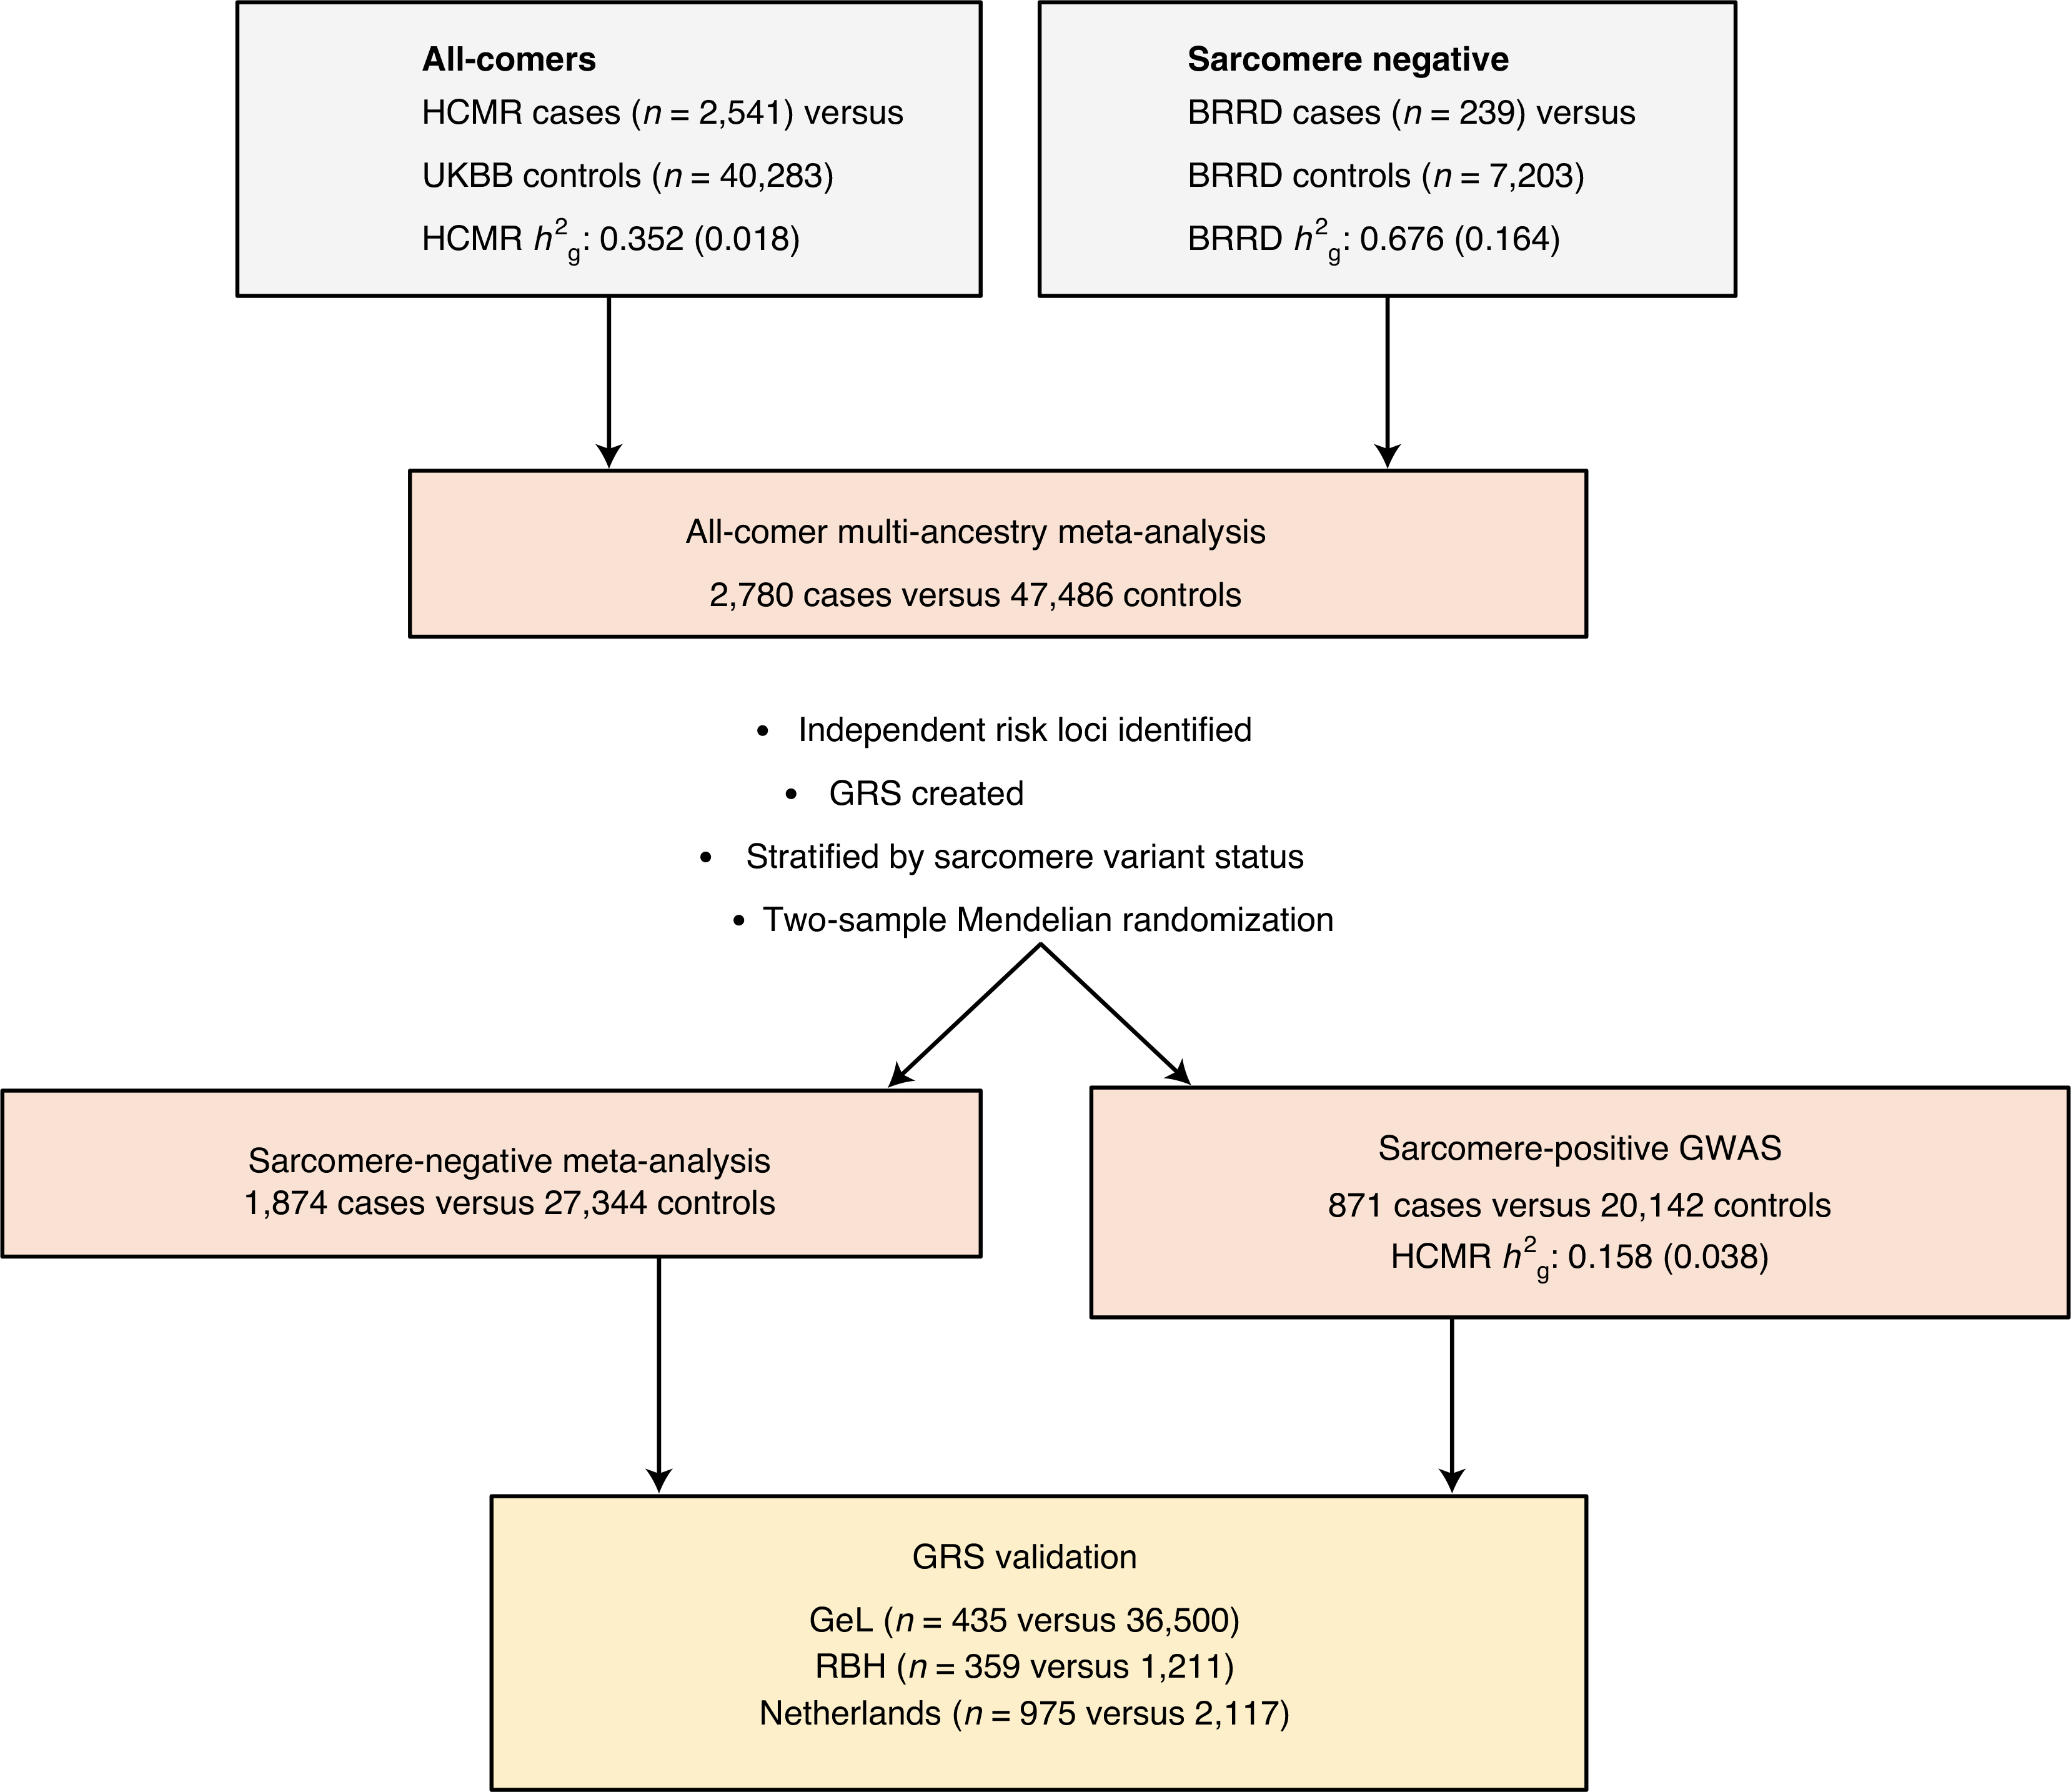
Two independent HCM GWASs were performed before fixed-effects inverse-variance meta-analysis was conducted. Genetic risk scores (GRSs) were generated and stratified by sarcomere variant status. The findings were validated using three independent cohorts (GeL, RBH and the Netherlands cohort (Amsterdam, Rotterdam and Groningen)). Two-sample Mendelian randomization was performed, stratified by sarcomere variant status, to provide insight into heritable risk factors for HCM. SNP heritability (h2g) estimates were compared between component GWASs using GReML-LDMS and stratified by sarcomere variant status. Standard errors for h2g estimates are presented in parentheses.
We performed fixed-effects inverse-variance meta-analysis of the HCMR and BRRD GWAS datasets for 8,590,397 SNPs across a total of 2,780 HCM cases and 47,486 age- and sex-matched controls. All-comer analysis (that is, inclusive of sarcomere-positive and sarcomere-negative HCM cases) identified 13 independent genome-wide-significant variants in 12 loci (P < 5 × 10⁻⁸), using a stepwise model selection procedure with genome-wide complex trait analysis (GCTA) and confirmed with conditional analysis (Table 1, Supplementary Table 2 and Methods). We identified an additional 16 independent variants at a 5% false discovery rate (FDR) significance threshold (P < 1.82 × 10⁻⁶) (Supplementary Table 3). We replicated 11 of the 13 genome-wide-significant variants and four of the 16 FDR variants in a smaller, independent HCM meta-analysis (n = 1,643 cases and 6,628 controls; Table 1, Supplementary Table 3 and Methods). Additionally, we obtained similar discovery findings with a European-only analysis (Supplementary Table 2 and Supplementary Note).
Table 1 |.
Variants independently associated with HCM beneath the genome-wide-significance threshold
| Chromosome | SNP | Position (GRCh37) | NEA/EA | EA frequency | Discovery |
Replication |
Locus name | ||||
|---|---|---|---|---|---|---|---|---|---|---|---|
| OR | 95% CI | P | OR | 95% CI | P | ||||||
| 1 | rs1048302 | 16,340,879 | G/T | 0.33 | 1.32 | 1.24–1.40 | 2.54×10⁻¹⁷ | 1.26 | 1.16–1.37 | 1.06×10⁻⁷* | HSPB7 |
| 3 | rs13061705 | 14,291,129 | T/C | 0.69 | 1.25 | 1.16–1.34 | 9.18×10⁻⁹ | 1.13 | 1.04–1.24 | 4.49×10⁻³ | SLC6A6 |
| 6 | rs3176326 | 36,647,289 | G/A | 0.21 | 1.28 | 1.19–1.38 | 2.22×10⁻¹¹ | 1.27 | 1.15–1.40 | 1.87×10⁻⁶* | CDKN1A |
| 6 | rs12212795 | 118,654,308 | G/C | 0.05 | 1.48 | 1.31–1.67 | 2.51×10⁻¹⁰ | 1.72 | 1.45–2.05 | 8.19×10⁻¹⁰* | PLN |
| 10 | rs72840788 | 121,415,685 | G/A | 0.21 | 1.52 | 1.42–1.64 | 5.06×10⁻²⁹ | 1.42 | 1.29–1.56 | 4.90×10⁻¹³* | BAG3 |
| 12 | rs7301677 | 115,381,147 | T/C | 0.73 | 1.24 | 1.15–1.33 | 1.26×10⁻⁸ | 1.19 | 1.08–1.31 | 2.74×10⁻⁴* | TBX3 |
| 13 | rs41306688 | 114,078,558 | A/C | 0.03 | 1.82 | 1.53–2.17 | 1.08×10⁻¹¹ | 1.38 | 1.10–1.73 | 5.03×10⁻³ | ADPRHL1 |
| 15 | rs8033459 | 85,253,258 | C/T | 0.47 | 1.21 | 1.14–1.29 | 3.41×10⁻⁹ | 1.18 | 1.09–1.28 | 5.49×10⁻⁵* | ALPK3 |
| 17 | rs28768976 | 43,688,317 | A/G | 0.23 | 1.29 | 1.20–1.39 | 4.12×10⁻¹² | 1.29 | 1.17–1.42 | 2.11×10⁻⁷* | SPPL2C |
| 17 | rs7210446 | 64,307,014 | G/A | 0.58 | 1.25 | 1.16–1.34 | 6.82×10⁻¹⁰ | 1.25 | 1.15–1.35 | 8.93×10⁻⁸* | PRKCA |
| 18 | rs4799426 | 34,280,891 | A/G | 0.35 | 1.38 | 1.29–1.47 | 4.00×10⁻²³ | 1.44 | 1.32–1.57 | 1.13×10⁻¹⁶* | FHOD3 |
| 18 | rs118060942 | 34,280,732 | C/T | 0.01 | 1.79 | 1.45–2.20 | 2.35×10⁻⁸ | 2.70 | 1.80–4.04 | 1.49×10⁻⁶* | FHOD3 |
| 22 | rs2070458 | 24,159,307 | T/A | 0.22 | 1.34 | 1.25–1.44 | 7.12×10⁻¹⁵ | 1.25 | 1.12–1.38 | 2.81×10⁻⁵* | MMP11 |
Fixed-effects inverse-variance meta-analysis was performed for two multi-ancestry GWASs (HCMR cases (n = 2,541) versus UKBB controls (n = 40,283) and BRRD HCM cases (n = 239) versus controls (n = 7,203)), using 8,590,397 SNPs. Variants conferring independent risk effects were identified through a stepwise model selection procedure. Other than FHOD3, all loci are novel. Most loci do not overlap with the myofilament genes known to carry rare variants causal for HCM, but instead highlight important homeostatic pathways. Ten of the 12 genome-wide-significant (P < 5×10⁻⁸) variants replicate. Replication was performed in non-overlapping cases from the Netherlands, Canada and Royal Brompton discovery series (n = 1,643 cases and 6,628 controls), with significant loci (α threshold = 0.05/29 (total number of independent variants beneath the 5% FDR threshold; that is, P < 1.72×10⁻³) highlighted by an asterisk. No significant heterogeneity was detected between the discovery and replication studies (P > 0.05) (Supplementary Table 3). P values are uncorrected for multiple testing. EA, allele effect; NEA, non-effect allele.
The FHOD3 locus was found to harbor two independent genome-wide-significant variants, rs4799426 and rs118060942, in linkage equilibrium (r2 = 0.01). Sentinel SNPs in the HCM susceptibility loci conferred relatively large susceptibility effect sizes (median odds ratio (OR) = 1.25; range = 1.18–2.16) across a range of effect allele frequencies (range = 0.012–0.83) (Supplementary Table 4). Tissue enrichment tests, performed in FUMA using gene-level data (Supplementary Table 5) and tissue expression data from GTEx (version 8.0) showed enrichment in the left ventricular myocardium (β = 0.04 ± 0.01; P = 7.46 × 10⁻⁶), skeletal muscle (β = 0.03 ± 0.01; P = 1.13 × 10⁻⁵) and atrial appendage (β = 0.04 ± 0.01; P = 1.18 × 10⁻⁵) (Supplementary Table 6 and Supplementary Note)6,7. Functional GWAS supported these findings and revealed cell types where sentinel SNPs were most enriched (Supplementary Tables 7 and 8).
We dichotomized HCM cases in HCMR into sarcomere-positive (34.3%) and sarcomere-negative (64.3%) groups using a published framework (Supplementary Tables 9 and 10)8. The GREML heritability estimate for sarcomere-negative HCM exceeded that of sarcomere-positive HCM (h2g = 0.34 ± 0.02 versus 0.16 ± 0.04) (Supplementary Table 11). This supports the hypothesis that where there is familial aggregation that is not explained by co-segregation with a rare variant, as in sarcomere-negative HCM, a greater role for common variants may be expected. This applies in particular to the BRRD samples, which were enriched for positive family history despite negative gene-panel testing, where heritability was indeed greatest. A meta-analysis of sarcomere-negative HCM (1,874 HCM cases versus 27,344 controls) identified ten independent genome-wide-significant variants in nine loci and a further 15 independent variants in 13 loci below a 5% FDR threshold (P < 1.56 × 10⁻⁶) (Supplementary Table 12). Three loci (FHOD3, TBX3 and PLN) harbored a secondary independent variant following conditional association analysis (Supplementary Table 2).
Sarcomere-positive HCM GWAS analysis (871 HCMR cases versus 20,142 UKBB controls) yielded seven independent genome-wide-significant variants and a further 11 independent variants below a 5% FDR threshold (P < 1.50 × 10⁻⁶) from 12 loci. This included seven variants in the peri-centromeric region of chromosome 11 neighboring MYBPC3, a prominent cause of monogenic HCM (Supplementary Tables 2 and 13). Haplotype analysis of individual-level sequence data demonstrated long-range linkage disequilibrium and potential spurious associations between frequently observed rare pathogenic variants in MYBPC3 (NM_000256.3), specifically p.Arg502Trp and p.Trp792ValfsTer41, and common imputed variants in the chromosome 11 (44,976,681–57,917,265) genomic interval9–11. Modeling the impact of both rare and common variants with multiple logistic regression confirmed that HCM risk could be entirely attributed to the rare variants (Supplementary Note). Common variants in chromosome 11 (44,000,000–58,000,000) were masked from subsequent analyses, leaving two independent variants of genome-wide significance and nine below the 5% FDR threshold. Excluding chromosome 11 (44,976,681–57,917,265) had a trivial effect on the heritability estimate.
Bivariate GREML analysis revealed a strong positive genetic correlation between sarcomere-positive and sarcomere-negative HCM (rg = 1.00 ± 0.12). Pairwise GWAS comparison revealed overlapping signals between sarcomere-negative and sarcomere-positive loci for 59% of regions (n = 22/37) (Supplementary Table 14). Most of the sarcomere-negative GWAS loci were not reproduced at the genome-wide-significance level in the sarcomere-positive GWAS, which could potentially be explained by a relative lack of power (Supplementary Table 15). Four SNPs (rs2312403, rs35469308, rs12299450 and rs2758215) showed association only in the sarcomere-positive GWAS, and may represent modifier loci.
All loci were novel, apart from FHOD3, which has been previously reported in a HCM GWAS12. Previous candidate gene studies have reported rare variant associations in different forms of cardiomyopathy for BAG3 and FHOD3, and common-variant associations with dilated cardiomyopathy (DCM) have been reported for BAG3 and HSPB7 loci13–17. At these loci shared by HCM and DCM, the direction of effect is opposite, with the HCM risk allele being previously shown to decrease the risk of DCM. The involvement of BAG3, HSPB7 and FHOD3 points to the importance of homeostatic pathways for sarcomeric structural integrity during mechanical stress (Supplementary Note). While some of the other loci also encode known cardiomyopathy genes (PLN and TTN), the major HCM and DCM myofilament loci are not represented, consistent with the cardiomyopathy-causing changes in these genes altering protein structure rather than expression level. In the remaining loci, some early clues implicate specific genes and mechanisms: a deleterious missense variant implicates ADPRHL1, which is important for Z-disc and actin dynamics, and a cis-expression quantitative trait locus (cis-eQTL) implicates SLC6A6, which encodes a taurine transporter known to be responsible for cardiomyopathy in dogs (Supplementary Note).
After excluding rs28768976 for extreme pleiotropy (Supplementary Note) and rs78310129 due to long-range linkage disequilibrium with pathogenic MYBPC3 variants (Supplementary Note), 27 SNPs showing independent associations with HCM at the 5% FDR threshold in the all-comer HCM meta-analysis were aggregated into a scaled (that is, per-standard deviation effects), weighted genetic risk score (GRS) (Table 2 and Supplementary Tables 16 and 17). The GRS predicts the odds of HCM in a validation meta-analysis of three independent HCM cohorts comprising 1,769 cases and 39,828 controls (OR = 1.73 per s.d. (95% confidence interval (CI) = 1.63–1.83)) (Fig. 2). Using the largest replication cohort, we conducted a sensitivity analysis and confirmed a 5% FDR threshold as representative of alternate SNP significance thresholds (Supplementary Table 16).
Table 2 |.
Variants independently associated with HCM beneath the 5% FDR threshold used in a GRS instrument
| Chromosome | SNP | NEA/EA | β | Discovery P | Replication P | Locus name |
|---|---|---|---|---|---|---|
| 10 | rs72840788 | A/G | −0.421 | 5.06×10⁻²⁹ | 4.90×10⁻¹³* | BAG3 |
| 18 | rs4799426 | G/A | −0.321 | 4.00×10⁻²³ | 1.13×10⁻¹⁶* | FHOD3 |
| 1 | rs1048302 | G/T | 0.277 | 2.54×10⁻¹⁷ | 1.06×10⁻⁷* | HSPB7 |
| 22 | rs2070458 | T/A | 0.293 | 7.12×10⁻¹⁵ | 2.81×10⁻⁵* | MMP11 |
| 13 | rs41306688 | C/A | −0.601 | 1.08×10⁻¹¹ | 5.03×10⁻³ | ADPRHL1 |
| 6 | rs3176326 | A/G | −0.247 | 2.22×10⁻¹¹ | 1.87×10⁻⁶* | CDKN1A |
| 6 | rs12212795 | C/G | −0.393 | 2.51×10⁻¹⁰ | 8.19×10⁻¹⁰* | PLN |
| 17 | rs7210446 | A/G | −0.220 | 6.82×10⁻¹⁰ | 8.93×10⁻⁸* | PRKCA |
| 15 | rs8033459 | T/C | −0.190 | 3.41×10⁻⁹ | 5.49×10⁻⁵* | ALPK3 |
| 3 | rs13061705 | T/C | 0.224 | 9.18×10⁻⁹ | 4.49×10⁻³ | SLC6A6 |
| 12 | rs7301677 | T/C | 0.214 | 1.26×10⁻⁸ | 2.74×10⁻⁴* | TBX3 |
| 18 | rs118060942 | T/C | −0.799 | 2.35×10⁻⁸ | 1.49×10⁻⁶* | FHOD3 |
| 6 | rs9320939 | A/G | −0.174 | 5.78×10⁻⁸ | 4.48×10⁻² | TRDN |
| 5 | rs10052399 | C/T | 0.206 | 6.21×10⁻⁸ | 4.42×10⁻⁶* | PROB1 |
| 10 | rs11196085 | C/T | −0.190 | 7.30×10⁻⁸ | 1.99×10⁻⁶* | TCF7L2 |
| 2 | Rs2003585 | C/T | 0.174 | 8.60×10⁻⁸ | 1.12×10⁻² | STRN |
| 9 | rs734638 | G/C | −0.186 | 1.09×10⁻⁷ | 3.39×10⁻¹ | RAPGEF1, POMT1 |
| 5 | rs66761011 | G/A | −0.349 | 1.45×10⁻⁷ | 5.18×10⁻¹ | AK098570 |
| 15 | rs1814880 | C/T | 0.179 | 1.59×10⁻⁷ | 4.84×10⁻³ | CHRNB4 |
| 12 | rs1480036 | C/T | −0.211 | 3.50×10⁻⁷ | 2.60×10⁻¹ | SSPN |
| 3 | rs4894803 | G/A | −0.179 | 3.51×10⁻⁷ | 9.91×10⁻⁶* | FNDC3B |
| 2 | rs7556984 | A/G | 0.186 | 5.21×10⁻⁷ | 4.94×10⁻² | E2F6, ROCK2 |
| 2 | rs62177303 | T/C | 0.175 | 7.00×10⁻⁷ | 7.79×10⁻³ | TTN |
| 19 | rs117710064 | T/C | −0.222 | 8.55×10⁻⁷ | 9.36×10⁻¹ | AZU1 |
| 21 | rs2832230 | T/G | 0.251 | 9.57×10⁻⁷ | 2.49×10⁻³ | MAP3K7CL |
| 8 | rs7003871 | T/C | 0.169 | 1.14×10⁻⁶ | 4.21×10⁻² | MTSS1 |
| 11 | rs1390519 | G/A | −0.203 | 1.16×10⁻⁶ | 2.44×10⁻² | CYP2R1 |
β estimates were derived from a fixed-effects inverse-variance meta-analysis that incorporated two multi-ancestry GWASs (HCMR cases (n = 2,541) versus UKBB controls (n = 40,283) and BRRD HCM cases (n = 239) versus controls (n = 7,203)) using 8,590,397 SNPs. Variants conferring independent risk effects beneath the 5% FDR threshold (P < 1.82×10⁻⁶) were identified through a stepwise model selection procedure. Asterisks denote independent replication at the Bonferroni-corrected significance level (P < 1.72×10⁻³), as described in Table 1. P values are uncorrected for multiple testing.
Fig. 2 |. Validation of an HCM GRS.

A GRS was generated from 27 SNPs with <5% FDR and weighted by the β estimate from the multi-ancestry meta-analysis joint model GCTA results. The GRS was evaluated in all-comers, sarcomere-positive and sarcomere-negative HCM cases, in three validation cohorts. a, A quintile-based analysis demonstrates the protective effects of the GRS in the lowest 20% of the population compared with the middle 60%. Similarly, the upper 20% show increased susceptibility towards a risk of developing HCM compared with the middle 60%. b, To facilitate comparison between other GRSs, a per-standard deviation estimate is reported. In a and b, ORs (x axis) are reported, with error bars denoting 95% CIs. The validation cohorts included GeL (n = 435 HCM cases versus n = 36,500 controls), RBH (n = 359 HCM cases versus n = 1,211 controls) and the Netherlands cohort (n = 975 HCM cases versus n = 2,117 controls).
Stratification of the HCMR cases by their average genetic ancestry, as determined by principal components analysis, demonstrated similar effect sizes across all ancestry groups (Supplementary Table 18). Using the central 60% of the population as the reference group, there was a protective effect for individuals in the lowest quintile (OR = 0.53 (95% CI = 0.45–0.63)) and a greater than a twofold increased odds of HCM for individuals in the highest quintile (OR = 2.30 (95% CI = 2.02–2.62)). In alignment with h2g estimates, the GRS demonstrated larger effects in the sarcomere-negative subgroup (Fig. 2 and Supplementary Note). Nevertheless, in young individuals carrying a pathogenic sarcomere mutation, who might typically have a probability of developing overt cardiomyopathy in adulthood of ~50%, a halving or doubling of the average risk of developing the cardiomyopathy is likely to be clinically meaningful.
To determine whether the common susceptibility variants also influence disease severity in sarcomere-positive HCM (that is, through a modifier effect), we assessed the impact of the GRS on left ventricular hypertrophy in groups of cases with similar mutational mechanisms. A 1 s.d. unit increase in GRS conferred a 0.71 ± 0.35 mm increase in maximum left ventricular wall thickness (P = 0.048) in carriers of MYBPC3 truncating variants (n = 232) and a 0.73 ± 0.36 mm increase (P = 0.037) in carriers of MYH7 missense variants (n = 186) (Fig. 3). Allelic heterogeneity currently limits single-variant expressivity estimates; the most frequently observed pathogenic variant in HCM, MYBPC3R502W, is associated with a larger GRS effect size (1.61 ± 0.80 mm increase per 1 s.d. unit increase in GRS) but is currently modestly powered (n = 48).
Fig. 3 |. Relationship between standardized GRS and maximum left ventricular wall thickness.

Linear regression was performed to assess the most frequently observed HCM variant classes: truncating variants in MYBPC3; MYH7 missense variants; and the most frequently observed pathogenic variant (MYPBC3R502W). a, Carriers of pathogenic or likely pathogenic MYBPC3 truncating variants (n = 232; β = 0.71 ± 0.35; P = 0.048). b, Carriers of pathogenic or likely pathogenic MYH7 missense variants (n = 186; β = 0.73 ± 0.35; P = 0.036). c, Carriers of the most frequently observed pathogenic variant in HCM, MYBPC3R502W (n = 48; β = 1.61 ± 0.80; P = 0.051) evaluated in HCMR cases (n = 36) and participants from the UKBB (n = 12). Linear regression lines are denoted in blue, with 95% Cls in gray. P values are uncorrected for multiple testing.
Observational studies have shown that hypertension, obesity and type 2 diabetes are more prevalent in individuals with HCM, but these could be secondary to reduced exercise8,18,19. We performed two-sample Mendelian randomization to leverage large-scale GWASs for these heritable traits20–23. We inferred causal relationships with HCM for hypertension and obesity, but not diabetes (Fig. 4 and Supplementary Table 19). Most notably, diastolic blood pressure (DBP) appeared to be a substantial risk factor for the development of sarcomere-negative HCM (Fig. 4 and Supplementary Table 19). A 1 s.d. unit increase in DBP (11.3 mmHg) conferred a fourfold increased risk of HCM (OR = 3.93 (95% CI = 2.86–5.41); P = 3.74 × 10⁻¹⁶)—more than double the risk typically observed for other diseases associated with DBP (Fig. 4 and Supplementary Table 20)24–28. The strong association with hypertension raises the possibility that sarcomere-negative HCM may represent, in part, an exaggerated response to hypertension in genetically susceptible individuals. The association specifically with DBP probably reflects that this is the dominant form of hypertension in young and mid-adult life29,30.
Fig. 4 |. Two-sample inverse-variance-weighted Mendelian randomization identifies modifiable risk factors for HCM.

a, Effect of presumed risk phenotypes, based on previous observational evidence, on sarcomere-positive (n = 871) and sarcomere-negative (n = 1,635) HCM. ORs are represented per standard deviation for systolic blood pressure (SBP), DBP, body mass index (BMI) and waist-to-hip ratio adjusted for BMI (WHRadjBMI). The error bars represent 95% CIs. As type 2 diabetes is a binary phenotype, risk is represented as the per log-odds unit of type 2 diabetes. b, Relative impact of DBP on sarcomere-positive and sarcomere-negative HCM susceptibility in relation to other established hypertension-associated phenotypes. The OR was measured per standard deviation of DBP (11.3 mmHg). The error bars represent 95% CIs. Ischemic stroke reflects all TOAST subtypes. Numbers of cases and controls, respectively, were as follows: 47,309 and 930,014 for heart failure; 65,446 and 522,744 for atrial fibrillation; 9,006 and 454,450 for cardioembolic stroke; 60,341 and 454,450 for ischemic stroke; 74,124 and 824,006 for type 2 diabetes; 64,164 and 625,219 for chronic kidney disease; and 122,733 and 424,528 for coronary artery disease.
The individual loci identified in this study hold great potential for driving new insights into cardiomyopathy pathogenesis. Many of the association signals have already been replicated; others will need further study to guard against false positive findings. Collectively, our findings highlight the important influence of common variants on the risk of developing HCM. The polygenic contribution is weaker in individuals with pathogenic sarcomeric variants, but a common-variant GRS may still be particularly useful here because the high prior risk means that the modest (for example, fourfold) changes in individual-specific penetrance, which will apply to 40% of individuals, will have a large absolute effect on outcome. Additionally, it appears that common variants explain part of the variable expressivity of pathogenic sarcomeric variants. The clinical utility of a GRS now needs study in adequately powered longitudinal surveys of HCM disease progression, especially in sarcomere-positive individuals who were limited in number in the current study. In individuals lacking cardinal pathogenic mutations in sarcomeric genes, we suggest that extremes of the polygenic risk distribution (for example, the top 1% of the population), combined with causal risk factors, drive individual susceptibility. Managing sarcomere-negative patients with HCM and their relatives may be greatly facilitated by awareness of the strong influence of polygenic risk and of DBP as a major modifiable risk factor.
Methods
GWAS in multi-ancestry HCMR cases versus UKBB controls.
As described in Neubauer et al.8, 2,755 incident HCM cases were recruited from 44 sites across six countries in North America and Europe. The cases were 18–65 years of age with evidence of unexplained left ventricular hypertrophy (wall thickness > 15 mm)31. All participants provided written informed consent (South Central – Oxford A Research Ethics Committee approval: 14/SC/0190; clinicaltrials.gov identifier: NCT01915615). Genotyping was performed using the Axiom Precision Medicine Research Array (Affymetrix/Thermo Fisher Scientific). Following quality control, 2,541 individuals who were not closely related (that is, those with more than three degrees of relatedness) were available for analysis. Gene panel sequence data, generated using a custom-designed TruSeq kit (Illumina), were available on 2,636 HCMR cases, as reported previously8,32. Variant classification was performed for the eight core sarcomere genes (MYBPC3, MYH7, TNNI3, TNNT2, MYL2, MYL3, ACTC1 and TPM1) using the American College of Medical Genetics and Genomics guidelines33. Cases were systematically dichotomized into sarcomere-positive (n = 871) or sarcomere-negative (n = 1,635) groups using a published, evidence-based framework (Supplementary Tables 9 and 10)8,34. Details of the rare variants used to partition cases are reported (Supplementary Tables 21 and 22). Access to the UKBB genotypes was provided through application 11223 (UK Research Ethics Committee approval: 11/NW/0382). Genotyping was performed using the UKBB Axiom array (Affymetrix). Individuals who underwent genotyping using the UK BiLEVE array, or who had asked to be withdrawn from the UKBB, as of 16 October 2018, were excluded. Individuals with an International Classification of Diseases 10th Revision code indicating HCM (I420 or I421), or other phenotypes that may confound HCM analyses (Supplementary Table 23) in Hospital Episode Statistics data or self-reported questionnaire fields, were excluded (n = 15,901). Individuals in the UKBB exome sequencing subset (n = 49,959) who harbored variants of uncertain significance (VUSs), likely pathogenic or pathogenic variants in the core sarcomere genes were excluded. Closely related individuals (within three degrees of relatedness) and gender mismatches were excluded. Of the remaining 270,260 individuals, 40,283 were randomly selected for subsequent analysis, sampled using a 20:1 allocation against HCMR cases (n = 2,541), with approximate age (per decade) and genotype-assigned sex matching.
The HCMR (Precision Medicine Research Array (Affymetrix)) and UKBB (Axiom array (Affymetrix)) cohorts were genotyped on partially overlapping arrays. In total, 174,974 SNPs (MAF > 0.01; genotype missing rate: 1%, Hardy–Weinberg equilibrium with mid-P correction of 1 × 10⁻⁹) present in both the HCMR and UKBB cohorts were extracted for subsequent analysis. The UKBB and HCMR SNPs were aligned to the Haplotype Reference Consortium (HRC) reference panel (using HRC-1000G-check-bim.pl from https://www.well.ox.ac.uk/~wrayner/tools/) before being merged.
Principal component analysis was then performed using FlashPCA2 on a subset of SNPs in approximate linkage equilibrium (r2 < 0.05), determined using the --indep-pairwise function in PLINK (version 1.90b3). Ancestry was inferred by projecting principal components, derived from the 1000 Genomes Project (Phase 3), onto HCMR/UKBB genotypes. A multinomial logistic regression model, performed using the nnet CRAN package in R (https://CRAN.R-project.org/package=nnet), classified ancestral groups as specified by the International Genome Sample Resource (http://www.internationalgenome.org/category/population/) (Supplementary Table 1). The Michigan Imputation Server35 (https://imputationserver.sph.umich.edu/) performed haplotype phasing with Eagle36, as well as imputation against the HRC (version r1.1.2016 reference panel)37, generating genotypes for 38,954,302 imputed variants. Imputed variants with an INFO score > 0.3 and MAF > 0.01 were retained for subsequent analysis.
An all-comer analysis (2,541 HCM cases versus 40,283 controls) and separate sarcomere-positive (871 versus 20,142) and sarcomere-negative HCM analyses (1,635 versus 20,141) were performed. The UKBB controls were randomly allocated to either the sarcomere-positive or sarcomere-negative GWAS.
Analyses were performed with logistic regression to fit an additive case–control association model, using the SNPTEST version 2.5.4-beta3 newml function, adjusting for the first ten ancestry-informative principal components. As HCM is a disease of relatively low prevalence (~1 in 500), statistical power was maximized by not adjusting for age or sex38. There was no evidence of extreme population stratification in genomic control analyses (all-comers: original λ = 1.191; sarcomere positive: λ = 1.089; sarcomere negative: pre-λGC = 1.142). A genomic control adjustment was performed when λ exceeded 1.1.
Multi-ancestry BRRD case–control GWAS.
Details regarding the BRRD cohort—a pilot study of the Genomics England 100,000 Genomes Project (GeL)—have been described elsewhere39. All participants provided written informed consent (East of England – Cambridge South REC approval: 13/EE/0325). Briefly, 13,037 individuals from 20 rare disease areas underwent genome sequencing, including 243 individuals diagnosed with sarcomere-negative HCM4. Individuals clinically diagnosed with HCM, with diagnostic criteria as for HCMR, were recruited via inherited cardiac condition clinics within the United Kingdom (Oxford University Hospitals NHS Foundation Trust, Royal Brompton and Harefield NHS Foundation Trust, Guy’s and St Thomas’ NHS Foundation Trust and the Newcastle Upon Tyne Hospitals NHS Foundation Trust). Recruited individuals were aged 18–70 years, or >70 years when there was a positive family history, with an absence of likely pathogenic or pathogenic variants across 13 well-established HCM genes (sarcomeric genes (MYBPC3, MYH7, TNNI3, TNNT2, MYL2, MYL3, ACTC1 and TPM1), other, non-sarcomeric, but robustly associated HCM genes (CSRP3 and PLN) and phenocopy genes (PRKAG2, GLA and FHL1))4.
Reference controls were recruited from the other BRRD rare disease participants or their family members. Individuals recruited via the GeL pilot study for the purposes of investigating an inherited cardiac condition were excluded. Overall, 239 cases and 7,203 controls were available for analysis and high-quality variants were extracted from the respective genome sequencing variant call format files. High-quality variants were defined as those that had: PASS filter status; MAF > 1%; a depth of at least ten informative reads per site; a genotype quality score of at least 20; and a genotype missingness of no more than 10%. Multiallelic sites were split. Ancestrally informative principal components were derived using FastPCA2 and 1000 Genomes Phase 3 data (Supplementary Table 1). Association analysis was performed using SAIGE (version 0.29.4.2) with the first three principal components included as covariates40. SAIGE step 1 was performed using 123,903 genotypes following a linkage disequilibrium pruning procedure in PLINK (version 1.9), with a 500-kilobase (kb) window, a step size of 50 markers and a pairwise r2 threshold of 0.2 (refs. 41,42). SAIGE step 2 analysis was performed using genotypes with a minor allele count of >5 and a MAF of >0.01. Summary genetic association statistics for 9,341,129 autosomal variants were then computed using a mixed logistic regression model; a genomic control analysis showed little evidence of over-dispersion (λ = 1.049). The BRRD GWAS was included in the all-comer and sarcomere-negative meta-analyses.
HCM sarcomere carrier stratification.
Up to two-thirds of VUSs in confirmed sarcomere genes are considered causal of HCM34. To contrast the common-variant genetic architecture of patients with HCM carrying pathogenic variants in sarcomeric genes with non-carriers, individuals were assigned sarcomere-positive status if they harbored a variant classified as VUS-indeterminate, VUS-favors pathogenic, likely pathogenic or pathogenic in ACTC1, MYH7, MYL2, MYL3, TNNT2, TNNI3 and TPM1, or VUS-favors pathogenic, likely pathogenic or pathogenic in MYBPC3 (Supplementary Tables 9 and 10)8.
Heritability estimates.
SNP heritability (h2g) was estimated using GREML43 for SNPs demonstrating an INFO score of >0.3 and a MAF of >0.01. Linkage disequilibrium scores were assigned to SNPs from 200-kb blocks across the genome, before SNPs were stratified into quartiles based on SNP linkage disequilibrium scores to generate genomic relatedness matrices. The genomic relatedness matrices were subjected to restricted maximum likelihood analysis of case–control status with the first ten ancestry-informative principal components as covariates. h2g estimates were approximated on a liability scale representing binary traits (that is, cases versus controls) on a continuous scale; above a liability threshold, an individual will be affected. Representation of a binary trait on this classic multifactorial liability scale is dependent on both the population prevalence of disease (0.2% based on population-based epidemiological estimates) and the sample prevalence of disease. The prevalences of sarcomere-negative and sarcomere-positive HCM were set as 0.0012 and 0.0008, respectively (ref. 34).
Quality control.
EasyQC (version 9.2)44 was used for genotype quality control. The HRC reference panel was used for mapping and allele frequencies. Variants were removed if they were monomorphic, demonstrated a minor allele count of <6 or were absent from the HRC reference panel or duplicated. They were also removed when the observed allele frequency deviated by >0.2 from the HRC allele frequency.
Genomic inflation was assessed across all cohorts through calculation of the genomic control, λ, and by evaluating the overall P value distribution. Genomic control correction was performed when λ > 1.1, by adjusting the standard error (s.e.gc = s.e. × √λ) and re-calculating adjusted χ2 statistics and associated P values (under one degree of freedom).
The overall P value distributions, generated from each component study and meta-analysis, were plotted and assessed. Local FDRs were computed using the qvalue R package (https://github.com/StoreyLab/qvalue)45. The FDR provides a frequentist equivalent to the empirical Bayesian posterior probability that the null hypothesis is true, based on the distribution of generated P values. For genome-wide significance, an a priori α threshold of 5 × 10⁻⁸ was set, and an FDR threshold of 5% was calculated for each study46.
Meta-analysis.
All-comer (2,780 HCM cases versus 47,486 controls) and sarcomere-negative (1,874 cases versus 27,344 controls) fixed-effects inverse-variance meta-analysis analyses, incorporating the HCMR versus UKBB and BRRD versus BRRD component GWAS, were conducted using GWAMA47. Effect sizes, standard errors, effect allele frequency estimates and heterogeneity statistics (specifically Cochran’s statistic (Q)) were reported alongside q values and FDR values.
Replication.
Replication of HCM loci was performed in a smaller, independent dataset composed of three HCM case–control studies from the Netherlands (975 cases and 2,117 controls), Royal Brompton Hospital (RBH; 359 cases and 1,211 controls) and Canada (313 cases and 3,300 controls). No cases recruited to HCMR or BRRD were present in these replication cohorts. Meta-analysis of these three GWAS studies was performed using METAL (λ = 1.074). Detailed methods regarding these replication cohorts are available in Tadros et al.48.
Conditional association analysis.
To identify genetic variants that confer independent risk effects, conditional association analysis was performed using a stepwise model selection procedure (--cojo-slct) using GCTA49,50. Summary statistics were extracted from meta-analyses results or component GWAS studies, and linkage disequilibrium metrics were based on 62,018 unrelated European individuals randomly selected from the UKBB. For each analysis, the P value threshold was determined by a 5% FDR level.
Assessment of pleiotropy.
All independently associated variants, confirmed in a conditional analysis, were evaluated for association with other diseases or traits by cross-referencing publicly available databases via Open Targets51 (https://genetics.opentargets.org/), a web resource that synthesizes data from both the National Human Genome Research Institute–European Bioinformatics Institute GWAS catalog (https://www.ebi.ac.uk/gwas/) and previously published UKBB summary statistics (Supplementary Table 24)40. Associations between sentinel SNPs and their tagging SNPs (r2 > 0.8) and gene expression, proteins, metabolites or epigenetics were evaluated using PhenoScanner version 2.0 (Supplementary Table 25)52.
Genetic correlation.
To measure the genetic correlation between sarcomere-positive and sarcomere-negative HCM, bivariate GREML analysis was performed. The prevalences of sarcomere-negative and sarcomere-positive HCM were set at 0.0012 and 0.0008, respectively. The first ten ancestry-informative principal components were included as covariates. To assess the shared genetic effects between sarcomere-positive and sarcomere-negative HCM at individual loci, pairwise GWAS calculated the probability that a variant located within a locus contributed to either one, both or neither traits, or whether two separate signals within the same region contributed to each trait independently. Pairwise GWASs were performed using genomic regions 500 kb upstream and downstream of independent loci from the all-comer, sarcomere-positive and sarcomere-negative GWASs53.
Long-range linkage disequilibrium and spurious association.
Independent, genome-wide-significant variants on chromosome 11 (44,976,681–57,917,265) were identified due to their close proximity to MYBPC3, a HCM gene known to contain pathogenic founder variants, raising the possibility of long-range linkage disequilibrium and spurious association. Haplotypes were constructed using genotyped and imputed common variants (MAF > 0.2) in combination with rare MYBPC3 variants (p.Arg502Trp, p.Trp792ValfsTer41 and c.1224–52G > A) derived from gene panel data (HCM cases) or exome data (UKBB controls), in PLINK (version 1.90b3). HCM cases were limited to those individuals in whom a pathogenic or likely pathogenic variant in a core sarcomere gene had previously been identified (n = 851). Controls were drawn from the UKBB (n = 19,851). Haplotype structure was evaluated using a maximum likelihood method in Haploview (version 4.2)54. Given the presence of numerous zero-value genotype counts, multiple logistic regression association analysis was performed using the R logistf function. This method was used to model the independent effects of a rare pathogenic variant and a common variant on HCM risk while allowing for linkage disequilibrium between the two variants.
GRS.
After removing SNPs showing extreme pleiotropy or extreme ancestral bias (see Supplementary Note), a GRS that combined independent (that is, in linkage equilibrium) SNPs identified through the conditional analysis of the multi-ancestry meta-analysis was first tested in a component GWAS (HCMR versus UKBB) then validated in three independent studies: GeL (REC: 14/EE/1112); the RBH’s HCM case–control series; and a Netherlands HCM case–control series (Supplementary Table 16). Individuals recruited to both a discovery cohort and a validation cohort were identified and excluded from the validation cohort (51 individuals from the RBH series and 24 individuals from the Netherlands series). The cumulative genetic effect of the SNPs was calculated for each individual using the allelic scoring function in PLINK. The relative weight assigned to each SNP was the β estimate from the multi-ancestry meta-analysis joint model COJO (conditional and joint) results. Raw GRSs were plotted and evaluated before standardizing the GRS distribution to a mean of 0 and a variance of 1. A logistic regression model was fitted with affection status as the outcome variable and standardized GRS score as an explanatory variable, with covariates including the first ten principal components, age and gender. Cases from each validation dataset were dichotomized based on the presence of a rare causal variant in an established sarcomere gene into sarcomere-positive and sarcomere-negative cases (see Supplementary Note).
Expressivity analysis.
The two predominant classes of pathogenic HCM variants are MYBPC3 truncating variants and MYH7 missense variants, the mechanisms of which have been previously demonstrated55,56. The most frequently detected pathogenic variant, present in ~2% of HCM cases, is MYBPC3R502W. Variants classified using American College of Medical Genetics and Genomics guidelines as pathogenic or likely pathogenic in MYBPC3 and MYH7 were identified33,57. Ensembl’s Variant Effect Predictor was used to define variant consequences. Truncating variants included frameshift, stop gained and splice acceptor/donor variants.
For individuals in the HCMR cohort, maximum wall thickness measurements were derived from cardiac magnetic resonance (CMR) imaging (either 1.5 or 3.0 T) performed using a standardized protocol, multichannel phased-array chest coils and electrocardiographic gating, as previously reported8.
Variant carriers for MYBPC3R502W were identified in both the HCMR and UKBB cohorts. In the UKBB cohort, heterozygous MYBPC3R502W carriers, who had also undertaken UKBB-based CMR imaging, were identified using array-based genotypes (n = 12). Exome sequence data were available for six of these individuals; in all cases, the presence of MYBPC3R502W was confirmed, supporting previous analysis indicating that UKBB-based genotyping for MYBPC3R502W was satisfactory58,59. Demographic and phenotypic details were reviewed for MYBPC3R502W carriers, including International Classification of Diseases 10th Revision classifications and self-reported co-morbidities for HCM codes (I421 and I422). MYBPC3R502W carriers were age and sex matched 1:1 with a non-variant carrier from a sample of unrelated UKBB participants who had undertaken exome sequencing and CMR imaging and demonstrated no potentially disease-causing variant (that is, no HCM-associated variant of uncertain significance, likely pathogenic variant or pathogenic variant) or a previous diagnosis, reported via Hospital Episode Statistics data, that might confound CMR analyses (Supplementary Table 23). Long- and short-axis cine-tagged CMR data, generated by the UKBB as previously reported, were reviewed by an investigator blinded to variant carrier status, to minimize bias, when reporting maximum left ventricular wall thickness60. A linear regression model was used to approximate the effect of a standardized GRS (mean of 0 and variance of 1) against maximum left ventricular wall thickness in mm.
Mendelian randomization.
Mendelian randomization uses the random meiotic segregation of alleles to assess whether an association between a risk factor and an outcome is consistent with a causal effect. Two-sample Mendelian randomization leverages data from large-scale GWASs to infer causal relationships between two heritable traits. Observational data suggest several modifiable risk factors that may influence the phenotypic variability observed in HCM18,19,61,62. Genome-wide-significant loci for blood pressure (systolic blood pressure and DBP)21, body mass index/waist-to-hip ratio22 and type 2 diabetes20 were identified, and summary statistics were collated as instrumental variables. Effect alleles were harmonized between instrumental variables and the HCM summary statistics. Analyses were performed using MR-Base63. The corresponding SNPs were extracted from the sarcomere-positive and sarcomere-negative summary statistics and Mendelian randomization estimates generated using fixed and random-effects inverse-variance-weighted Mendelian randomization. Sensitivity analysis to test for horizontal pleiotropy was performed using MR-Egger, while analysis to test for robustness was performed by unweighted and weighted median regression. β values and standard errors were compared, for all risk factors, between sarcomere-positive and sarcomere-negative HCM. Additional two-sample Mendelian randomization was performed to further evaluate the relative effect of DBP on HCM, relative to other well-established risk factor–disease relationships (Supplementary Table 20).
Functional mapping and annotation.
Functional annotation of GWAS summary statistics was undertaken using FUMA (version 1.3.5e) (https://fuma.ctglab.nl/snp2gene)6 to link genotypes, eQTLs and chromatin interactions. Tissue enrichment was performed using MAGMA (version 1.07)—a gene-level analysis tool provided by FUMA—with tissue expression data from GTEx (version 8.0) (https://www.gtexportal.org/home)7. eQTLs were evaluated in heart tissue (atrial appendage and left ventricle). Chromatin interaction data were evaluated in left and right ventricular tissue, derived from previously reported Hi-C data (GSE87112)64.
Functional GWAS.
Functional GWAS (fGWAS) is software that assesses the enrichment of functional sites (such as histone marks and methylation data) within GWAS summary statistics65. fGWAS then uses these enrichment parameters to fine-map and re-weight GWAS loci.
Using multi-ancestry HCM meta-analysis summary statistics, fGWAS was performed using chromatin marks (enhancers, flanking/active transcription start sites (TSSs), active TSSs, genetic enhancers, repressed Polycomb, bivalent enhancers, transcription at the 5′ and 3′ ends of the gene, flanking/bivalent TSSs/enhancers and bivalent/poised TSSs) from the ChromHMM dataset of the Roadmap Epigenomics Project, for cardiac tissues (left ventricle (E095), fetal heart (E083), right ventricle (E105) and right atrium (E104))66,67. Enrichment estimates were generated for each tissue type, together with a list of loci below a 5% FDR significance threshold.
Reporting Summary.
Further information on research design is available in the Nature Research Reporting Summary linked to this article.
Supplementary Material
Acknowledgements
This work was supported by funding from the British Heart Foundation (BHF), the Medical Research Council (MRC), the National Heart, Lung, and Blood Institute (NIH grant U01HL117006-01A1), the Wellcome Trust (201543/B/16/Z), Wellcome Trust core awards (090532/Z/09/Z and 203141/Z/16/Z) and the National Institute for Health Research (NIHR) Oxford Biomedical Research Centre. A.R.H. has received support from the MRC Doctoral Training Partnership. A.G. has received support from the BHF, European Commission (LSHM-CT-2007-037273 and HEALTH-F2-2013-601456) and Tripartite Immunometabolism Consortium (TrIC)-NovoNordisk Foundation (NNF15CC0018486). S.E.P. acknowledges support from the NIHR Barts Biomedical Research Centre. A.W. has received support from the Wellcome Trust. S.N., M.F. and H.W. are members of the Oxford BHF Centre of Research Excellence (RE/13/1/30181). We are grateful for access to the high-performance Oxford Biomedical Research Computing (BMRC) facility, a joint development between the Wellcome Centre for Human Genetics and the Big Data Institute that is supported by Health Data Research UK and the NIHR Oxford Biomedical Research Centre. The views expressed are those of the author(s) and do not necessarily reflect those of the NHS, NIHR, Department of Health or Department of Health and Social Care. We thank the NIHR BioResource volunteers for their participation and gratefully acknowledge the NIHR BioResource centers, NHS Trusts and staff for their contribution. We thank the NIHR and NHS Blood and Transplant. This research was made possible through access to the data and findings generated by the 100,000 Genomes Project, which is managed by Genomics England (a wholly owned company of the Department of Health and Social Care) and funded by the NIHR and NHS England with research infrastructure funding from the Wellcome Trust, Cancer Research UK and the MRC. The 100,000 Genomes Project uses data provided by patients and collected by the National Health Service as part of their care and support. We acknowledge the contribution of the Oxford Medical Genetics Laboratories.
HCMR Investigators
Paul Kolm11, Raymond Kwong12, Sarahfaye F. Dolman11, Patrice Desvigne-Nickens13, John P. Dimarco14, Nancy Geller13, Dong-Yun Kim13, Cheng Zhang11, William Weintraub11, Theodore Abraham15, Lisa Anderson16, Evan Appelbaum17, Camillo Autore18, Colin Berry19, Elena Biagini20, William Bradlow21, Chiara Bucciarelli-Ducci22, Amedeo Chiribiri23, Lubna Choudhury24, Andrew Crean25, Dana Dawson26, Milind Y. Desai27, Eleanor Elstein28, Andrew Flett29, Matthias Friedrich30, Stephen Heitner31, Adam Helms32, Daniel L. Jacoby33, Han Kim34, Bette Kim35, Eric Larose36, Masliza Mahmod37, Heiko Mahrholdt38, Martin Maron39, Gerry McCann40, Michelle Michels41, Saidi Mohiddin42, Sherif Nagueh43, David Newby44, Iacopo Olivotto45, Anjali Owens46, F. Pierre-Mongeon47, Sanjay Prasad48, Ornella Rimoldi49, Michael Salerno50, Jeanette Schulz-Menger51, Mark Sherrid52, Peter Swoboda53, Albert van Rossum54, Jonathan Weinsaft55, James White56 and Eric Williamson57
11MedStar Heart and Vascular Institute, Washington, DC, USA. 12Cardiovascular Division, Departments of Medicine and Radiology, Brigham and Women’s Hospital, Boston, MA, USA. 13National Heart, Lung, and Blood Institute, Bethesda, MD, USA. 14Cardiovascular Division, University of Virginia Health System, Charlottesville, VA, USA. 15Hypertrophic Cardiomyopathy Center of excellence, Johns Hopkins University, Baltimore, MD, USA. 16St George’s University Hospitals NHS Foundation Trust, London, UK. 17Departments of Medicine (Cardiovascular Division) and Radiology, Beth Israel Deaconess Medical Center, Harvard Medical School, Boston, MA, USA. 18Division of Cardiology, Department of Clinical and Molecular Medicine, St. Andrea Hospital, Sapienza University, Rome, Italy. 19British Heart Foundation Glasgow Cardiovascular Research Centre, Institute of Cardiovascular and Medical Sciences, University of Glasgow, Glasgow, UK. 20Cardio-Thoraco-Vascular Department, University Hospital of Bologna, Policlinico S. Orsola-Malpighi, Bologna, Italy. 21Department of Cardiology, New Queen elizabeth Hospital Birmingham, Birmingham, UK. 22Bristol Heart Institute, NIHR Bristol Biomedical Research Centre, University Hospitals Bristol NHS Foundation Trust and University of Bristol, Bristol, UK. 23Cardiovascular Division, King’s College London British Heart Foundation Centre of Research excellence, The Rayne Institute, St. Thomas’ Hospital, London, UK. 24Division of Cardiology, Department of Medicine, Bluhm Cardiovascular Institute, Northwestern University Feinberg School of Medicine, Chicago, IL, USA. 25Division of Cardiology, Peter Munk Cardiac Center, University Health Network, University of Toronto, Toronto, Ontario, Canada. 26Aberdeen Cardiovascular and Diabetes Centre, University of Aberdeen, Aberdeen, UK. 27Department of Cardiovascular Medicine, Center for Radiation Heart Disease, Heart and Vascular Institute, Cleveland Clinic, Cleveland, OH, USA. 28Division of Cardiology, Department of Medicine, Royal Victoria Hospital, McGill University Health Centre, Montréal, Québec, Canada. 29Department of Cardiology, University Hospital Southampton NHS Foundation Trust, Southampton, UK. 30Department of Medicine, Heidelberg University, Heidelberg, Germany. 31Division of Cardiovascular Medicine, Knight Cardiovascular Institute, Oregon Health and Sciences University (OHSU), Portland, OR, USA. 32Department of Internal Medicine, University of Michigan, Ann Arbor, MI, USA. 33Section of Cardiovascular Medicine, Department of Internal Medicine, Yale School of Medicine, New Haven, CT, USA. 34Duke Cardiovascular Magnetic Resonance Center and Division of Cardiology, Duke University Medical Center, Durham, NC, USA. 35Mount Sinai West, Icahn School of Medicine at Mount Sinai, New York, NY, USA. 36Quebec Heart and Lung Institute, Laval University, Québec City, Québec, Canada. 37Division of Cardiovascular Medicine, Radcliffe Department of Medicine, University of Oxford, Oxford, UK. 38Department of Cardiology, Robert Bosch Hospital, Stuttgart, Germany. 39Hypertrophic Cardiomyopathy Center and Research Institute, Tufts Medical Center, Boston, MA, USA. 40Department of Cardiovascular Sciences, University of Leicester, Leicester, UK. 41erasmus University, Rotterdam, the Netherlands. 42Barts Heart Centre, The Cardiovascular Magnetic Resonance Imaging Unit, St Bartholomew’s Hospital, London, UK. 43Methodist DeBakey Heart and Vascular Center, Houston, TX, USA. 44Centre for Cardiovascular Science, University of edinburgh, edinburgh, UK. 45Cardiomyopathy Unit and Genetic Unit, Careggi University Hospital, Florence, Italy. 46Centre for Inherited Cardiovascular Disease, Division of Cardiovascular Medicine, Perelman School of Medicine, University of Pennsylvania, Philadelphia, PA, USA. 47Montréal Heart Institute, Montréal, Québec, Canada. 48National Heart and Lung Institute, Imperial College London and Royal Brompton Hospital, London, UK. 49Vita Salute University and San Raffaele Hospital, Milan, Italy. 50Department of Medicine, University of Virginia, Charlottesville, VA, USA. 51Charité, Medical Faculty of the Humboldt University, experimental and Clinical Research Center and Helios Clinics Cardiology Department, Berlin, Germany. 52Hypertrophic Cardiomyopathy Program, Leon H. Charney Division of Cardiology, Department of Medicine, New York University School of Medicine, New York, NY, USA. 53Department of Cardiovascular Imaging Science, Leeds Institute of Cardiovascular and Metabolic Medicine, University of Leeds, Leeds, UK. 54Department of Cardiology, Amsterdam UMC, Amsterdam, the Netherlands. 55Departments of Medicine and Radiology, Weill Cornell Medical College, New York, NY, USA. 56Calgary Foothills Medical Centre, University of Calgary, Calgary, Alberta, Canada. 57Department of Radiology, Mayo Clinic, Rochester, MN, USA.
Footnotes
Competing interests
As of April 2020, A.R.H. is an employee of AstraZeneca.
Additional information
Supplementary information is available for this paper at https://doi.org/10.1038/s41588-020-00764-0.
Peer review information Nature Genetics thanks the anonymous reviewers for their contribution to the peer review of this work.
Reprints and permissions information is available at www.nature.com/reprints.
Online content
Any methods, additional references, Nature Research reporting summaries, source data, extended data, supplementary information, acknowledgements, peer review information; details of author contributions and competing interests; and statements of data and code availability are available at https://doi.org/10.1038/s41588-020-00764-0.
Code availability
Publicly available software tools were used to analyze these data. These include: SAIGE (https://github.com/weizhouUMICH/SAIGE), SNPTEST (https://mathgen.stats.ox.ac.uk/genetics_software/snptest/snptest.html), GCTA (https://cnsgenomics.com/software/gcta/), PLINK (https://www.cog-genomics.org/plink/1.9/data), BGENIX (https://bitbucket.org/gavinband/bgen/wiki/bgenix), QCTOOL (https://www.well.ox.ac.uk/~gav/qctool_v2/), GWAMA (https://genomics.ut.ee/en/tools/gwama) and MR-Base (http://www.mrbase.org/).
Publisher’s note Springer Nature remains neutral with regard to jurisdictional claims in published maps and institutional affiliations.
Data availability
All of the relevant data are included within the paper and/or its Supplementary Information files. The datasets generated during this study are available from the corresponding author upon reasonable request. The institutional domain www.well.ox.ac.uk/hcm will provide summary-level statistics.
References
- 1.Yotti R, Seidman CE & Seidman JG Advances in the genetic basis and pathogenesis of sarcomere cardiomyopathies. Annu. Rev. Genomics Hum. Genet. 20, 129–153 (2019). [DOI] [PubMed] [Google Scholar]
- 2.Harper AR, Parikh VN, Goldfeder RL, Caleshu C & Ashley EA Delivering clinical grade sequencing and genetic test interpretation for cardiovascular medicine. Circ. Cardiovasc. Genet. 10, e001221 (2017). [DOI] [PubMed] [Google Scholar]
- 3.Watkins H, Ashrafian H & Redwood C Inherited cardiomyopathies. N. Engl. J. Med. 364, 1643–1656 (2011). [DOI] [PubMed] [Google Scholar]
- 4.Thomson KL et al. Analysis of 51 proposed hypertrophic cardiomyopathy genes from genome sequencing data in sarcomere negative cases has negligible diagnostic yield. Genet. Med 21, 1576–1584 (2019). [DOI] [PMC free article] [PubMed] [Google Scholar]
- 5.Ingles J et al. Nonfamilial hypertrophic cardiomyopathy: prevalence, natural history and clinical implication. Circ. Cardiovasc. Genet 10, e001620 (2017). [DOI] [PubMed] [Google Scholar]
- 6.Watanabe K, Taskesen E, Van Bochoven A & Posthuma D Functional mapping and annotation of genetic associations with FUMA. Nat. Commun 8, 1826 (2017). [DOI] [PMC free article] [PubMed] [Google Scholar]
- 7.GTEx Consortium. The GTEx Consortium atlas of genetic regulatory effects across human tissues. Science 369, 1318–1330 (2020). [DOI] [PMC free article] [PubMed] [Google Scholar]
- 8.Neubauer S et al. Distinct subgroups in hypertrophic cardiomyopathy in the NHLBI HCM Registry. J. Am. Coll. Cardiol 74, 2333–2345 (2019). [DOI] [PMC free article] [PubMed] [Google Scholar]
- 9.Wray NR, Purcell SM & Visscher PM Synthetic associations created by rare variants do not explain most GWAS results. PLoS Biol. 9, e1000579 (2011). [DOI] [PMC free article] [PubMed] [Google Scholar]
- 10.Dickson SP, Wang K, Krantz I, Hakonarson H & Goldstein DB Rare variants create synthetic genome-wide associations. PLoS Biol. 8, e1000294 (2010). [DOI] [PMC free article] [PubMed] [Google Scholar]
- 11.Orozco G, Barrett JC & Zeggini E Synthetic associations in the context of genome-wide association scan signals. Hum. Mol. Genet 19, R137–R144 (2010). [DOI] [PMC free article] [PubMed] [Google Scholar]
- 12.Wooten EC et al. Formin homology 2 domain containing 3 variants associated with hypertrophic cardiomyopathy. Circ. Cardiovasc. Genet 6, 10–18 (2013). [DOI] [PMC free article] [PubMed] [Google Scholar]
- 13.Ochoa JP et al. Formin homology 2 domain containing 3 (FHOD3) is a genetic basis for hypertrophic cardiomyopathy. J. Am. Coll. Cardiol 72, 2457–2467 (2018). [DOI] [PubMed] [Google Scholar]
- 14.Esslinger U et al. Exome-wide association study reveals novel susceptibility genes to sporadic dilated cardiomyopathy. PLoS ONE 12, e0172995 (2017). [DOI] [PMC free article] [PubMed] [Google Scholar]
- 15.Selcen D et al. Mutation in BAG3 causes severe dominant childhood muscular dystrophy. Ann. Neurol 65, 83–89 (2009). [DOI] [PMC free article] [PubMed] [Google Scholar]
- 16.Odgerel Z et al. Inheritance patterns and phenotypic features of myofibrillar myopathy associated with a BAG3 mutation. Neuromuscul. Disord. 20, 438–442 (2010). [DOI] [PMC free article] [PubMed] [Google Scholar]
- 17.Villard E et al. A genome-wide association study identifies two loci associated with heart failure due to dilated cardiomyopathy. Eur. Heart J. 32, 1065–1076 (2011). [DOI] [PMC free article] [PubMed] [Google Scholar]
- 18.Fumagalli C et al. Association of obesity with adverse long-term outcomes in hypertrophic cardiomyopathy. JAMA Cardiol. 5, 65–72 (2019). [DOI] [PMC free article] [PubMed] [Google Scholar]
- 19.Ho CY et al. Genotype and lifetime burden of disease in hypertrophic cardiomyopathy. Circulation 138, 1387–1398 (2018). [DOI] [PMC free article] [PubMed] [Google Scholar]
- 20.Mahajan A et al. Fine-mapping type 2 diabetes loci to single-variant resolution using high-density imputation and islet-specific epigenome maps. Nat. Genet 50, 1505–1513 (2018). [DOI] [PMC free article] [PubMed] [Google Scholar]
- 21.Evangelou E et al. Genetic analysis of over 1 million people identifies 535 new loci associated with blood pressure traits. Nat. Genet 50, 1412–1425 (2018). [DOI] [PMC free article] [PubMed] [Google Scholar]
- 22.Pulit SL et al. Meta-analysis of genome-wide association studies for body fat distribution in 694 649 individuals of European ancestry. Hum. Mol. Genet 28, 166–174 (2019). [DOI] [PMC free article] [PubMed] [Google Scholar]
- 23.Yengo L et al. Meta-analysis of genome-wide association studies for height and body mass index in ~700 000 individuals of European ancestry. Hum. Mol. Genet 27, 3641–3649 (2018). [DOI] [PMC free article] [PubMed] [Google Scholar]
- 24.Van der Harst P & Verweij N Identification of 64 novel genetic loci provides an expanded view on the genetic architecture of coronary artery disease. Circ. Res. 122, 433–443 (2018). [DOI] [PMC free article] [PubMed] [Google Scholar]
- 25.Roselli C et al. Multi-ethnic genome-wide association study for atrial fibrillation. Nat. Genet 50, 1225–1233 (2018). [DOI] [PMC free article] [PubMed] [Google Scholar]
- 26.Wuttke M et al. A catalog of genetic loci associated with kidney function from analyses of a million individuals. Nat. Genet 51, 957–972 (2019). [DOI] [PMC free article] [PubMed] [Google Scholar]
- 27.Malik R et al. Multiancestry genome-wide association study of 520,000 subjects identifies 32 loci associated with stroke and stroke subtypes. Nat. Genet 50, 524–537 (2018). [DOI] [PMC free article] [PubMed] [Google Scholar]
- 28.Shah S et al. Genome-wide association and Mendelian randomisation analysis provide insights into the pathogenesis of heart failure. Nat. Commun 11, 163 (2020). [DOI] [PMC free article] [PubMed] [Google Scholar]
- 29.Franklin SS et al. Predictors of new-onset diastolic and systolic hypertension: the Framingham Heart Study. Circulation 111, 1121–1127 (2005). [DOI] [PubMed] [Google Scholar]
- 30.Franklin SS, Jacobs MJ, Wong ND, L’Italien GJ & Lapuerta P Predominance of isolated systolic hypertension among middle-aged and elderly US hypertensives: analysis based on National Health and Nutrition Examination Survey (NHANES) III. Hypertension 37, 869–874 (2001). [DOI] [PubMed] [Google Scholar]
- 31.Gersh BJ et al. 2011 ACCF/AHA guideline for the diagnosis and treatment of hypertrophic cardiomyopathy: a report of the American College of Cardiology Foundation/American Heart Association task force on practice guidelines. Circulation 124, e783–e831 (2011). [DOI] [PubMed] [Google Scholar]
- 32.Harper AR et al. A re-evaluation of the South Asian MYBPC3Δ25bp intronic deletion in hypertrophic cardiomyopathy. Circ. Genom. Precis. Med 13, e002783 (2020). [DOI] [PMC free article] [PubMed] [Google Scholar]
- 33.Richards S et al. Standards and guidelines for the interpretation of sequence variants: a joint consensus recommendation of the American College of Medical Genetics and Genomics and the Association for Molecular Pathology. Genet. Med 17, 405–424 (2015). [DOI] [PMC free article] [PubMed] [Google Scholar]
- 34.Walsh R et al. Reassessment of Mendelian gene pathogenicity using 7,855 cardiomyopathy cases and 60,706 reference samples. Genet. Med 19, 192–203 (2017). [DOI] [PMC free article] [PubMed] [Google Scholar]
- 35.Das S et al. Next-generation genotype imputation service and methods. Nat. Genet 48, 1284–1287 (2016). [DOI] [PMC free article] [PubMed] [Google Scholar]
- 36.Loh PR, Palamara PF & Price AL Fast and accurate long-range phasing in a UK Biobank cohort. Nat. Genet 48, 811–816 (2016). [DOI] [PMC free article] [PubMed] [Google Scholar]
- 37.McCarthy S et al. A reference panel of 64,976 haplotypes for genotype imputation. Nat. Genet 48, 1279–1283 (2016). [DOI] [PMC free article] [PubMed] [Google Scholar]
- 38.Pirinen M, Donnelly P & Spencer CCA Including known covariates can reduce power to detect genetic effects in case–control studies. Nat. Genet 44, 848–851 (2012). [DOI] [PubMed] [Google Scholar]
- 39.Turro E et al. Whole-genome sequencing of patients with rare diseases in a national health system. Nature 583, 96–102 (2020). [DOI] [PMC free article] [PubMed] [Google Scholar]
- 40.Zhou W et al. Efficiently controlling for case–control imbalance and sample relatedness in large-scale genetic association studies. Nat. Genet 50, 1335–1341 (2018). [DOI] [PMC free article] [PubMed] [Google Scholar]
- 41.Chang CC et al. Second-generation PLINK: rising to the challenge of larger and richer datasets. Gigascience 4, 7 (2015). [DOI] [PMC free article] [PubMed] [Google Scholar]
- 42.Purcell S et al. PLINK: a tool set for whole-genome association and population-based linkage analyses. Am. J. Hum. Genet 81, 559–575 (2007). [DOI] [PMC free article] [PubMed] [Google Scholar]
- 43.Yang J, Zeng J, Goddard ME, Wray NR & Visscher PM Concepts, estimation and interpretation of SNP-based heritability. Nat. Genet 49, 1304–1310 (2017). [DOI] [PubMed] [Google Scholar]
- 44.Winkler TW et al. Quality control and conduct of genome-wide association meta-analyses. Nat. Protoc 9, 1192–1212 (2014). [DOI] [PMC free article] [PubMed] [Google Scholar]
- 45.Storey JD & Tibshirani R Statistical significance for genomewide studies. Proc. Natl Acad. Sci. USA 100, 9440–9445 (2003). [DOI] [PMC free article] [PubMed] [Google Scholar]
- 46.Nelson CP et al. Association analyses based on false discovery rate implicate new loci for coronary artery disease. Nat. Genet 49, 1385–1391 (2017). [DOI] [PubMed] [Google Scholar]
- 47.Mägi R & Morris AP GWAMA: software for genome-wide association meta-analysis. BMC Bioinformatics 11, 288 (2010). [DOI] [PMC free article] [PubMed] [Google Scholar]
- 48.Tadros R et al. Shared genetic pathways contribute to risk of hypertrophic and dilated cardiomyopathies with opposite directions of effect. Nat. Genet 10.1038/s41588-020-00762-2 (2021). [DOI] [PMC free article] [PubMed] [Google Scholar]
- 49.Yang J, Lee SH, Goddard ME & Visscher PM GCTA: a tool for genome-wide complex trait analysis. Am. J. Hum. Genet 88, 76–82 (2011). [DOI] [PMC free article] [PubMed] [Google Scholar]
- 50.Yang J et al. Conditional and joint multiple-SNP analysis of GWAS summary statistics identifies additional variants influencing complex traits. Nat. Genet 44, 369–375 (2012). [DOI] [PMC free article] [PubMed] [Google Scholar]
- 51.Carvalho-Silva D et al. Open targets platform: new developments and updates two years on. Nucleic Acids Res. 47, D1056–D1065 (2019). [DOI] [PMC free article] [PubMed] [Google Scholar]
- 52.Kamat MA et al. PhenoScanner V2: an expanded tool for searching human genotype–phenotype associations. Bioinformatics 35, 4851–4853 (2019). [DOI] [PMC free article] [PubMed] [Google Scholar]
- 53.Pickrell JK et al. Detection and interpretation of shared genetic influences on 42 human traits. Nat. Genet 48, 709–717 (2016). [DOI] [PMC free article] [PubMed] [Google Scholar]
- 54.Barrett JC, Fry B, Maller J & Daly MJ Haploview: analysis and visualization of LD and haplotype maps. Bioinformatics 21, 263–265 (2005). [DOI] [PubMed] [Google Scholar]
- 55.Toepfer CN et al. Hypertrophic cardiomyopathy mutations in MYBPC3 dysregulate myosin. Sci. Transl. Med 11, eaat1199 (2019). [DOI] [PMC free article] [PubMed] [Google Scholar]
- 56.Toepfer CN et al. Myosin sequestration regulates sarcomere function, cardiomyocyte energetics, and metabolism, informing the pathogenesis of hypertrophic cardiomyopathy. Circulation 141, 828–842 (2020). [DOI] [PMC free article] [PubMed] [Google Scholar]
- 57.Kelly MA et al. Adaptation and validation of the ACMG/AMP variant classification framework for MYH7-associated inherited cardiomyopathies: recommendations by ClinGen’s Inherited Cardiomyopathy Expert Panel. Genet. Med 20, 351–359 (2018). [DOI] [PMC free article] [PubMed] [Google Scholar]
- 58.Wright CF et al. Assessing the pathogenicity, penetrance, and expressivity of putative disease-causing variants in a population setting. Am. J. Hum. Genet 104, 275–286 (2019). [DOI] [PMC free article] [PubMed] [Google Scholar]
- 59.Van Hout CV et al. Exome sequencing and characterization of coding variation in 49,960 individuals in the UK Biobank. Nature 586, 749–756 (2020). [DOI] [PMC free article] [PubMed] [Google Scholar]
- 60.Petersen SE et al. UK Biobank’s cardiovascular magnetic resonance protocol. J. Cardiovasc. Magn. Reson 18, 8 (2016). [DOI] [PMC free article] [PubMed] [Google Scholar]
- 61.Karam R, Lever HM & Healy BP Hypertensive hypertrophic cardiomyopathy or hypertrophic cardiomyopathy with hypertension? A study of 78 patients. J. Am. Coll. Cardiol 13, 580–584 (1989). [DOI] [PubMed] [Google Scholar]
- 62.Wasserstrum Y et al. The impact of diabetes mellitus on the clinical phenotype of hypertrophic cardiomyopathy. Eur. Heart J 40, 1671–1677 (2019). [DOI] [PubMed] [Google Scholar]
- 63.Hemani G et al. The MR-Base platform supports systematic causal inference across the human phenome. eLife 7, e34408 (2018). [DOI] [PMC free article] [PubMed] [Google Scholar]
- 64.Schmitt AD et al. A compendium of chromatin contact maps reveals spatially active regions in the human genome. Cell Rep. 17, 2042–2059 (2016). [DOI] [PMC free article] [PubMed] [Google Scholar]
- 65.Pickrell JK Joint analysis of functional genomic data and genome-wide association studies of 18 human traits. Am. J. Hum. Genet 94, 559–573 (2014). [DOI] [PMC free article] [PubMed] [Google Scholar]
- 66.Ernst J & Kellis M ChromHMM: automating chromatin-state discovery and characterization. Nat. Methods 3, 215–216 (2012). [DOI] [PMC free article] [PubMed] [Google Scholar]
- 67.Roadmap Epigenomics Consortium et al. Integrative analysis of 111 reference human epigenomes. Nature 518, 317–330 (2015). [DOI] [PMC free article] [PubMed] [Google Scholar]
Associated Data
This section collects any data citations, data availability statements, or supplementary materials included in this article.
Supplementary Materials
Data Availability Statement
All of the relevant data are included within the paper and/or its Supplementary Information files. The datasets generated during this study are available from the corresponding author upon reasonable request. The institutional domain www.well.ox.ac.uk/hcm will provide summary-level statistics.