

SUMMARY
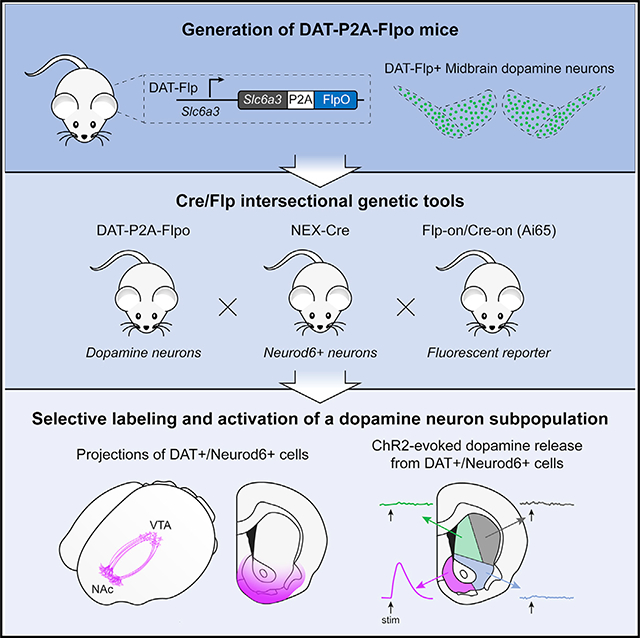
Dopaminergic projections exert widespread influence over multiple brain regions and modulate various behaviors including movement, reward learning, and motivation. It is increasingly appreciated that dopamine neurons are heterogeneous in their gene expression, circuitry, physiology, and function. Current approaches to target dopamine neurons are largely based on single gene drivers, which either label all dopamine neurons or mark a subset but concurrently label non-dopaminergic neurons. Here, we establish a mouse line with Flpo recombinase expressed from the endogenous Slc6a3 (dopamine active transporter [DAT]) locus. DAT-P2A-Flpo mice can be used together with Cre-expressing mouse lines to efficiently and selectively label dopaminergic subpopulations using Cre/Flp-dependent intersectional strategies. We demonstrate the utility of this approach by generating DAT-P2A-Flpo;NEX-Cre mice that specifically label Neurod6-expressing dopamine neurons, which project to the nucleus accumbens medial shell. DAT-P2A-Flpo mice add to a growing toolbox of genetic resources that will help parse the diverse functions mediated by dopaminergic circuits.
In brief
Kramer et al. generate a DAT-P2A-Flpo mouse line that enables intersectional genetic targeting of dopamine neuron subpopulations using Flp/Cre-dependent constructs. They show that ventral tegmental area dopamine neurons expressing Neurod6 give rise to the majority of dopaminergic projections to the nucleus accumbens medial shell and olfactory tubercle.
Graphical Abstract
INTRODUCTION
Despite their modest numbers, dopamine (DA) neurons project widely throughout the brain and influence a diverse set of behaviors and neural processes including movement, motivation, reward learning, and cognition (Wise and Rompre, 1989; Berke, 2018; Schultz, 2019; Gerfen and Surmeier, 2011; Gershman and Uchida, 2019). Historically, DA neurons have been categorized into 17 main cell groups, termed A1–A17 (Björklund and Dunnett, 2007; Dahlstroem and Fuxe, 1964). A9 and A10 are the most numerous and reside in the midbrain in the substantia nigra pars compacta (SNc) and ventral tegmental area (VTA), respectively. It has long been recognized that SNc and VTA DA neurons differ significantly in their projection targets, electrophysiological properties, behavioral influence, and vulnerability to degeneration (Morales and Margolis, 2017; Vogt Weisenhorn et al., 2016; Björklund and Dunnett, 2007; Henny et al., 2012; German et al., 1989; Lammel et al., 2008, 2014; Roeper, 2013; Brichta and Greengard, 2014). Recent single-cell profiling studies have further revealed that the SNc and VTA are, in fact, made up of smaller, partially overlapping subpopulations based on their gene expression patterns (Kramer et al., 2018; La Manno et al., 2016; Poulin et al., 2014; Hook et al., 2018; Saunders et al., 2018). How these dopaminergic subpopulations differ in terms of their anatomical location, inputs and outputs, neurotransmitter identity, and functional properties is just beginning to be defined.
To better understand the connections and behavioral functions of newly identified DA neuron subpopulations, additional tools are needed that allow genetic access to these subtypes. This is essential as even neighboring DA neurons can project to different places in the brain and exert opposing behavioral effects, i.e., signaling reward versus aversion (de Jong et al., 2019; Lammel et al., 2014). From gene-expression-profiling studies, it is clear that combinatorial approaches utilizing the intersectional expression of two or more genes will be needed as there are rarely single marker genes that are exclusively expressed by a given subtype (Poulin et al., 2020). In addition, even when the expression of a single gene can distinguish discrete DA subpopulations, these genes may also be expressed in non-dopaminergic neurons and are thus not useful for exclusive targeting of DA neuron subtypes (Kramer et al., 2018).
To tackle this challenge, intersectional mouse genetic approaches have been developed whereby the combinatorial expression of different recombinases can be used to define a neuron subpopulation (Ren et al., 2019; Fenno et al., 2014; Luo et al., 2018; Awatramani et al., 2003; Okaty et al., 2020). This approach was recently applied to the DA system through the generation of mice that express Flpo recombinase from the endogenous Th (tyrosine hydroxylase) (Poulin et al., 2018) or Slc6a3 (DA active transporter [DAT]) (Kok and Fu, 2021) loci. Using Th-2A-Flpo mice, Poulin et al. (2018) generated detailed maps of the projection targets of various genetically defined dopaminergic subpopulations. However, TH is the rate-limiting enzyme in the synthesis of all catecholamines, including DA, norepinephrine, and epinephrine. Thus, available transgenic mouse lines that use Th to drive expression of recombinases and reporter genes in DA neurons (e.g., Th-IRES-Cre, Th-2A-Flpo, and TH-EGFP; IRES [internal ribosome entry site]) also have expression in other catecholamine-expressing neurons (Lammel et al., 2015; Poulin et al., 2018; Sawamoto et al., 2001; Savitt et al., 2005; Lindeberg et al., 2004). As a result, the use of Th-driven reporters to investigate the behavioral functions of specific dopaminergic circuits may be confounded by contributions from these other cell types (Lammel et al., 2015).
DAT is responsible for the re-uptake of DA back into the presynaptic terminal following release and is expressed almost exclusively in dopaminergic neurons (Ciliax et al., 1995). As a result, DAT-reporter mouse lines have been shown to be more selective and label canonical DA neurons more specifically than Th-driven lines (Bäckman et al., 2006; Lammel et al., 2015; Roostalu et al., 2019). A DAT-ires-flp mouse line was recently developed and shown to effectively label TH+ neurons in traditional dopaminergic regions with a Flp-on fluorescent reporter, and a subset of VTA neurons with a Flp-on/Cre-on reporter in DAT-ires-flp::VGlut2-Cre mice (Kok and Fu, 2021). However, no further characterization was performed. Here, we provide an additional tool for studying dopaminergic subpopulations, by generating a mouse that expresses Flpo recombinase from the endogenous Slc6a3 locus using a P2A self-cleaving sequence. We show that DA neurons are robustly and selectively labeled in DAT-P2A-Flpo mice using Flp-dependent viral or transgenic reporters.
To demonstrate the utility of this model for intersectional labeling of a DA neuron subpopulation, we crossed DAT-P2A-Flpo mice with NEX-Cre mice (Goebbels et al., 2006) and verified selective targeting of Neurod6+ DA neurons in the ventromedial VTA. We further performed brain clearing and fast-scan cyclic voltammetry (FCV) to demonstrate the highly selective anatomical and functional output of this discrete DA neuron subpopulation. DAT-P2A-Flpo mice add to the growing arsenal of mouse genetic approaches that allow precise targeting of specific DA neuron subpopulations. Collectively, these mouse models provide a valuable means to dissect the contributions of dopaminergic sub-circuits to behavior.
RESULTS
Generation of DAT-P2A-Flpo mice
To allow for intersectional targeting of dopaminergic subpopulations, we developed a DAT-P2A-Flpo mouse line that expresses Flpo recombinase from the endogenous Slc6a3 locus. We used CRISPR-Cas9-based gene editing to knock in a P2A-Flpo-recombinase sequence 3′ to the final coding exon of DAT, replacing the stop codon in the 15th exon and the 3′ UTR (Figure 1A). The self-cleaving P2A sequence allows for bicistronic expression of both endogenous DAT protein and Flpo recombinase following translation of a single mRNA. For gene editing, we used mouse embryonic stem cells derived from the Ai65(RCFL-tdT)-D mouse line (herein referred to as Ai65) (Madisen et al., 2015). These cells harbor a Flp- and Cre-dependent tdTomato fluorescent reporter in the Rosa26 locus. F0 chimeric mice were PCR genotyped to confirm successful targeting (Figure 1B). F0 male mice had germline transmission and produced pups that expressed the Flpo recombinase insert (Figure 1B).
Figure 1. Generation of DAT-P2A-Flpo mice.

(A) Targeting scheme to generate dopamine active transporter (DAT)-P2A-Flpo knockin mice. Top: shown are the last two exons of the Slc6a3 (DAT) gene on chromosome 13 and the position of the single-guide RNA (sgRNA). Middle: a targeting donor was used to replace the stop codon (STOP) of Slc6a3 with a P2A sequence followed by the Flpo recombinase reading frame. Bottom: correct targeting leads to a modified locus expressing Flpo under the control of the endogenous Slc6a3 regulatory elements.
(B) PCR-genotyping strategy for DAT-P2A-Flpo mice. The 1,000 bp band denotes the wild-type (WT) allele. The 650 bp band indicates the presence of the P2A-Flpo insert. Expression in the F1 generation indicates successful germline transmission. Chim, chimeric founder (F0).
(C) Schematic of the unilateral injection of AAV-Fon/Coff-EYFP into the medial substantia nigra pars compacta (SNc) and ventral tegmental area (VTA).
(D) Representative image of a midbrain section stained with an antibody against tyrosine hydroxylase (TH; magenta) showing expression of Fon/Coff-EYFP in the midbrain (green). Inset shows a zoomed-in image of SNc neurons. This experiment was performed twice.
(E) Representative images of the midbrain from a DAT-P2A-Flpo;RCE-FRT mouse showing EGFP Flp reporter expression in TH+ SNc and VTA neurons. Representative of 7 mice. IPN, interpeduncular nucleus.
(F) Zoomed-in image of the VTA from the boxed region in (E).
(G) Quantification (mean ± SEM) of the percentage of EGFP+ cells in the VTA that were TH+ (pink bar) and the percentage of TH+ cells in the VTA that were EGFP+ (green bar). Circles represent values from individual mice (n = 6, 2 male and 4 female mice, post-natal day [P] 60–450).
(H) Zoomed-in image of the SNc from the boxed region in (E).
(I) Quantification (mean ± SEM) of the percentage of EGFP+ cells in the SNc that were TH+ (pink bar) and the percentage of TH+ cells in the SNc that were EGFP+ (green bar). Circles represent values from individual mice (n = 6).
(J–L) Left panels show anatomical schematics of the brain regions imaged (green boxes denote imaged areas). Right panels show representative images of the dorsal raphe (DR; J), caudal linear nucleus (CLi; K), and ventral premammillary nucleus of the hypothalamus (PMV; L) from a DAT-P2A-Flpo;RCE-FRT mouse showing EGFP+ cells (green). Representative of 7 mice.
(M) Quantification (mean ± SEM) of the percentage of EGFP+ cells in the DR, CLi, and PMV that were TH+ (pink bars) and the percentage of TH+ cells in the DR, CLi, and PMV that were EGFP+ (green bars). Circles represent values from individual mice (n = 6, 2 male and 4 female mice, P60–450). One mouse had a single TH+ neuron in the PMV (denoted by the arrowhead in L); the rest had no detectable TH+ cells.
(N and O) Left panels show anatomical schematics of the brain regions imaged (green boxes denote imaged areas). Right panels show representative images of the locus coeruleus (N) and zona incerta/A13 (O) from a DAT-P2A-Flpo;RCE-FRT mouse showing no EGFP+ reporter expression in TH+ cells in these regions. Representative of 2 mice.
See also Figure S1.
DAT-P2A-Flpo mice selectively label DA neurons
To determine whether Flpo recombinase was efficiently expressed in DA neurons, adult heterozygous (Het) DAT-P2A-Flpo mice were injected with an adeno-associated virus (AAV) expressing a Flp-dependent enhanced yellow fluorescent protein (EYFP) reporter in the midbrain (Figure 1C). We observed the expected labeling of SNc/VTA DA neurons in the injected area, and greater than 97% of EYFP+ neurons were TH+, indicating that they were DA neurons (Figure 1D). Following this initial confirmation, we crossed the DAT-P2A-Flpo mice to a mouse line expressing Flp-dependent EGFP (RCE-FRT; Figure S1A; Sousa et al., 2009). This cross resulted in robust Flp-dependent EGFP expression in DA neurons of the SNc and VTA (Figures 1E–1I; Figures S1B and S1C). We found that 91.8% ± 1.4% and 93.0% ± 2.1% of EGFP+ neurons in the VTA and SNc, respectively, were TH+, demonstrating selective Flpo expression in DA neurons (Figures 1F–1I). We found that 91.3% ± 0.9% and 90.4% ± 1.2% of TH+ neurons in the VTA and SNc, respectively, were EGFP+, indicating efficient recombination in these cells (Figures 1F–1I).
We examined EGFP expression in DAT-P2A-Flpo;RCE-FRT mice in other brain regions known to contain DA neurons (Figures 1J–1L; Figures S1D–S1G; Dougalis et al., 2012). Consistent with expression patterns in the widely used DAT-IRES-Cre mouse line (Bäckman et al., 2006; Cardozo Pinto et al., 2019), we observed Flp reporter expression in the dorsal raphe (DR) and caudal linear nucleus (CLi) (Figures 1J and 1K). The majority of EGFP+ cells co-expressed TH (69.6% ± 2.3% in the DR and 77.3% ± 3.8% in the CLi); however, as expected, the percentage of co-expressing cells was lower in these regions than in the SNc/VTA (Figures 1G, 1I, and 1M). It has been reported that the ventral premammillary nucleus of the hypothalamus (PMV) contains non-canonical DAT-expressing neurons that are negative for TH by immunohistochemistry and do not release detectable DA (Soden et al., 2016). Consistent with this, we found EGFP+ neurons in the PMV of DAT-P2A-Flpo;RCE-FRT mice that were largely TH negative (1 TH+ neuron out of 892 EGFP+ neurons across 6 mice; Figures 1L and 1M; Figure S1F).
Importantly, we did not observe Flp reporter expression in the interpeduncular nucleus (IPN; Figure 1E), which is ventral to the VTA and is labeled by reporters in Th-IRES-Cre and Th-2A-Flpo mice, but does not exhibit TH immunostaining (Lammel et al., 2015; Poulin et al., 2018). Furthermore, there was no EGFP expression in regions that contain non-dopaminergic TH+ neurons such as the locus coeruleus (LC; Figure 1N; Figure S1H), or in DA neurons that lack DAT in the zona incerta/A13 (Figure 1O; Figure S1I; Ng et al., 2009; Sharma et al., 2018). Together, these data demonstrate robust and selective Flp-dependent recombination in DAT-expressing neurons in DAT-P2A-Flpo mice.
The effects of Flpo recombinase insertion into the DAT 3′ UTR
It has been reported in DAT-IRES-Cre mice that knockin of Cre recombinase affects endogenous DAT expression. In adult heterozygous animals, there is reduced DAT protein expression (Bäckman et al., 2006), reduced DA re-uptake, and increased peak-evoked DA concentration as measured by FCV (O’Neill et al., 2017). To test whether endogenous DAT expression is altered in DAT-P2A-Flpo mice, we compared DAT protein expression, DA release and re-uptake, and gross motor behaviors between DAT-P2A-Flpo heterozygotes and their wild-type (WT) littermates.
Consistent with the previously observed reduction in DAT protein expression in DAT-IRES-Cre mice, which was replicated here (Figures S2A and S2B), we found a significant decrease in DAT protein in tissue punches from the dorsal striatum of heterozygous DAT-P2A-Flpo mice compared with WT littermate controls (Figures 2A and 2B). This change was selective for DAT as there were no significant differences in TH or vesicular monoamine transporter 2 (VMAT2) expression, which is the vesicular transporter responsible for loading DA into vesicles (Figures 2A and 2B). To measure DAT function, we used FCV to compare electrically evoked DA release and re-uptake from WT and heterozygous DAT-P2A-Flpo mice in ex vivo striatal slices. We measured single-pulse-evoked DA release and re-uptake at seven locations throughout the striatum and nucleus accumbens (NAc; Figure 2C). We found an average 32% increase in peak-evoked DA concentration across all dorsal striatum (dStr) sites (sites 1–5; Figure 2D) and a 30% increase in the NAc core (sites 6+7; Figure 2E) in DAT-P2A-Flpo heterozygous mice. To assess the rate of DA re-uptake, we selected DA transients from WT and heterozygous mice that were matched by region and peak concentration (Figure 2F). Analysis of the single exponential curve fit of the decay phase of the DA transient revealed a significant difference (p < 0.0001) between WT (tau = 0.41) and DAT-P2A-Flpo heterozygous mice (tau = 0.65), consistent with their reduced DAT protein expression (Figure 2G). An increase in peak-evoked DA concentration and a decrease in the rate of DA re-uptake were also observed in DAT-IRES-Cre mice (Figures S2C–S2G). Notably, the overall peak-evoked DA levels in WT mice from the two mouse lines were nearly 3-fold different, which likely reflects the differences in genetic background. The DAT-IRES-Cre mice were on a pure C57BL/6J background, while the DAT-P2A-Flpo mice were on a CD-1/C57BL/6J mixed background. Previous work has shown differences in the dopaminergic system depending on mouse background strain (Ingram and Corfman, 1980; Anderzhanova et al., 2013; Zaborszky and Vadasz, 2001). Therefore, these results show that DA release and re-uptake dynamics are highly sensitive to both DAT expression level and mouse genetic background.
Figure 2. DAT expression and function in DAT-P2A-Flpo mice.

(A) Representative western blot images of DAT, TH, vesicular monoamine transporter 2 (VMAT2), and histone H3 (H3) loading control from striatal lysates from DAT-P2A-Flpo WT and heterozygous (Het) mice. Two independent samples per genotype are shown. Blots were cropped to show the relevant bands. Molecular weight (MW) in kDa is indicated on the right. Representative of 4 mice.(B) Quantification of protein levels relative to H3, normalized to WT. Bars represent mean ± SEM. Each dot represents the average of two striatal samples from one mouse (n = 4 mice per genotype, 2 males and 2 females, P100–120). DAT, *p = 0.0259; TH, p = 0.9639; VMAT2, p = 0.0930; unpaired t tests.
(C) Extracellular DA ([DA]o) transients evoked by single electrical pulses and recorded with fast-scan cyclic voltammetry (FCV) in different striatal sub-regions. Traces are mean ± SEM [DA]o versus time (average of 32 transients per recording site from 4 pairs of DAT-P2A-Flpo WT and Het mice, 2 male pairs and 2 female pairs, P100–120). 1, ventromedial striatum; 2, dorsomedial striatum; 3, dorsolateral striatum; 4, central striatum; 5, ventrolateral striatum; 6+7, nucleus accumbens (NAc).
(D) Mean ± SEM [DA]o versus time (average of 80 transients per genotype) from the dorsal striatum (dStr) sites 1–5.
(E) Mean ± SEM [DA]o versus time (average of 32 transients per genotype) from the NAc sites 6+7.
(F) Mean ± SEM [DA]o of selected region- and peak-matched transients from the dStr of DAT-P2A-Flpo WT and Het mice (average of 22 transients per genotype).
(G) Single exponential curve fit of the decay phase of the transients in (F). DAT-P2A-Flpo Het mice have significantly slower [DA]o re-uptake than WT mice (***p < 0.0001; WT tau = 0.409, Het tau = 0.648).
(H–K) Behavioral performance of DAT-P2A-Flpo mice in a 60-min open-field test. For all graphs, bars represent mean ± SEM and dots represent values for individual mice. n = 15 WT mice, 6 males and 9 females; n = 14 Het mice, 5 males and 9 females, P50–90. (H) Total distance traveled in 60 min; p = 0.2680, unpaired t test. (I) Total number of rears in 60 min; p = 0.8847, unpaired t test. (J) Total time spent in the center of open field in 60 min; p = 0.9981, unpaired t test. (K) Total number of grooming bouts in the first 20 min; p = 0.8061, unpaired t test.
See also Figure S2.
To test whether changes in DAT expression resulted in any gross behavioral alterations, we tested DAT-P2A-Flpo mice of both sexes in the open field and measured locomotor activity, avoidance behavior, and repetitive behaviors (i.e., grooming). We found no significant differences in total distance traveled or number of rears between DAT-P2A-Flpo heterozygous mice and WT littermate controls (Figures 2H and 2I). We also found no changes in the time spent in center, a measure of avoidance behavior, or time spent grooming for DAT-P2A-Flpo mice (Figures 2J and 2K). We tested DAT-IRES-Cre mice for comparison (Figures S2H–S2K) and did find a small but significant increase in locomotor activity and a decrease in grooming time in heterozygous mice compared with WT littermate controls. These results are consistent with recent reports showing behavioral alterations in DAT-IRES-Cre mice, including hyperactivity (Chohan et al., 2020; Costa et al., 2021).
Together, these analyses show that even with use of a smaller self-cleaving P2A sequence instead of an IRES sequence, there can be changes in expression of the endogenous gene with a knockin strategy. While this needs to be taken into consideration when designing experiments, our behavioral data show that changes in DAT do not strongly affect basal locomotor activity in the DAT-P2A-Flpo line. Therefore, DAT-P2A-Flpo mice should be useful for a variety of experiments.
Intersectional labeling of Neurod6-expressing DA neurons
Previous studies have revealed that DA neurons are composed of genetically distinct subclasses (La Manno et al., 2016; Kramer et al., 2018; Hook et al., 2018; Poulin et al., 2014; Viereckel et al., 2016). One of these subpopulations, marked by the expression of the transcription factor Neurod6, is found in the ventromedial VTA and projects to the NAc medial shell (MSh) (Kramer et al., 2018; Viereckel et al., 2016; Khan et al., 2017; Bimpisidis et al., 2019). This subpopulation is of interest because it is selectively spared in a 6-hydroxydopamine (6-OHDA) model of Parkinson’s disease (Kramer et al., 2018). Moreover, recent studies have identified distinct behavioral roles for VTA DA neurons that project to the MSh versus the lateral shell (LSh) of the NAc (de Jong et al., 2019). In particular, LSh-projecting DA neurons show canonical dopaminergic responses to rewards and reward-predictive cues, whereas MSh-projecting DA neurons respond more to aversive stimuli and cues (de Jong et al., 2019). Since both the cell bodies and projection sites of these two functionally distinct subpopulations are in close spatial proximity, it has been a challenge to selectively target them for further study. The restricted projections of Neurod6-expressing DA neurons, as previously defined by retrograde labeling and fluorescence in situ hybridization (FISH) (Kramer et al., 2018; Bimpisidis et al., 2019), make Neurod6 a compelling marker gene to label MSh-projecting DA neurons. However, Neurod6 is also highly expressed in excitatory neurons of the cortex, in nuclei adjacent to the VTA, and in non-dopaminergic neurons within the VTA (Figures 3A–3C; Goebbels et al., 2006; Agarwal et al., 2012; Kramer et al., 2018). Therefore, intersectional tools are needed to selectively and reliably target Neurod6+ DA neurons.
Figure 3. Intersectional genetic targeting of Neurod6-expressing DA neurons.

(A–C) Confocal images from a P28 male NEX-Cre;Ai9 mouse showing tdTomato Cre-reporter expression (representative of 3 mice). (A) Whole brain coronal section showing tdTomato expression throughout the cortex and hippocampus. Boxed region denotes the VTA and ventral SNc (B) TdTomato expression in the midbrain including the SNc, VTA, and IPN. (C) TdTomato expression in the dorsal striatum (dStr) and NAc.
(D–F) Confocal images from a P50 male DAT-P2A-Flpo;RCE-FRT mouse showing EGFP Flp reporter expression (representative of 7 mice). (D) Whole brain coronal section showing restricted EGFP expression in the midbrain (boxed region). (E) EGFP expression in the midbrain. (F) EGFP expression in the dStr and NAc.
(G–I) Confocal images from a P50 female DAT-P2A-Flpo;NEX-Cre;Ai65 mouse showing tdTomato expression (representative of 5 mice). (G) Whole brain coronal section showing restricted tdTomato expression in the VTA (boxed region). (H) TdTomato expression in the midbrain. (I) TdTomato expression in the dStr and NAc.
(J) Confocal images of a VTA section from a P50 DAT-P2A-Flpo;NEX-Cre;Ai65 mouse. Top panel shows tdTomato fluorescence, bottom panel shows a merged image with TH immunostaining in green and tdTomato in magenta.
(K) Confocal images of the projection targets of Neurod6+ DA neurons in the striatum and NAc (representative of 5 mice). Left panel shows TH immunostaining. Middle panel shows tdTomato+ projections. Right panel shows merged image with TH in green and tdTomato+ projections in magenta. DMS, dorsomedial striatum; DLS, dorsolateral striatum; C, nucleus accumbens core; ac, anterior commissure; LSh, lateral shell (of NAc); MSh, medial shell (of NAc); OT, olfactory tubercle.
To access Neurod6+ DA neurons, we crossed DAT-P2A-Flpo;Ai65 mice (Figures 3D–3F) to NEX-Cre mice (Goebbels et al., 2006), which label the majority of Neurod6+ neurons (NEX is the original name for Neurod6). In the resulting triple transgenic offspring (Figure S3A), we found tdTomato labeling of a small population of neurons in the ventromedial VTA (Figures 3G, 3H, and 3J; Figure S3B). The anatomical location of these Neurod6+/DAT+ neurons matched closely to what was previously observed by FISH (Kramer et al., 2018). As predicted by retrograde tracing (Kramer et al., 2018), we found that Neurod6+/DAT+ neurons projected strongly to the NAc MSh, and olfactory tubercle (OT), with some additional sparse projections going to the lateral septum (Figures 3I and 3K; Figure S3C). We confirmed that Neurod6+/DAT+ neurons and the NAc projections from these mice expressed TH (Figures 3J and 3K).
To test whether dopaminergic projections to the NAc MSh arise predominantly from the Neurod6+ subpopulation, we injected an AAV expressing a Flp-on/Cre-off-EYFP construct (Fon/Coff-EYFP) (Fenno et al., 2014) into the SNc/VTA of DAT-P2A-Flpo;NEX-Cre mice (Figures 4A and 4B). In this experiment, only DA neurons that do not express NEX-Cre are labeled with EYFP (Figure 4C; Figure S3D). We observed the expected EYFP+ axonal arborizations throughout the striatum, with notably reduced projections in the NAc MSh and OT (Figure 4D; Figures S3E and S3F). We quantified the ratio of EYFP fluorescence to TH immunofluorescence within nine striatal sub-regions (marked by the boxes in Figure S3E) and found that the ratio was strongly reduced in the NAc MSh, with the largest reductions in the dorsal and medial sub-regions, which had very few EYFP+ projections (Figures 4D and 4E). The EYFP/TH ratio was also reduced in the OT, with the medial OT almost completely lacking EYFP+ fibers (Figures 4D and 4E). This analysis demonstrates that Neurod6+ DA neurons make up the large majority of dorsomedial NAc MSh- and medial OT-projecting DA neurons. Together, this analysis highlights the utility of intersectional strategies to label discrete subpopulations of DA neurons based on their combinatorial expression of Flp and Cre recombinase.
Figure 4. Neurod6+ neurons make up the majority of NAc MSh- and OT-projecting DA neurons.

(A and B) Strategy to label DA neurons that do not express Neurod6 using an AAV-expressing Flp-on/Cre-off EYFP injected in to the midbrain of DAT-P2A-Flpo;NEX-Cre mice (5 injections per mouse).
(C) Confocal images of the midbrain of a P111 male DAT-P2A-Flpo;NEX-Cre mouse injected with AAV-Fon/Coff-EYFP and immunostained for TH. Right panels show zoomed-in images of the boxed regions. Magenta arrows denote cells with TH expression (magenta), but not EYFP expression (green). Representative of 4 mice.
(D) Confocal images of the striatum and NAc from a P111 male DAT-P2A-Flpo;NEX-Cre mouse injected with AAV-Fon/Coff-EYFP and immunostained for TH. Bottom panels show zoomed-in merged images of the boxed regions. Arrows point to the NAc MSh and OT, which lack EYFP+ projections.
(E) Quantification of the ratio of bulk EYFP fluorescence to bulk TH immunofluorescence in the indicated striatal sub-regions. Bars represent mean ± SEM. Circles represent individual hemispheres (n = 6 hemispheres from 3 mice). DLS, dorsolateral striatum; DMS, dorsomedial striatum; core, NAc core; d-MSh, MSh-dorsal region (of NAc); m-MSh, MSh-medial region (of NAc); v-MSh, mSh-ventral region (of NAc); m-OT, medial OT; l-OT, lateral OT. Repeated-measures (RM) ANOVA revealed a significant difference, p < 0.0001. Holm-Sidak’s multiple comparisons tests with p < 0.05: d-MSh versus LSh, p = 0.0146; d-MSh versus core, p = 0.0144; d-MSh versus m-OT, p = 0.0089; m-MSh versus DMS, p = 0.0412; m-MSh versus LSh, p = 0.0142; m-MSh versus core, p = 0.0133; v-MSh versus core, p = 0.0063; m-OT versus DMS, p = 0.0159; m-OT versus LSh, p = 0.0040; m-OT versus core, p = 0.0058.
See also Figure S3.
Whole-brain imaging of Neurod6+ DA neurons
To measure the projection patterns of Neurod6+ DA neurons in an unbiased, brain-wide manner, we optically cleared whole brains from DAT-P2A-Flpo;NEX-Cre;Ai65 mice using the iDISCO-based (Renier et al., 2014) brain clearing method Adipo-Clear (Chi et al., 2018) and imaged the intact brain using a light sheet microscope (Figure 5; Video S1). We confirmed the remarkable specificity of the intersectional strategy, with tdTomato+ cell bodies primarily located in the VTA with clearly defined projections to the NAc MSh (Figures 5A–5E). We further analyzed the processes of Neurod6+ DA neurons using TrailMap (Friedmann et al., 2020), which detected both axonal projections and dendritic arbors. The NAc MSh projections were too dense to computationally recognize as individual fibers (Figure 5D) and were excluded from this analysis. The most numerous tdTomato+ processes outside of the NAc were found in the OT, with additional sparse processes detected in olfactory areas, hypothalamus, midbrain, and raphe nuclei (Figure S4A; Table S1; Videos S2 and S3).
Figure 5. Whole-brain imaging of DAT-P2A-Flpo;NEX-Cre;Ai65 mice.

(A) Whole brains from 2 male and 1 female P120 DAT-P2A-Flpo;NEX-Cre;Ai65 mice were optically cleared and imaged without sectioning using a light sheet microscope. Shown is a representative max projection of 600 μm from a horizontal plane z stack (representative of 3 mice). Right panels show zoomed-in images of Neurod6+ DA neurons in the midbrain (I), axonal tracts from the midbrain to the NAc MSh (II), Neurod6+ DA neuron axon terminals in the MSh (III), and fibers crossing the midline (IV). Ctx, cortex.
(B) Coronal view (XZ projection) comprising a 1.5 mm anterior/posterior (A/P) cross section of the VTA in optically cleared DAT-P2A-Flpo;NEX-Cre;Ai65 mice. Three separate brains were aligned and merged. Image is overlaid with brain region outlines from the middle position of the 1.5 mm cross section from the Allen Brain Atlas.
(C) Coronal z stack image of a 1.5 mm cross section of the VTA from a single brain color coded by depth. Depth scale is shown in bottom panel.
(D) Coronal z stack image of TrailMap-extracted axons from a 500 μm section of the striatum and NAc. Three separate brains were aligned and merged. Extracted axons are overlaid onto a reference slice from the middle position of the 500 μm section from the Allen Brain Atlas.
(E) Projections and processes of DAT-P2A-Flpo;NEX-Cre;Ai65-positive neurons visualized in a 3D view of TrailMap-extracted processes from three aligned brains.
In the whole-brain images from DAT-P2A-Flpo;NEX-Cre;Ai65 mice, we observed a small number of tdTomato+ neurons outside of the main dopaminergic nuclei including in the cortex, anterior olfactory nucleus, and cerebellum (Figure 5A; Figures S4B and S4C; Video S1). Labeled neurons in these regions have also been observed in Th-2A-Flpo mice crossed to a Flp reporter (Poulin et al., 2018). We further examined reporter-labeled cortical neurons in both DAT-P2A-Flpo;NEX-Cre;Ai65 and DAT-P2A-Flpo;RCE-FRT mice and found that some, but not all, had detectable TH expression in 2- to 3-month-old animals (22/131 neurons from 3 mice) (Figures S4D–S4G). Notably, in older mice (>1 year), TH was not detectable in reporter-labeled cortical neurons (0/103 neurons from 5 mice). We did not find reporter-labeled cortical neurons in DAT-P2A-Flpo-negative mice of either line (Figures S4H and S4I), arguing against leaky reporter expression. Together this suggests that there is a sparse population of cortical neurons that express Slc6a3 and Th, at least early in development. Notably, cells expressing DA biosynthesis genes including TH and DDC (dopa decarboxylase) have been observed in human and non-human primate cortex by single-cell RNA sequencing and immunostaining (Sousa et al., 2017).
Functional specificity of DA release from Neurod6+ DA neurons
The anatomical data described above indicate a robust and selective projection from Neurod6+ VTA DA neurons to the NAc MSh. To confirm the functionality of this projection, we bilaterally injected an AAV expressing Flp- and Cre-dependent channelrhodopsin (ChR2) (Fenno et al., 2014) into the VTA of DAT-P2A-Flpo;NEX-Cre mice (Figures 6A–6C; Figure S4J). To assess whether activation of Neurod6+ neurons leads to DA release, we measured DA levels with FCV in response to optical stimulation of ChR2+ terminals in different sub-regions of the striatum and NAc. We observed robust optically evoked DA release in the NAc MSh (Figure 6D). MSh DA release was reliable as we observed stable peak-evoked DA levels with repeated stimuli over the course of 20 min (Figure 6D). Optical stimulation outside the MSh did not result in measurable DA transients, consistent with the lack of axonal ChR2 expression in those regions (Figures 6C and 6D; Figure S4K). These results confirm the utility of DAT-P2A-Flpo mice for future functional assays using optogenetics and demonstrate the specificity of intersectional approaches to label discrete dopaminergic subpopulations.
Figure 6. Optogenetic activation of DA release in DAT-P2A-Flpo;NEX-Cre mice.

(A) Schematic of the intersectional genetic strategy to target Neurod6+ DA neurons in DAT-P2A-Flpo;NEX-Cre mice with an AAV-expressing Flp- and Cre-dependent channelrhodopsin (ChR2) fused to EYFP.
(B) Schematic showing bilateral injection of AAV-Fon/Con-ChR2-EYFP into the midbrain of DAT-P2A-Flpo;NEX-Cre mice.
(C) Representative confocal image showing midbrain expression of Fon/Con-ChR2-EYFP (green) together with TH immunostaining (magenta) in a DAT-P2A-Flpo;NEX-Cre mouse. Inset shows ChR2-EYFP+ projections in the NAc MSh in an injected mouse. Scale bar in the inset image represents 200 μm. Representative of 3 mice.
(D) FCV traces of optically-evoked [DA]o in striatal slices from DAT-P2A-Flpo;NEX-Cre mice injected with AAV-Fon/Con-ChR2-EYFP. DA release was evoked from different striatal sub-regions by 10 light pulses delivered at 25 Hz. Light colored lines show individual traces (n = 3–9 transients per recording site) and dark colored lines are the mean ± SEM from each region, recorded from 4 hemispheres of two P120 male mice. Bottom panel shows DA transients recorded in the MSh from 8 consecutive stimulations delivered 2.5 min apart.
See also Figure S4.
DISCUSSION
Here, we describe a transgenic mouse line expressing Flpo recombinase from the endogenous Slc6a3 locus, which provides an additional tool for the visualization and manipulation of DA neurons. We provide anatomical validation of this mouse line by demonstrating robust and specific Flp-mediated recombination of genetic and viral reporters in TH+ DA neurons in multiple brain regions. We demonstrate proof of concept that DAT-P2A-Flpo mice can be crossed to mice expressing Cre from a cell-type-specific promoter to allow for the intersectional targeting of dopaminergic subpopulations defined by their co-expression of DAT and another gene of interest. Finally, we show functional validation that Flp- and Cre-dependent ChR2 can be used to evoke DA release in specific dopaminergic target regions.
Single-cell RNA-sequencing studies of neuronal populations throughout the brain have provided unprecedented access to the gene expression profiles of different cell types. These studies have highlighted the need for additional genetic tools to enable the study of neuron subpopulations in a specific and reproducible way (Poulin et al., 2016). This is especially important for brain regions in which spatially adjacent or intermingled neurons can have different functional roles, thus constituting distinct subtypes, such as in the striatum or midbrain dopaminergic system (Bateup et al., 2010; Lerner et al., 2015; Kravitz et al., 2010; Collins and Saunders, 2020; de Jong et al., 2019; Heiman et al., 2008; Stuber et al., 2010). In recent years, there have been major efforts to generate mouse lines that express Cre recombinase from different cell-type-specific promoters (Huang and Zeng, 2013; Gong et al., 2007; Gerfen et al., 2013). These mouse lines have become essential tools for neuroscience and other areas of biology. However, there is often substantial expression of “marker” genes in more than one cell type. Therefore, single genes often aren’t sufficient to label specific neuron subtypes within functionally diverse neuronal populations.
Genetic intersectional strategies, based on the expression of different recombinases under the control of two or more gene promoters, represent emerging approaches that greatly increase our ability to target newly defined neuron subpopulations (Luo et al., 2018; Fenno et al., 2014; Awatramani et al., 2003). This strategy has been successfully applied to neuromodulatory populations, including serotonergic and dopaminergic neurons (Ren et al., 2019; Poulin et al., 2018; Okaty et al., 2020; Kok and Fu, 2021). The DAT-P2A-Flpo mouse line described here contributes to this growing toolkit of intersectional mouse genetic resources. For labeling DA neurons specifically, DAT-P2A-Flpo mice have some advantages over Th-2A-Flpo mice (Poulin et al., 2018). Namely, DAT drives Flpo expression selectively in DA neurons, whereas Th-2A-Flpo is expressed in catecholaminergic neurons throughout the brain. This an important consideration when attempting to target midbrain DA neurons with viral or genetic approaches as TH is expressed in non-dopaminergic neurons in the IPN and the linear raphe, which reside just adjacent to the VTA (Ng et al., 2009; Lammel et al., 2015). In addition, TH+ neurons are found in the locus coeruleus, DR, hypothalamus, and zona incerta, among other regions (Ng et al., 2009). Therefore, Th-2A-Flpo mice label a larger population of neurons. Together, DAT-P2A-Flpo and Th-2A-Flpo mice represent complementary tools that will have different utility depending on which neuronal population is to be targeted.
Here, we find that similar to the commonly used DAT-IRES-Cre mouse line (Bäckman et al., 2006), bicistronic expression of Flp from the endogenous Slc6a3 locus alters DAT protein expression. We found a reduction in DAT levels in the dStr in mice that were heterozygous for DAT-P2A-Flpo, which resulted in detectable changes in peak evoked DA release and re-uptake kinetics in the striatum. While the mechanism for this is unknown, it may result from loss of the 3′ UTR or the instability of the long mRNA transcript that is produced from the targeted locus, which contains the coding sequence for both DAT and Flpo. This change in DAT expression will need to be considered when designing experiments with DAT-P2A-Flpo mice, especially if measures related to DAT function are being explored. Here, we did not find any changes in gross locomotor activity in DAT-P2A-Flpo heterozygous mice; however, testing in other behavioral contexts is warranted prior to using this line for different experiments. Notably, several recent studies have reported sex-dependent changes in motor and psychostimulant-induced behaviors in DAT-IRES-Cre mice (Costa et al., 2021; Chohan et al., 2020). We recommend designing experiments so that all mice are heterozygous for DAT-P2A-Flpo and thus have similar DAT expression, and avoid comparing DAT-P2A-Flpo heterozygotes directly with WT mice.
In addition to characterizing the DAT-P2A-Flpo mice, we highlight an example of how an intersectional genetic approach can be used to visualize and manipulate a specific subpopulation of DA neurons. This population is marked by the expression of the transcription factor Neurod6, which is expressed in approximately 25% of DA neurons in the ventromedial VTA (Kramer et al., 2018). This population is of considerable interest given studies showing that Neurod6 marks VTA DA neurons that are spared in a 6-OHDA model of Parkinson’s disease (Kramer et al., 2018) and could be neuroprotective by maintaining mitochondrial health (Uittenbogaard et al., 2010; Baxter et al., 2012). In addition, Neurod6 and its related family member Neurod1 have been shown to be important for the developmental survival of this VTA subpopulation (Khan et al., 2017).
At the circuit and behavioral levels, drug self-administration activates MSh-projecting VTA DA neurons (Corre et al., 2018), and high-power optogenetic activation of NEX-Cre-expressing neurons in the midbrain (which may include non-DA populations; see Figure 3B) leads to real-time place preference, signifying a rewarding outcome (Bimpisidis et al., 2019). However, it was recently shown that unlike LSh-projecting DA neurons, which respond robustly to rewards and reward-predictive stimuli, MSh-projecting DA neurons in the VTA are strongly activated by aversive cues and respond less to reward-related stimuli (de Jong et al., 2019). Therefore, the functional role(s) of MSh-projecting DA neurons and the specific contribution of Neurod6-expressing VTA DA neurons to motivated behaviors, i.e., reward and aversion, require further investigation. The DAT-P2A-Flpo;NEX-Cre mice described here will enable consistent and tractable marking of this behaviorally and disease-relevant subpopulation of DA neurons for future studies.
STAR★METHODS
RESOURCE AVAILABILITY
Lead contact
Further information and requests for resources and reagents should be directed to and will be fulfilled by the Lead Contact, Helen Bateup (bateup@berkeley.edu).
Materials availability
The DAT-P2A-Flpo mouse line generated in this study has been deposited with Jackson Laboratories (Stock name: Slc6a3em1(flpo)Hbat/J; Stock number: 035436).
Data and code availability
The source data supporting the current study have not been deposited in a public repository but are available from the corresponding author on request. This study did not generate unique code.
EXPERIMENTAL MODEL AND SUBJECT DETAILS
The DAT-P2A-Flpo mice were generated at UC Berkeley and have been deposited with Jackson Laboratories (Jackson Laboratory, strain #035436). DAT-IRES-Cre mice (Jackson Laboratory, strain #006660 [Bäckman et al., 2006]) were crossed and maintained with C57BL/6J wild-type mice (Jackson Laboratory, strain #000664). RCE-FRT mice (Gt(ROSA)26Sortm1.2(CAG-EGFP)Fsh/Mmjax, MMRRC stock #32038-JAX) (Sousa et al., 2009) were used to label Flp-expressing neurons with EGFP. To label neurons co-expressing Flp and Cre recombinase, the Ai65 mouse line (Ai65(RCFL-tdT)-D, Jackson Laboratory stock #021875) (Madisen et al., 2015) was used. To target Neurod6-expressing neurons, the NEX-Cre mouse line (NEX was the previous name of Neurod6) was obtained from Dr. Klaus-Armin Nave (Goebbels et al., 2006).
Mice were group housed on a 12 h light/dark cycle and given ad libitum access to standard rodent chow and water. Both male and female animals were used for experimentation. The ages, sexes, and numbers of mice used for each experiment are indicated in the respective figure legends.
All animal procedures were conducted in accordance with protocols approved by the University of California, Berkeley Institutional Animal Care and Use Committee (IACUC) and Office of Laboratory Animal Care (OLAC).
METHOD DETAILS
Generation of DAT-P2A-Flpo mice
DAT-P2A-Flpo mice were generated using Ai65 mouse embryonic stem cells (mESCs) from the Allen Institute for Brain Science (a gift from Tanya Daigle, Ph.D.). Ai65 mESCs harbor a Flp- and Cre-dependent tdTomato fluorescent reporter in the ROSAβgeo26 locus (Madisen et al., 2015). Ai65 mESCs were karyotyped (Cell Line Genetics, Inc. Madison, WI) to ensure chromosomal health both before and after gene editing. Clonal cell lines that showed normal chromosome numbers and no deletions/insertions in at least 19 of 20 cells analyzed were considered to be chromosomally normal.
To generate the in-frame genomic insertion of a P2A-Flpo sequence, we used CRISPR/Cas9 to generate a double-stranded break immediately upstream of the stop codon in the last exon (exon 15) of the Slc6a3 gene. To do this, we designed two plasmids: a donor plasmid and a Cas9 plasmid. For the donor construct, we generated a 2499 bp gBlock gene fragment (Integrated DNA technologies, IDT, sequence below) that contained a 15 bp overhang for integration into a plasmid, a 552 bp homology arm on the 5′ end, a P2A sequence starting with a GSG (Kim et al., 2011), a nuclear localization sequence, the optimized Flp-recombinase (Flpo) sequence (Raymond and Soriano, 2007; Madisen et al., 2015), a 552 bp homology arm on the 3′ end, and a 15 bp overhang for integration into a plasmid. This sequence was inserted into a donor plasmid (pCRII-TOPO) using In-Fusion HD cloning (Takara – 639649). For the Cas9 plasmid, a single-guide RNA (sgRNA) targeting the 5′ NGG protospacer adjacent motif (PAM) immediately downstream of exon 15 (sgRNA forward: 5′ CACCGCATTGGCTGTTGGTGTAAG 3′, sgRNA reverse: 5′ AAACCTTTACACCAACAGCCAATGC 3′, italic portions represent sequences present for pX330 plasmid insertion) was inserted into the Cas9-encoding pX330 plasmid (Cong et al., 2013).
The pX330 plasmid along with the donor construct were nucleofected into 5×10⁶ Ai65 mESCs. Transfected cells were cultured and the resulting colonies were screened for correct insertion and integration. We designed a genotyping strategy with a forward primer immediately upstream of the first homology arm in exon 15 of Slc6a3 (DAT-Flp geno forward: 5′ CATGCAGAAGGACAGACACT 3′), a reverse primer in the Flpo sequence 650 bp away from the forward primer (Flpo insert reverse: 5′ AGGATGTCGAACTGGCTCAT 3′), and a reverse primer in the 3′ UTR of the Slc6a3 gene, 1,100 bp away from the forward primer when there is no insert (DAT-Flp geno reverse: 5′ ACCCTGCGTGTGTGTAATAT 3′). Flpo insertion was confirmed by the presence of a 650 bp PCR product (Figure 1B). With this strategy, the forward primer falls outside of the homology arm, therefore we could confirm on-target insertion.
Following confirmation of correctly targeted Ai65 mESC clones with normal karyotypes, mESCs were given to the Berkeley Cancer Research Laboratory Gene Targeting Facility for the generation of chimeras using aggregation of mESCs and morula embryos according to published protocols (Gertsenstein et al., 2010). Pups born from the implanted females were checked for chimerism by coat color and tail DNA genotyping. F1 pups and subsequent generations were genotyped using tail DNA.
DAT-P2A-Flpo gBlock gene fragment:
TACCGAGCTCGGATCGGACCACTCACAAATCAGTAGGAGGACAATATGGGGCCAGTCCTGCATCTAAAGATGTTCTGCATATCTCACCTCAGCTACTGATCACAAATATGCTGGGCAGAAAGAACCCTGGCCTTCTAAGCACCTGGGCTCCATGAGGCTTGGTTATTTGTTGGTTCTGGTTTGTTTTCCTTTACTCTGCCTTTTTTTTTGTTTGTTTGTTTGTTTGTTTTGAGACAATCTTACTGTAGCACAGGCTGGCCTCAAACCCATACCTGCTAGCCTCTTGAGATCATGACTACAGACATTAGCTGCTCTACCAAGTTTACAGGTCCCTTCTTCATCAAGTAATTCAAGTACTTAAAAGTTTCCATGAGGTCATTAGCCGTTGGTGCCCTCAAGGGTGGTATCTATCATCGGTAACCTCCCCCATGGGCAAGTAGTACCACCTGCTGAATTGATCCTGATTTCATCAGCGAGTCAGTGGCCCATAAGCCGTGATTCTAAAGTCTGCTTCTCACTCGTAAATAAATGATGCTTTCTTTCCAGCTGCGCCATTGGCTGTTGGTGGGAAGCGGAGCTACTAACTTCAGCCTGCTGAAGCAGGCTGGAGACGTGGAGGAGAACCCTGGACCTATGGCTCCTAAGAAGAAGAGGAAGGTGATGAGCCAGTTCGACATCCTGTGCAAGACCCCGCCGAAGGTGCTGGTGCGGCAGTTCGTGGAGAGATTCGAGAGGCCCAGCGGCGAAAAGATCGCCAGCTGTGCCGCCGAGCTGACCTACCTGTGCTGGATGATCACCCACAACGGCACCGCGATCAAGAGGGCCACCTTCATGAGTTATAACACCATCATCAGCAACAGCCTGAGTTTTGACATCGTGAACAAGAGCCTGCAGTTCAAGTACAAGACCCAGAAGGCCACCATCCTGGAGGCCAGCCTGAAGAAGCTGATCCCCGCATGGGAGTTCACGATTATCCCTTACAACGGCCAGAAGCACCAGAGCGACATCACCGACATCGTGTCCAGCCTGCAGCTGCAGTTCGAAAGCAGCGAGGAGGCCGACAAGGGGAATAGCCACAGCAAGAAGATGCTGAAGGCCCTGCTGTCCGAAGGCGAGAGCATCTGGGAGATTACCGAGAAGATCCTGAACAGCTTCGAGTACACCAGCAGATTTACCAAAACGAAGACCCTGTACCAGTTCCTGTTCCTGGCCACATTCATCAACTGCGGCAGGTTCAGCGACATCAAGAACGTGGACCCGAAGAGCTTCAAGCTCGTCCAGAACAAGTATCTGGGCGTGATCATTCAGTGCCTGGTCACGGAGACCAAGACAAGCGTGTCCAGGCACATCTACTTTTTCAGCGCCAGAGGCAGGATCGACCCCCTGGTGTACCTGGACGAGTTCCTGAGGAACAGCGAGCCCGTGCTGAAGAGAGTGAACAGGACCGGCAACAGCAGCAGCAACAAGCAGGAGTACCAGCTGCTGAAGGACAACCTGGTGCGCAGCTACAACAAGGCCCTGAAGAAGAACGCCCCCTACCCCATCTTCGCTATTAAAAACGGCCCTAAGAGCCACATCGGCAGGCACCTGATGACCAGCTTTCTGAGCATGAAGGGCCTGACCGAGCTGACAAACGTGGTGGGCAACTGGAGCGACAAGAGGGCCTCCGCCGTGGCCAGGACCACCTACACCCACCAGATCACCGCCATCCCCGACCACTACTTCGCCCTGGTGTCCAGGTACTACGCCTACGACCCCATCAGTAAGGAGATGATCGCCCTGAAGGACGAGACCAACCCCATCGAGGAGTGGCAGCACATCGAGCAGCTGAAGGGCAGCGCCGAGGGCAGCATCAGATACCCCGCCTGGAACGGCATTATAAGCCAGGAGGTGCTGGACTACCTGAGCAGCTACATCAACAGGCGGATCTGAAGTGGAAGGAGACAGCTGCCAGCTGGGCCATCTCACAACAGCGGGGACAGGGAGATCACAAAGGAAACCAACACGTCAAGAAAGGAGGGCCACTTCCACAGTCCCCTTTTGCCATATGGAAAAATAATCCAAGCATGGGCTTCAATCTTTGACTGTTCACACCCAATCCATGCCACAAAGAAGCCTCTGTCTGTGTGTGACTGTAAAAACACACACCTCTATACAGTGAAGTCAACCATGTCCCTGTCCCTAATGGGTGGGGAAACCCCTAGCTGGTATCCTGTCCTGCAAGGCTGACTCCCCCATCTGTGGTCACTCTGGGAGAACAGGTCATACTGTTCCCTGCATTCTAGGAGAGGGACTTTGGTACCTGTATATACACTGTGCCAGAATCCTGTGCTCACGGTAGTTGCCTAGATAATTTCTTTTGCTTAAATTTACAGTGTCAAGTATCCTATTTTTTGCTGTTGGTAGAAAAGACAGTTAATACATGCCAAGTCCTTTCCTGGTGCTTGGCTCCGAGCAGACACCATGACCTTAGCATCCTGTTCATCGAGCATGCATCTA
Stereotaxic intracranial injections
Intracranial injections were performed on male and female postnatal day (P) 40–150 mice. Mice were briefly anesthetized with 3% isoflurane (Piramal Healthcare – PIR001710) and oxygen. Mice were mounted on a stereotaxic frame (Kopf instruments – Model 940) with stabilizing ear cups and a nose cone delivering constant 1.5% isoflurane in medical oxygen. Viruses were injected using a pulled glass capillary at a rate of 100 nl/minute. Following injection, the capillary remained in place for 1 minute per every minute spent injecting to allow the tissue to recover and prevent virus backflow up the injection tract upon retraction. The following coordinates from Bregma were used to target each site: SNc (M/L ± 1.5 mm, A/P −2.8 mm, D/V −4.0 mm), VTA (M/L ± 0.6 mm, A/P −3.1 to −3.7 mm for multiple injections, D/V −4.2 mm).
For ChR2 experiments, 400 nL of AAV8 Flp- and Cre-dependent ChR2 (AAV8-hSyn-Con/Fon-hChR2(H134R)-EYFP: Addgene – 55645-AAV8: titer 2.1 × 10¹³) diluted 1:7 in sterile saline was injected bilaterally into the anterior and posterior VTA of DAT-P2A-Flpo;Nex-Cre mice. For EYFP labeling experiments, 400 nL of undiluted AAV5 Flp-dependent EYFP (AAV5-hSyn-Coff/Fon-eYFP-WPRE: UNC vector core: titer 3.5 × 10¹²) was injected bilaterally into the SNc and VTA of DAT-P2A-Flpo heterozygous mice. For Intersectional labeling of Neurod6-negative DA neurons, 5 400 nL injections of AAVDJ Fon/Coff-EYFP (AAV-DJ hSyn Coff/Fon eYFP-WPRE: Stanford Gene Vector and Virus Core: titer 1.33 × 10¹³) diluted 1:4 in sterile saline were made into the SNc and the VTA of DAT-P2A-Flpo;Nex-Cre mice (M/L ± 1.2 mm, A/P −3.0 mm, D/V −4.0 mm; M/L ± 0.6 mm, A/P −3.5 to −3.7 mm, D/V −4.2 mm; M/L 0.0 mm, A/P −3.3 mm, D/V −3.7 mm). Mice were perfused 10 days post-injection.
Brain sectioning and immunohistochemistry
Adult mice were anesthetized with isoflurane and transcardial perfusion was performed with 7.5 mL of 1x PBS following by 7.5 mL of ice cold 4% PFA in 1x PBS (EMS – 15710-S). Brains were removed and post-fixed in 4% PFA in 1x PBS for 2–6 hours at 4°C. Brains were transferred to cryoprotectant solution (30% sucrose in 0.1M PB) at 4°C until they sank. 30 μm coronal sections were made using a freezing microtome (American Optical, AO 860). Sections were collected in serial wells of a 24 well plate in 1x PBS with 0.02% sodium azide (NaN3; Sigma-Aldrich – 26628–22-8) and stored at 4°C.
For immunohistochemistry, individual wells of sections were washed with gentle shaking for 3 × 5 minutes with 1x PBS, then blocked for 1 hour at RT with BlockAid blocking solution (Life Tech - B10710). Primary antibodies diluted in PBS-Tx (1x PBS with 0.25% Triton X-100 (Sigma – T8787)) were added and the tissue was incubated for 48 h with gentle shaking at 4°C. Sections were then washed with gentle shaking 3 × 10 minutes with PBS-Tx. Secondary antibodies diluted in PBS-Tx were added and incubated with shaking for 1 h at room temperature. Sections were then washed in 1x PB for 3 × 10 minutes with gentle shaking. Sections were mounted onto SuperFrost slides (VWR: 48311–703) and coverslipped with hard-set Vectashield mounting media (Vector Labs: H-1500). The following antibodies were used: anti-tyrosine hydroxylase (TH, 1:1000, mouse, Immunostar #22941), anti-RFP (1:1000, rabbit, Rockland #600–401-379), Alexa Fluor 488 goat anti-mouse secondary (1:500, Thermo Fisher Scientific #A-11001), Alexa Fluor 633 goat anti-mouse secondary (1:500, Thermo Fisher Scientific #A-21050), and Alexa Fluor 546 goat anti-rabbit secondary (1:500, Thermo Fisher Scientific #A-11035).
Confocal microscopy and image analysis
Images of 30 μm sections processed for immunohistochemistry were acquired using an Olympus FV3000 confocal microscope equipped with 405, 488, 561, and 633 nm lasers and a motorized stage for tile imaging. Z stack images captured the entire thickness of the section at 2–2.5 μm steps for images taken with 20x (Olympus #UCPLFLN20X) or 10x air objectives (UPLXAPO10X), and 10 μm steps for images taken with a 4x air objective (Olympus #UPLXAPO4X).
Quantification of EGFP overlap with TH immunolabeling in DAT-P2A-Flpo:RCE-FRT mice was done on max projected Z stack images from 2 hemispheres per mouse and averaged together. Every clearly identifiable EGFP+ neuron in each analyzed brain region was manually counted using the Cell Counter ImageJ (NIH) plug-in. A neuron was considered TH+ if there was a clear TH signal in the entirety of the EGFP+ cell body. Boundaries of each sub-region were defined according to the Paxinos mouse brain atlas (Paxinos and Franklin, 2004).
Western Blotting
Bilateral punches (3 mm diameter) were taken from 275 μm thick striatal sections prepared from male and female (P50–90) DAT-P2A-Flpo and DAT-IRES-Cre mice. Sections were cut on a vibratome in cold ACSF-Sucrose cutting solution (In mM: 85 NaCl, 25 NaHCO3, 2.5 KCl, 1.25 NaH2PO4, 0.5 CaCl2, 7 MgCl2, 10 glucose, and 65 sucrose). Punches contained dorsal striatum and small neighboring portions of the lateral septum and nucleus accumbens. Tissue punches were put into a 1.5 mL tube and frozen on dry ice. Samples were resuspended in 300 μL lysis buffer (1x PBS, 1% SDS, 1% Triton X-100, 2 mM EDTA, and 2 mM EGTA) with Halt phosphatase buffer inhibitor (Fisher: PI78420) and Complete mini EDTA-free protease inhibitor (Roche: 4693159001). Samples were sonicated at low power (Qsonica Q55) until homogenized. Homogenized samples were then boiled for 5 minutes, spun down, and put on ice. Total protein concentration was determined using a BCA assay (Fisher: PI23227).
4x Laemmli sample buffer (Bio-Rad: 161–0747) with 5% 2-mercaptoethanol (Thermo Fisher Scientific) was added 3:1 to an aliquot of each sample. 15 μg of total protein were loaded onto a 4%–15% Criterion TGX gel (Bio-Rad: 5671084). Proteins were transferred to an activated PVDF membrane (BioRad: 1620177) at 4°C overnight using the Bio-Rad Criterion Blotter. Membranes were then removed, cut, washed, and blocked in 5% milk in 1x TBS + 1% Tween-20 (TBS-T) for 1 h at RT. Blots were incubated with primary antibodies diluted in TBS-T + 5% milk overnight at 4°C. The next day, the blots were washed 3 × 10 minutes with TBS-T followed by 1 hour of incubation at RT with HRP-conjugated secondary antibodies (1:5000). Membranes were washed 6 × 10 minutes with TBS-T and incubated for one minute with a chemiluminesence substrate (Perkin-Elmer: NEL105001EA) and exposed to GE Amersham Hyperfilm ECL (VWR: 95017–661). Membranes were then stripped 2 × 6 minutes with 6 mM Guanidinium Chloride + 5% 2-mercaptoethanol, washed with TBS-T, and incubated with primary antibody overnight at 4°C.
The following primary antibodies were used for western blotting: mouse anti-tyrosine hydroxylase (TH, 1:3000, Immunostar - 22941); mouse anti-Histone-3 (1:1500, Cell Signaling - 96C10); rabbit anti-VMAT2 (1:1400, Alomone Labs - AMT-006), mouse anti-Dopamine Transporter [6V-23–23] (DAT, 1:1,400, Abcam – 128848). The following secondary antibodies were used: goat anti-rabbit HRP (1:5000, Bio-Rad: 170–5046) and goat anti-mouse HRP (1:5000, Bio-Rad: 170–5047).
Fast-Scan Cyclic Voltammetry
DA release was monitored using fast-scan cyclic voltammetry (FCV) in acute coronal slices. Paired site-sampling recordings were performed in one WT and one heterozygous animal from a sex- and age-matched mouse pair recorded on the same day. The genotype order of the tissue prep and recording chamber position were counterbalanced between experiments. Male and female mice (P50–90) were deeply anesthetized by isoflurane and decapitated. 275 μm thick coronal striatal slices were cut on a vibratome (Leica VT1000 S) in ice cold ACSF-Sucrose cutting solution (in mM: 85 NaCl, 25 NaHCO3, 2.5 KCl, 1.25 NaH2PO4, 0.5 CaCl2, 7 MgCl2, 10 glucose, and 65 sucrose). Slices recovered for 1 h at RT in ACSF recording solution (in mM: 130 NaCl, 25 NaHCO3, 2.5 KCl, 1.25 NaH2PO4, 2 CaCl2, 2 MgCl2, and 10 glucose). All solutions were continuously saturated with 95% O2 and 5% CO2. Slices between +1.2 mm and +0.5 mm (A/P) from Bregma that had both dorsal striatum and the entire nucleus accumbens were used for experimentation.
Prior to recording electrically- or light-evoked transients, ex vivo slices were equilibrated to the bath temperature of 32°C for 30 min with an ACSF flow rate of 1.2–1.4 ml/min. Extracellular DA concentration ([DA]o) was monitored with FCV at carbon-fiber microelectrodes (CFMs) using a Millar voltammeter (Julian Millar, Barts and the London School of Medicine and Dentistry). CFMs were fabricated in-house from epoxy-free carbon fiber ~7 μm in diameter (Goodfellow Cambridge Ltd) encased in a glass capillary (Harvard Apparatus: GC200F-10) pulled to form a seal with the fiber and cut to a final tip length of 100–130 μm. The CFM was positioned 100–120 μm below the tissue surface at a 45° angle. A triangular waveform was applied to the carbon fiber scanning from −0.7 V to +1.3 V and back, against a Ag/AgCl reference electrode at a rate of 800 V/s. Evoked DA transients were sampled at 8 Hz, and data were acquired at 50 kHz using AxoScope 10.5 /10.7 (Molecular Devices). Evoked oxidation currents were converted to [DA]o from post-experimental calibrations of the CFMs. Recorded FCV signals were identified as DA by comparing oxidation (+0.6 V) and reduction (−0.2 V) potential peaks from experimental voltammograms with currents recorded during calibration with 2 μM DA dissolved in ACSF.
DA release was evoked every 2.5 minutes with electrical or optical stimulation delivered out of phase with voltammetric scans. For electrical stimulation, a concentric bipolar stimulating electrode (FHC: CBAEC75) was positioned on the slice surface within 100 μm of the CFM. DA release was evoked using square wave pulses (0.6 mA amplitude, 2 ms duration) controlled by an Isoflex stimulus isolator (A.M.P.I., Jerusalem, Israel). For site sampling experiments with electrical stimulation, three stimulations were delivered at a given site before progressing to a corresponding site in the other slice. For optical stimulation of ChR2-expressing DA terminals, release was evoked using 5 ms pulses of 473 nm light delivered through a 10x water-immersion objective coupled to a CoolLED system (CoolLED pE-300; 26.6mW light power output) controlled by a Master-8 pulse stimulator (A.M.P.I., Jerusalem, Israel). Optically evoked DA events were evoked with 10 light pulses delivered at 25 Hz.
Open Field Behavior
Behavioral testing was carried out during the dark phase of the light cycle under white lights. Male and female mice (P50–90) were habituated to the behavior room under a blackout curtain for 1 h prior to testing. General locomotor activity and avoidance behavior was assessed using a 60 minute session in an open field chamber (40 cm length x 40 cm width x 34 cm height) made of transparent plexiglass (ANY-maze, Stoelting). Horizontal photobeams were used to measure rearing. The chamber was cleaned between each mouse with 70% ethanol followed by water and let dry for 5 minutes. The apparatus was cleaned with water and mild soap detergent at the end of each testing day. The experimenter was blind to genotype throughout the testing and scoring procedures.
For open field testing, the mouse was placed in the front, right hand corner of the chamber, facing away from the center and activity was recorded using both an overhead camera and side-facing camera. A center field of 20 cm length x 20 cm width was defined digitally to measure the time spent in the center of the open field. The observer manually scored grooming bouts and time spent grooming during the first 20 min of the test. A grooming bout was considered any licking, nibbling, or scratching that lasted more than one second. If there was a break of more than 2 s between actions, this was considered a separate grooming bout. The following parameters were measured using ANY-maze tracking software: total distance traveled, time spent in center, and number of rears.
Adipo-Clear brain clearing
Brains from male and female (P40–60) DAT-P2A-Flpo;Nex-Cre;Ai65 mice were cleared using Adipo-Clear (Chi et al., 2018). Mice were perfused with 20 mL of 1x PBS, followed by ice-cold 4% PFA (16% PFA diluted in 1x PBS, EMS – 15710-S), followed by 10 mL of 1x PBS. Brains were post-fixed in 4% PFA in 1x PBS with shaking overnight at 4°C. Brains were washed for 3 × 1 h in 1x PBS with 0.02% NaN3 (Sigma Aldrich – 58032) at RT. The brains were then delipidated with the following steps. The samples were initially dehydrated with a MeOH gradient (20%, 40%, 60%, and 80%, 1 h each, Fisher – A412SK-4) with B1n buffer (in H2O – Glycine: 0.3 M, Triton X-100: 0.1% (v/v), NaN3: 0.01% (w/v) with pH adjusted to 7.0), shaking gently at RT. Samples were then washed 2 × 1 h in 100% MeOH followed by overnight incubation at RT in DiChloroMethane:MeOH (DCM, Sigma – 270997) 2:1. The next day, samples were washed for 1 h in 100% DCM followed by 3 washes in MeOH for 30, 45, and 60 minutes. Samples were bleached in H2O2 buffer (5% H2O2 in MeOH; hydrogen peroxide 30%, Sigma – 216763) for 4 hours at RT. Samples were rehydrated in a reverse MeOH/B1n gradient (from 80%, down to 20%) at RT for 30 minutes each followed by a 1 h incubation with B1n buffer. Samples were washed in 5% DMSO/0.3% glycine/PTxwH buffer (DMSO, Fisher – D128–4;Glycine, Sigma – G7126; PTxwH buffer: in PBS - Triton X-100: 0.1% (v/v), Tween 20: 0.05% (v/v), Heparin: 2 ug/ml, NaN3: 0.01% (w/v)). Samples were washed in PTxwH buffer 4x for 30 minutes, overnight, 1 h, and 2 h.
Brains were immunolabeled with anti-RFP primary antibody (final concentration 1:1000, rabbit, Rockland #600–401-379). The antibody was first diluted in PTxwH buffer (1:100 in 500 μl) then spun down (13,000 x g) and the supernatant was transferred to an additional 4.5 mL of PTxwH buffer in order to remove any debris. The final 1:1000 anti-RFP in PTxwH buffer was added to the brains and put on a shaker at 37°C for 11 days. Samples were then washed 2 × 1 h, 2 × 2 h, and 2 × 1 day in PTxwH buffer at 37°C. Secondary antibody was diluted in 500 μL of PTxwH and spun down at max speed for 30 minutes to remove any aggregates or debris. The supernatant (~480 μl) was added to 4.5 mL of PTxwH (final secondary concentration of 1:500) (secondary antibody: donkey anti-rabbit 647, Thermo Fisher Scientific – A-31573) and brains were incubated at 37°C with shaking for 8 days. The secondary antibody was washed as described following the primary antibody.
Following immunolabeling, brains were dehydrated in an MeOH gradient with H2O (20%–80%, as before), shaking at RT for 30 minutes for each step. Samples were washed 3x in 100% MeOH at RT for 30, 60, and 90 minutes followed by a wash with 2:1 DCM:MeOH overnight rocking at RT. The following morning, brains were washed in 100% DCM at RT 3× 1 h. The clearing step started with a wash in DiBenzylEther (DBE, Sigma – 108014) for 4 h, gently rocking at RT. Following this, the DBE was replaced with fresh DBE and brains were stored in the dark at RT prior to imaging.
Light sheet imaging and whole brain projection analysis
Cleared brains were imaged according to a published protocol (Ren et al., 2019). Whole brains were mounted and imaged on a LaVision Ultramicroscope II lightsheet using a 2x objective and 3 μm Z-step size. Whole brain fluorescence was collected using 640 nm laser excitation and autofluorescence was collected using 480 nm laser excitation.
Image alignments between channels and sample auto-fluorescence to the Allen Brain Atlas (ABA) serial two-photon tomography reference brain, were performed using elastix (https://elastix.lumc.nl/). Computational identification, extraction, and skeletonization of axon collaterals and processes was performed using the U-Net-based 3D convolutional neural network TrailMap (Ren et al., 2019; Friedmann et al., 2020). Regional statistics were generated by transforming the arborizations into the Allen Mouse Common Coordinate Framework (CCF) using the same parameters and vectors from the registration step. Axon/process content in each region was normalized to the size of the region and the total process content in each brain and was expressed as a density metric.
QUANTIFICATION AND STATISTICAL ANALYSIS
Whenever possible, quantification and analyses were performed blind to genotype. All statistical analyses and graphing were performed using GraphPad Prism 6 or 8 software. Datasets were first analyzed for normality using the D’Agostino and Pearson tests, and then parametric or non-parametric two-tailed statistical tests were employed accordingly to test for differences. For t tests, if the variances between two groups was significantly different, a Welch’s correction was applied. Significance was set as *p < 0.05, **p < 0.01, ***p < 0.001, and ****p < 0.0001. P values were corrected for multiple comparisons. The statistical tests and their outcomes for each experiment are indicated in the respective figure legend.
Supplementary Material
KEY RESOURCES TABLE.
| REAGENT or RESOURCE | SOURCE | IDENTIFIER |
|---|---|---|
| Antibodies | ||
| IHC anti-tyrosine hydroxylase primary | Immunostar | 22941 |
| IHC anti-RFP primary | Rockland | 600-401-379 |
| IHC Alexa Fluor 488 goat anti-mouse secondary | Thermo Fisher Scientific | A-11001 |
| IHC Alexa Fluor 633 goat anti-mouse secondary | Thermo Fisher Scientific | A-21050 |
| IHC Alexa Fluor 546 goat anti-rabbit secondary | Thermo Fisher Scientific | A-11035 |
| WB anti-Histone-3 primary | Cell Signaling | 96C10 |
| WB anti-VMAT2 primary | Alomone Labs | AMT-006 |
| WB anti-Dopamine Transporter primary | Abcam | 128848 |
| WB goat anti-rabbit HRP secondary | Bio-Rad | 170–5046 |
| WB goat anti-mouse HRP secondary | Bio-Rad | 170–5047 |
| Bacterial and virus strains | ||
| AAV5-hSyn-Coff/Fon-EYFP-WPRE | UNC vector core | N/A |
| AAV8-hSyn-Con/Fon-hChR2(H134R)-EYFP | Addgene | 55645-AAV8 |
| AAV-DJ-hSyn-Coff/Fon-eYFP-WPRE | Stanford Gene Vector and Virus Core | GVVC-AAV-082 |
| Chemicals, peptides, and recombinant proteins | ||
| isoflurane | Piramal Healthcare | PIR001710 |
| paraformaldehyde | Electron Microscopy Sciences | 15710-S |
| sodium azide | Sigma-Aldrich | 26628-22-8 |
| BlockAid blocking solution | Life Technologies | B10710 |
| Triton X-100 | Sigma-Aldrich | T8787 |
| Halt phosphatase buffer inhibitor | Fisher Scientific | PI78420 |
| Complete mini EDTA-free protease inhibitor | Roche | 4693159001 |
| 4x Laemmli sample buffer | Bio-Rad | 161–0747 |
| 2-mercaptoethanol | Thermo Fisher Scientific | 21985023 |
| Critical commercial assays | ||
| In-Fusion HD cloning | Takara | 639649 |
| BCA assay | Fisher Scientific | PI23227 |
| Experimental models: Cell lines | ||
| Ai65 mouse embryonic stem cells | gift from Dr. Tanya Daigle | Derived from JAX strain #021875 |
| Experimental models: Organisms/strains | ||
| DAT-P2A-Flpo mice | Generated in this study, deposited with Jackson Laboratories (JAX) | JAX stock #035436 |
| DAT-IRES-Cre mice | Jackson Laboratory | JAX stock #006660 |
| C57BL/6J mice | Jackson Laboratory | JAX stock #000664 |
| RCE-FRT mice | Jackson Laboratory | JAX stock #32038 |
| Ai65D mice | Jackson Laboratory | JAX stock #021875 |
| Nex-Cre mice | gift from Dr. Klaus-Armin Nave; Goebbels et al., 2006 | N/A |
| Oligonucleotides | ||
| CATGCAGAAGGACAGACACT | Integrated DNA technologies | current study; DAT-Flpo geno forward |
| AGGATGTCGAACTGGCTCAT | Integrated DNA technologies | current study; Flpo insert reverse |
| ACCCTGCGTGTGTGTAATAT | Integrated DNA technologies | current study; DAT-Flpo geno reverse |
| DAT-P2A-Flpo gBlock gene fragment | Integrated DNA technologies | current study; see STAR Methods for sequence |
| Recombinant DNA | ||
| pCRII-TOPO plasmid | Invitrogen | Part of kit #K461020 |
| pX330 Cas9 plasmid | Addgene | #42230 |
| Software and algorithms | ||
| ImageJ | NIH | N/A |
| GraphPad Prism | GraphPad Software | N/A |
| ANY-maze | Stoelting Co | N/A |
| TrailMap | Friedmann et al., 2020 | N/A |
Highlights.
DAT-P2A-Flpo mice allow genetic access to dopamine (DA) neurons
DAT+/Neurod6+ cells labeled with Flp/Cre reporters project to the NAc medial shell
Whole-brain imaging of DAT+/Neurod6+ cells reveals selective projection patterns
Optogenetic activation of DAT+/Neurod6+ cells evokes DA release in the medial shell
ACKNOWLEDGMENTS
This work was supported by an NIMH Brain Initiative grant and supplement to J.N. (U01 MH-105878, H.S.B. co-investigator) and a Brain Initiative R01 to L.L. (NS-104698). H.S.B. was supported by a fellowship from the Alfred P. Sloan Foundation. H.S.B. and P.K. were supported by NARSAD Young Investigator Grants from the Brain & Behavior Research Foundation (25073 to H.S.B. and 27458 to P.K.). H.S.B. and D.H. are Chan Zuckerberg Biohub Investigators. D.H. is a Pew-Stewart Scholar for Cancer Research supported by the Pew Charitable Trusts and the Alexander and Margaret Stewart Trust. D.H. is supported by the Siebel Stem Cell Institute. The NEX-Cre mice were kindly provided by Dr. Klaus-Armin Nave. We thank Holly Aaron and Feather Ives in the UC Berkeley Molecular Imaging Center for their microscopy training and assistance. We thank Dr. Johannes De Jong and Dr. Stephan Lammel for their feedback on this project. We thank Dr. Tanya Daigle for providing the Ai65 mouse stem cells. We thank Victoria Du for assistance with the mouse colony and the rest of the Bateup lab for helpful discussions and comments.
Footnotes
DECLARATION OF INTERESTS
The authors declare no financial or non-financial competing interests.
SUPPLEMENTAL INFORMATION
Supplemental information can be found online at https://doi.org/10.1016/j.celrep.2021.109123.
REFERENCES
- Agarwal A, Dibaj P, Kassmann CM, Goebbels S, Nave KA, and Schwab MH (2012). In vivo imaging and noninvasive ablation of pyramidal neurons in adult NEX-CreERT2 mice. Cereb. Cortex 22, 1473–1486. [DOI] [PubMed] [Google Scholar]
- Anderzhanova EA, Bächli H, Buneeva OA, Narkevich VB, Medvedev AE, Thoeringer CK, Wotjak CT, and Kudrin VS (2013). Strain differences in profiles of dopaminergic neurotransmission in the prefrontal cortex of the BALB/C vs. C57Bl/6 mice: consequences of stress and afobazole. Eur. J. Pharmacol. 708, 95–104. [DOI] [PubMed] [Google Scholar]
- Awatramani R, Soriano P, Rodriguez C, Mai JJ, and Dymecki SM (2003). Cryptic boundaries in roof plate and choroid plexus identified by intersectional gene activation. Nat. Genet. 35, 70–75. [DOI] [PubMed] [Google Scholar]
- Bäckman CM, Malik N, Zhang Y, Shan L, Grinberg A, Hoffer BJ, Westphal H, and Tomac AC (2006). Characterization of a mouse strain expressing Cre recombinase from the 3′ untranslated region of the dopamine transporter locus. Genesis 44, 383–390. [DOI] [PubMed] [Google Scholar]
- Bateup HS, Santini E, Shen W, Birnbaum S, Valjent E, Surmeier DJ, Fisone G, Nestler EJ, and Greengard P (2010). Distinct subclasses of medium spiny neurons differentially regulate striatal motor behaviors. Proc. Natl. Acad. Sci. USA 107, 14845–14850. [DOI] [PMC free article] [PubMed] [Google Scholar]
- Baxter KK, Uittenbogaard M, and Chiaramello A (2012). The neurogenic basic helix-loop-helix transcription factor NeuroD6 enhances mitochondrial biogenesis and bioenergetics to confer tolerance of neuronal PC12-NeuroD6 cells to the mitochondrial stressor rotenone. Exp. Cell Res. 318, 2200–2214. [DOI] [PMC free article] [PubMed] [Google Scholar]
- Berke JD (2018). What does dopamine mean? Nat. Neurosci. 21, 787–793. [DOI] [PMC free article] [PubMed] [Google Scholar]
- Bimpisidis Z, König N, Stagkourakis S, Zell V, Vlcek B, Dumas S, Giros B, Broberger C, Hnasko TS, and Wallén-Mackenzie Å (2019). The neuroD6 subtype of VTA neurons contributes to psychostimulant sensitization and behavioral reinforcement. eNeuro 6, ENEURO.0066–19.2019. [DOI] [PMC free article] [PubMed] [Google Scholar]
- Björklund A, and Dunnett SB (2007). Dopamine neuron systems in the brain: an update. Trends Neurosci. 30, 194–202. [DOI] [PubMed] [Google Scholar]
- Brichta L, and Greengard P (2014). Molecular determinants of selective dopaminergic vulnerability in Parkinson’s disease: an update. Front. Neuroanat. 8, 152. [DOI] [PMC free article] [PubMed] [Google Scholar]
- Cardozo Pinto DF, Yang H, Pollak Dorocic I, de Jong JW, Han VJ, Peck JR, Zhu Y, Liu C, Beier KT, Smidt MP, and Lammel S (2019). Characterization of transgenic mouse models targeting neuromodulatory systems reveals organizational principles of the dorsal raphe. Nat. Commun. 10, 4633. [DOI] [PMC free article] [PubMed] [Google Scholar]
- Chi J, Crane A, Wu Z, and Cohen P (2018). Adipo-clear: A tissue clearing method for three-dimensional imaging of adipose tissue. J. Vis. Exp. 2018, 1–9. [DOI] [PMC free article] [PubMed] [Google Scholar]
- Chohan MO, Esses S, Haft J, Ahmari SE, and Veenstra-VanderWeele J (2020). Altered baseline and amphetamine-mediated behavioral profiles in dopamine transporter Cre (DAT-Ires-Cre) mice compared to tyrosine hydroxylase Cre (TH-Cre) mice. Psychopharmacology (Berl.) 237, 3553–3568. [DOI] [PMC free article] [PubMed] [Google Scholar]
- Ciliax BJ, Heilman C, Demchyshyn LL, Pristupa ZB, Ince E, Hersch SM, Niznik HB, and Levey AI (1995). The dopamine transporter: immunochemical characterization and localization in brain. J. Neurosci. 15, 1714–1723. [DOI] [PMC free article] [PubMed] [Google Scholar]
- Collins AL, and Saunders BT (2020). Heterogeneity in striatal dopamine circuits: Form and function in dynamic reward seeking. J. Neurosci. Res. 98, 1046–1069. [DOI] [PMC free article] [PubMed] [Google Scholar]
- Cong L, Ran FA, Cox D, Lin S, Barretto R, Habib N, Hsu PD, Wu X, Jiang W, Marraffini LA, and Zhang F (2013). Multiplex genome engineering using CRISPR/Cas systems. Science 339, 819–823. [DOI] [PMC free article] [PubMed] [Google Scholar]
- Corre J, van Zessen R, Loureiro M, Patriarchi T, Tian L, Pascoli V, and Lüscher C (2018). Dopamine neurons projecting to medial shell of the nucleus accumbens drive heroin reinforcement. eLife 7, e39945. [DOI] [PMC free article] [PubMed] [Google Scholar]
- Costa KM, Schenkel D, and Roeper J (2021). Sex-dependent alterations in behavior, drug responses and dopamine transporter expression in heterozygous DAT-Cre mice. Sci. Rep. 11, 3334. [DOI] [PMC free article] [PubMed] [Google Scholar]
- Dahlstroem A, and Fuxe K (1964). Evidence for the existence of monoamine-containing neurons in the central nervous system. 1. Demonstration of monoamines in the cell bodies of brain stem neurons. Acta Physiol Scand Suppl 232, 1–55. [PubMed] [Google Scholar]
- de Jong JW, Afjei SA, Pollak Dorocic I, Peck JR, Liu C, Kim CK, Tian L, Deisseroth K, and Lammel S (2019). A Neural Circuit Mechanism for Encoding Aversive Stimuli in the Mesolimbic Dopamine System. Neuron 101, 133–151.e7. [DOI] [PMC free article] [PubMed] [Google Scholar]
- Dougalis AG, Matthews GAC, Bishop MW, Brischoux F, Kobayashi K, and Ungless MA (2012). Functional properties of dopamine neurons and co-expression of vasoactive intestinal polypeptide in the dorsal raphe nucleus and ventro-lateral periaqueductal grey. Eur. J. Neurosci. 36, 3322–3332. [DOI] [PMC free article] [PubMed] [Google Scholar]
- Fenno LE, Mattis J, Ramakrishnan C, Hyun M, Lee SY, He M, Tucciarone J, Selimbeyoglu A, Berndt A, Grosenick L, et al. (2014). Targeting cells with single vectors using multiple-feature Boolean logic. Nat. Methods 11, 763–772. [DOI] [PMC free article] [PubMed] [Google Scholar]
- Friedmann D, Pun A, Adams EL, Lui JH, Kebschull JM, Grutzner SM, Castagnola C, Tessier-Lavigne M, and Luo L (2020). Mapping mesoscale axonal projections in the mouse brain using a 3D convolutional network. Proc. Natl. Acad. Sci. USA 117, 11068–11075. [DOI] [PMC free article] [PubMed] [Google Scholar]
- Gerfen CR, and Surmeier DJ (2011). Modulation of striatal projection systems by dopamine. Annu. Rev. Neurosci. 34, 441–466. [DOI] [PMC free article] [PubMed] [Google Scholar]
- Gerfen CR, Paletzki R, and Heintz N (2013). GENSAT BAC cre-recombinase driver lines to study the functional organization of cerebral cortical and basal ganglia circuits. Neuron 80, 1368–1383. [DOI] [PMC free article] [PubMed] [Google Scholar]
- German DC, Manaye K, Smith WK, Woodward DJ, and Saper CB (1989). Midbrain dopaminergic cell loss in Parkinson’s disease: computer visualization. Ann. Neurol. 26, 507–514. [DOI] [PubMed] [Google Scholar]
- Gershman SJ, and Uchida N (2019). Believing in dopamine. Nat. Rev. Neurosci. 20, 703–714. [DOI] [PMC free article] [PubMed] [Google Scholar]
- Gertsenstein M, Nutter LMJ, Reid T, Pereira M, Stanford WL, Rossant J, and Nagy A (2010). Efficient generation of germ line transmitting chimeras from C57BL/6N ES cells by aggregation with outbred host embryos. PLoS ONE 5, e11260. [DOI] [PMC free article] [PubMed] [Google Scholar]
- Goebbels S, Bormuth I, Bode U, Hermanson O, Schwab MH, and Nave K-A (2006). Genetic Targeting of Principal Neurons in Neocortex and Hippocampus of NEX-Cre Mice. Genesis 44, 611–621. [DOI] [PubMed] [Google Scholar]
- Gong S, Doughty M, Harbaugh CR, Cummins A, Hatten ME, Heintz N, and Gerfen CR (2007). Targeting Cre recombinase to specific neuron populations with bacterial artificial chromosome constructs. J. Neurosci. 27, 9817–9823. [DOI] [PMC free article] [PubMed] [Google Scholar]
- Heiman M, Schaefer A, Gong S, Peterson JD, Day M, Ramsey KE, Suárez-Fariñas M, Schwarz C, Stephan DA, Surmeier DJ, et al. (2008). A translational profiling approach for the molecular characterization of CNS cell types. Cell 135, 738–748. [DOI] [PMC free article] [PubMed] [Google Scholar]
- Henny P, Brown MTC, Northrop A, Faunes M, Ungless MA, Magill PJ, and Bolam JP (2012). Structural correlates of heterogeneous in vivo activity of midbrain dopaminergic neurons. Nat. Neurosci. 15, 613–619. [DOI] [PMC free article] [PubMed] [Google Scholar]
- Hook PW, McClymont SA, Cannon GH, Law WD, Morton AJ, Goff LA, and McCallion AS (2018). Single-Cell RNA-Seq of Mouse Dopaminergic Neurons Informs Candidate Gene Selection for Sporadic Parkinson Disease. Am. J. Hum. Genet. 102, 427–446. [DOI] [PMC free article] [PubMed] [Google Scholar]
- Huang ZJ, and Zeng H (2013). Genetic approaches to neural circuits in the mouse. Annu. Rev. Neurosci. 36, 183–215. [DOI] [PubMed] [Google Scholar]
- Ingram DK, and Corfman TP (1980). An overview of neurobiological comparisons in mouse strains. Neurosci. Biobehav. Rev. 4, 421–435. [DOI] [PubMed] [Google Scholar]
- Khan S, Stott SR, Chabrat A, Truckenbrodt AM, Spencer-Dene B, Nave K-A, Guillemot F, Levesque M, and Ang S-L (2017). Survival of a novel subset of midbrain dopaminergic neurons projecting to the lateral septum is dependent on NeuroD proteins. J. Neurosci. 37, 2305–2316. [DOI] [PMC free article] [PubMed] [Google Scholar]
- Kim JH, Lee SR, Li LH, Park HJ, Park JH, Lee KY, Kim MK, Shin BA, and Choi SY (2011). High cleavage efficiency of a 2A peptide derived from porcine teschovirus-1 in human cell lines, zebrafish and mice. PLoS ONE 6, e18556. [DOI] [PMC free article] [PubMed] [Google Scholar]
- Kok MA, and Fu Y (2021). A new mouse tool for studying dopaminergic neurons. J. Neurosci. Methods 347, 108968. [DOI] [PubMed] [Google Scholar]
- Kramer DJ, Risso D, Kosillo P, Ngai J, and Bateup HS (2018). Combinatorial expression of Grp and Neurod6 defines dopamine neuron populations with distinct projection patterns and disease vulnerability. eNeuro 5, ENEURO.0152–18.2018. [DOI] [PMC free article] [PubMed] [Google Scholar]
- Kravitz AV, Freeze BS, Parker PRL, Kay K, Thwin MT, Deisseroth K, and Kreitzer AC (2010). Regulation of parkinsonian motor behaviours by optogenetic control of basal ganglia circuitry. Nature 466, 622–626. [DOI] [PMC free article] [PubMed] [Google Scholar]
- La Manno G, Gyllborg D, Codeluppi S, Nishimura K, Salto C, Zeisel A, Borm LE, Stott SRW, Toledo EM, Villaescusa JC, et al. (2016). Molecular Diversity of Midbrain Development in Mouse, Human, and Stem Cells. Cell 167, 566–580.e19. [DOI] [PMC free article] [PubMed] [Google Scholar]
- Lammel S, Hetzel A, Häckel O, Jones I, Liss B, and Roeper J (2008). Unique properties of mesoprefrontal neurons within a dual mesocorticolimbic dopamine system. Neuron 57, 760–773. [DOI] [PubMed] [Google Scholar]
- Lammel S, Lim BK, and Malenka RC (2014). Reward and aversion in a heterogeneous midbrain dopamine system. Neuropharmacology 76 (Pt B), 351–359. [DOI] [PMC free article] [PubMed] [Google Scholar]
- Lammel S, Steinberg EE, Földy C, Wall NR, Beier K, Luo L, and Malenka RC (2015). Diversity of transgenic mouse models for selective targeting of midbrain dopamine neurons. Neuron 85, 429–438. [DOI] [PMC free article] [PubMed] [Google Scholar]
- Lerner TN, Shilyansky C, Davidson TJ, Evans KE, Beier KT, Zalocusky KA, Crow AK, Malenka RC, Luo L, Tomer R, and Deisseroth K (2015). Intact-Brain Analyses Reveal Distinct Information Carried by SNc Dopamine Subcircuits. Cell 162, 635–647. [DOI] [PMC free article] [PubMed] [Google Scholar]
- Lindeberg J, Usoskin D, Bengtsson H, Gustafsson A, Kylberg A, Söderström S, and Ebendal T (2004). Transgenic expression of Cre recombinase from the tyrosine hydroxylase locus. Genesis 40, 67–73. [DOI] [PubMed] [Google Scholar]
- Luo L, Callaway EM, and Svoboda K (2018). Genetic Dissection of Neural Circuits: A Decade of Progress. Neuron 98, 256–281. [DOI] [PMC free article] [PubMed] [Google Scholar]
- Madisen L, Garner AR, Shimaoka D, Chuong AS, Klapoetke NC, Li L, van der Bourg A, Niino Y, Egolf L, Monetti C, et al. (2015). Transgenic mice for intersectional targeting of neural sensors and effectors with high specificity and performance. Neuron 85, 942–958. [DOI] [PMC free article] [PubMed] [Google Scholar]
- Morales M, and Margolis EB (2017). Ventral tegmental area: cellular heterogeneity, connectivity and behaviour. Nat. Rev. Neurosci. 18, 73–85. [DOI] [PubMed] [Google Scholar]
- Ng L, Bernard A, Lau C, Overly CC, Dong H-W, Kuan C, Pathak S, Sunkin SM, Dang C, Bohland JW, et al. (2009). An anatomic gene expression atlas of the adult mouse brain. Nat. Neurosci. 12, 356–362. [DOI] [PubMed] [Google Scholar]
- O’Neill B, Patel JC, and Rice ME (2017). Characterization of Optically and Electrically Evoked Dopamine Release in Striatal Slices from Digenic Knock-in Mice with DAT-Driven Expression of Channelrhodopsin. ACS Chem. Neurosci. 8, 310–319. [DOI] [PMC free article] [PubMed] [Google Scholar]
- Okaty BW, Sturrock N, Escobedo Lozoya Y, Chang Y, Senft RA, Lyon KA, Alekseyenko OV, and Dymecki SM (2020). A single-cell transcriptomic and anatomic atlas of mouse dorsal raphe Pet1 neurons. eLife 9, e55523. [DOI] [PMC free article] [PubMed] [Google Scholar]
- Paxinos G, and Franklin KBJ (2004). The Mouse Brain in Stereotaxic Coordinates (Elsevier; ). [Google Scholar]
- Poulin JF, Zou J, Drouin-Ouellet J, Kim KYA, Cicchetti F, and Awatramani RB (2014). Defining midbrain dopaminergic neuron diversity by single-cell gene expression profiling. Cell Rep. 9, 930–943. [DOI] [PMC free article] [PubMed] [Google Scholar]
- Poulin J-F, Tasic B, Hjerling-Leffler J, Trimarchi JM, and Awatramani R (2016). Disentangling neural cell diversity using single-cell transcriptomics. Nat. Neurosci. 19, 1131–1141. [DOI] [PubMed] [Google Scholar]
- Poulin JF, Caronia G, Hofer C, Cui Q, Helm B, Ramakrishnan C, Chan CS, Dombeck DA, Deisseroth K, and Awatramani R (2018). Mapping projections of molecularly defined dopamine neuron subtypes using intersectional genetic approaches. Nat. Neurosci. 21, 1260–1271. [DOI] [PMC free article] [PubMed] [Google Scholar]
- Poulin JF, Gaertner Z, Moreno-Ramos OA, and Awatramani R (2020). Classification of Midbrain Dopamine Neurons Using Single-Cell Gene Expression Profiling Approaches. Trends Neurosci. 43, 155–169. [DOI] [PMC free article] [PubMed] [Google Scholar]
- Raymond CS, and Soriano P (2007). High-efficiency FLP and PhiC31 site-specific recombination in mammalian cells. PLoS ONE 2, e162. [DOI] [PMC free article] [PubMed] [Google Scholar]
- Ren J, Isakova A, Friedmann D, Zeng J, Grutzner SM, Pun A, Zhao GQ, Kolluru SS, Wang R, Lin R, et al. (2019). Single-cell transcriptomes and whole-brain projections of serotonin neurons in the mouse dorsal and median raphe nuclei. eLife 8, 1–36. [DOI] [PMC free article] [PubMed] [Google Scholar]
- Renier N, Wu Z, Simon DJ, Yang J, Ariel P, and Tessier-Lavigne M (2014). iDISCO: a simple, rapid method to immunolabel large tissue samples for volume imaging. Cell 159, 896–910. [DOI] [PubMed] [Google Scholar]
- Roeper J (2013). Dissecting the diversity of midbrain dopamine neurons. Trends Neurosci. 36, 336–342. [DOI] [PubMed] [Google Scholar]
- Roostalu U, Salinas CBG, Thorbek DD, Skytte JL, Fabricius K, Barkholt P, John LM, Jurtz VI, Knudsen LB, Jelsing J, et al. (2019). Quantitative whole-brain 3D imaging of tyrosine hydroxylase-labeled neuron architecture in the mouse MPTP model of Parkinson’s disease. Dis. Model. Mech. 12, 1–13. [DOI] [PMC free article] [PubMed] [Google Scholar]
- Saunders A, Macosko EZ, Wysoker A, Goldman M, Krienen FM, de Rivera H, Bien E, Baum M, Bortolin L, Wang S, et al. (2018). Molecular Diversity and Specializations among the Cells of the Adult Mouse Brain. Cell 174, 1015–1030.e16. [DOI] [PMC free article] [PubMed] [Google Scholar]
- Savitt JM, Jang SS, Mu W, Dawson VL, and Dawson TM (2005). Bcl-x is required for proper development of the mouse substantia nigra. J. Neurosci. 25, 6721–6728. [DOI] [PMC free article] [PubMed] [Google Scholar]
- Sawamoto K, Nakao N, Kobayashi K, Matsushita N, Takahashi H, Kakishita K, Yamamoto A, Yoshizaki T, Terashima T, Murakami F, et al. (2001). Visualization, direct isolation, and transplantation of midbrain dopaminergic neurons. Proc. Natl. Acad. Sci. USA 98, 6423–6428. [DOI] [PMC free article] [PubMed] [Google Scholar]
- Schultz W (2019). Recent advances in understanding the role of phasic dopamine activity. F1000Res. 8, F1000 Faculty Rev-1680. [DOI] [PMC free article] [PubMed] [Google Scholar]
- Sharma S, Kim LH, Mayr KA, Elliott DA, and Whelan PJ (2018). Parallel descending dopaminergic connectivity of A13 cells to the brainstem locomotor centers. Sci. Rep. 8, 7972. [DOI] [PMC free article] [PubMed] [Google Scholar]
- Soden ME, Miller SM, Burgeno LM, Phillips PEM, Hnasko TS, and Zweifel LS (2016). Genetic Isolation of Hypothalamic Neurons that Regulate Context-Specific Male Social Behavior. Cell Rep. 16, 304–313. [DOI] [PMC free article] [PubMed] [Google Scholar]
- Sousa VH, Miyoshi G, Hjerling-Leffler J, Karayannis T, and Fishell G (2009). Characterization of Nkx6–2-derived neocortical interneuron lineages. Cereb. Cortex 19 (Suppl 1), i1–i10. [DOI] [PMC free article] [PubMed] [Google Scholar]
- Sousa AMM, Zhu Y, Raghanti MA, Kitchen RR, Onorati M, Tebbenkamp ATN, Stutz B, Meyer KA, Li M, Kawasawa YI, et al. (2017). Molecular and cellular reorganization of neural circuits in the human lineage. Science 358, 1027–1032. [DOI] [PMC free article] [PubMed] [Google Scholar]
- Stuber GD, Hnasko TS, Britt JP, Edwards RH, and Bonci A (2010). Dopaminergic terminals in the nucleus accumbens but not the dorsal striatum corelease glutamate. J. Neurosci. 30, 8229–8233. [DOI] [PMC free article] [PubMed] [Google Scholar]
- Uittenbogaard M, Baxter KK, and Chiaramello A (2010). The neurogenic basic helix-loop-helix transcription factor NeuroD6 confers tolerance to oxidative stress by triggering an antioxidant response and sustaining the mitochondrial biomass. ASN Neuro 2, e00034. [DOI] [PMC free article] [PubMed] [Google Scholar]
- Viereckel T, Dumas S, Smith-Anttila CJA, Vlcek B, Bimpisidis Z, Lagerström MC, Konradsson-Geuken Å, and Wallén-Mackenzie Å (2016). Midbrain Gene Screening Identifies a New Mesoaccumbal Glutamatergic Pathway and a Marker for Dopamine Cells Neuroprotected in Parkinson’s Disease. Sci. Rep. 6, 35203. [DOI] [PMC free article] [PubMed] [Google Scholar]
- Vogt Weisenhorn DM, Giesert F, and Wurst W (2016). Diversity matters - heterogeneity of dopaminergic neurons in the ventral mesencephalon and its relation to Parkinson’s Disease. J. Neurochem. 139 (Suppl 1), 8–26. [DOI] [PMC free article] [PubMed] [Google Scholar]
- Wise RA, and Rompre PP (1989). Brain dopamine and reward. Annu. Rev. Psychol. 40, 191–225. [DOI] [PubMed] [Google Scholar]
- Zaborszky L, and Vadasz C (2001). The midbrain dopaminergic system: anatomy and genetic variation in dopamine neuron number of inbred mouse strains. Behav. Genet. 31, 47–59. [DOI] [PubMed] [Google Scholar]
Associated Data
This section collects any data citations, data availability statements, or supplementary materials included in this article.
Supplementary Materials
Data Availability Statement
The source data supporting the current study have not been deposited in a public repository but are available from the corresponding author on request. This study did not generate unique code.