

Abstract
More and more rapid antigen tests for the diagnosis of severe acute respiratory syndrome coronavirus 2 (SARS‐CoV‐2) appear in the market with varying performance. The sensitivity of these tests heavily depends on the viral load, extrapolated by the threshold cycle (Ct). It is therefore essential to verify their performance before their inclusion in routine. The Coronavirus Ag Rapid Test Cassette Bio‐Rad, the GSD NovaGen SARS‐CoV‐2 (COVID‐19) Antigen Rapid Test, and the Aegle Coronavirus Ag Rapid Test Cassette were evaluated on 199 samples: 150 fresh samples from the routine and positive in quantitative reverse‐transcription polymerase chain reaction (RT‐qPCR), nine fresh samples negative in RT‐qPCR, and 40 frozen samples, taken before the discovery of SARS‐CoV‐2 but positive for other respiratory viruses. Positive RT‐qPCR samples were categorized according to their Ct: Ct < 20 (18.7%), ≥ 20–< 25 (27.3%), ≥ 25–< 30 (18.7%), ≥ 30–35 (17.3%), and > 35 (18.0%). Sensitivities (95% confidence interval) for Ct below 25 were 95.7% (92.4–98.9), 97.1% (94.4–99.8), and 97.1% (94.4–99.8) for GSD NovaGen, Bio‐Rad, and Aegle, respectively but drastically dropped when Ct exceeded 27. Among samples with previously diagnosed viruses, seven false‐positive results were found with GSD NovaGen only (specificity 85.7%). Equivalent, high sensitivities were observed with the highest viral load samples. The GSD NovaGen assay showed less specificity. Although the three kits tested in this study are inadequate for routine testing in a high throughput laboratory, they can help to quickly identify the most infectious patients and screen their close contacts in an environment where molecular tests are not readily available.
Keywords: COVID‐19, point‐of‐care testing, rapid antigen test, SARS‐CoV‐2
1. INTRODUCTION
The biological diagnosis of severe acute respiratory syndrome coronavirus 2 (SARS‐CoV‐2) needs highly sensitive molecular methods. These methods require significant infrastructure and expertise and the turn‐around time varies from a few hours to 2 working days. However, in certain circumstances, it is important to obtain rapid and low‐cost results without having to send the sample to a specialized laboratory. This can be the case in tracing and screening centers, in general practices, and in regions where molecular technologies are not readily available. The rapid antigen tests try to fulfill this mission and can be used directly on the subject, providing a result in a few minutes, thus allowing rapid decision‐making. However, the performance of these point‐of‐care tests is lower than that of molecular methods and often depends on the sample viral burden. 1 , 2 Moreover, while the specificities are often higher than 97%, the sensitivities fluctuate widely depending on the tests used, the targeted population, or the study design. 2 , 3 , 4 , 5 , 6 , 7 , 8 , 9 , 10 It is therefore important to assess the performance of a rapid antigen test before its implementation in clinical routine practice. The Coronavirus Ag Rapid Test Cassette, the GSD NovaGen SARS‐CoV‐2 (coronavirus disease 2019 [COVID‐19]) Antigen Rapid Test, and Aegle Coronavirus Ag Rapid Test Cassette are three new immunochromatographic assays recently made available in the market. In this evaluation, we compared these three tests to a quantitative reverse‐transcription polymerase chain reaction (RT‐qPCR) considered as the reference method. The sensitivity for each test was calculated globally and after sample stratification according to their viral load approximated by their cycle threshold value (Ct).
2. MATERIAL AND METHODS
2.1. Study design and sample collection
This study was conducted from February 2 to March 3, 2021, at the clinical biology laboratory of the Iris Sud Hospitals (HIS‐IZZ, Brussels, Belgium). The clinical performances of three antigen kits were assessed using a panel of 199 clinical samples. Among those, 150 positive samples were prospectively selected from the routine PCR‐positive clinical samples to evaluate the sensitivity. Negative PCR samples (N = 9) were also selected for the calculation of the specificity as well as frozen respiratory samples from a pre‐COVID collection and positive for other respiratory viruses (N = 40, some samples with coinfections), to detect possible cross‐reactions: respiratory syncytial virus A (RSV) (N = 11) and B (N = 3); influenza A (N = 11) and B (N = 5); human metapneumovirus (hMPV) (N = 4); entero/rhinovirus (N = 19). Those viruses were identified by the Influenza National Reference Laboratory Sciensano in the context of a previous study using two in‐house RT‐qPCR (RT‐qPCR influenza A/B and multiplex RT‐qPCR for RSV A, RSV B, hMPV, and enterovirus). With the exception of the 40 frozen naso‐pharyngeal aspirates from a collection of respiratory viruses other than SARS‐CoV‐2, the samples included were nasopharyngeal swabs freshly collected from UTM‐RT (Copan SpA) or from Vacuette Virus Stabilization Tube (Greiner Bio‐One International GmbH).
2.2. Molecular analyses
Our RT‐qPCR used in routine is able to detect the envelop gene of SARS‐CoV‐2 (E gene), the RNA‐dependent RNA polymerase gene (RdRP gene), the envelope glycoproteins spike gene (S gene) and the nucleocapsid gene (N gene). The RdRP and S genes are detected simultaneously with the same fluorophore. The different steps of the RT‐qPCR were performed with the STARMag Viral DNA/RNA 200 C Kit and Allplex® SARS‐CoV‐2 Assay RT‐qPCR (Seegene Technologies) for the RNA extraction and the master mix preparation respectively. Ten microliters of Allplex® internal control was added to 200 µl of sample to obtain a 100 µl‐eluate of purified RNA. Five microliters of the extraction eluate is added to 15 µl of a master mix made of 5 µl of probes and nucleotides mix MuDT Oligo Mix (MOM), 5 µl of RNase free water, and 5 µl enzyme mix EM8. The complementary DNA synthesis and amplification were performed with a CFX96 C1000 thermal cycler (Bio‐Rad Laboratories). A sample was considered positive if at least one of the targets sought was positive with a Ct value less than 40. Results interpretation and Ct calculation were performed with Seegene SARS‐CoV‐2 Viewer software version 3.19.003.010 (Seegene Technologies). Samples were categorized according to the mean Ct of the detected targets: <20; ≥ 20–< 25; ≥ 25–< 30; ≥30–35; > 35. The concordance between mean Ct and viral burden was calculated from a cell culture containing 9.04 log copies/ml of SARS‐CoV‐2. Nine dilutions of this sample were tested in RT‐qPCR in triplicate. The equation of the regression curve is y (log viral load) = −0.2986 × (Ct) + 12.253.
2.3. Immunochromatographic analysis
The performance of the Coronavirus Ag Rapid Test Cassette (Bio‐Rad), the GSD NovaGen SARS‐CoV‐2 (COVID‐19) Antigen Rapid Test (NovaTec Immunodiagnostica GmbH), and the Aegle Coronavirus Ag Rapid Test Cassette (LumiraDx) were evaluated. The three antigen kits consist of qualitative membrane‐based immunoassays based on the detection of the SARS‐CoV‐2 nucleocapsid antigen for the rapid detection of COVID‐19‐positive patients. The swabs from the different kits were incubated for 10 min in the viral transport medium previously analyzed in RT‐qPCR. With the exception of this incubation step, intended to mimic the patient's nasopharyngeal swab, all analytical steps were followed according to the manufacturers' recommendations. The three antigen kits were compared in parallel on the same samples and during the same run. Each run was assessed in batches of a maximum of six samples. A test is considered valid if the control line is visible and is considered positive if any test line is visible. All the assays were read by two different operators blinded to each other's results. In case of discrepancy, a third operator reading was requested to decide. Operators reported positive results as “weak” when the line was hard to see.
2.4. Statistical analysis
Statistical analysis was carried out using MedCalc version 10.4.0.0 (MedCalc Software). Descriptive statistics were used to analyze the data. Sensitivity was defined as the proportion of correctly identified SARS‐CoV‐2 positive patients by the rapid antigen tests who were also positive by RT‐qPCR. Specificity was defined as the proportion of samples correctly identified as negative by the rapid antigen tests initially categorized as negative by RT‐qPCR or among the pre‐COVID collection. Overall sensitivity for each test was calculated. In addition, sensitivities were calculated according to the viral load distribution of samples into five groups (Ct values of <20; ≥ 20–< 25; ≥ 25–< 30; ≥30–35; > 35). A Kruskal–Wallis test was used to assess differences between the Ct of the different targets and the median Ct. A test with a Cohen's kappa score was used to evaluate the agreement between the three kits and the reference RT‐qPCR. A kappa score from 0.61 to 0.80 signs a substantial level of agreement. Above 0.80, the level of agreement is almost perfect. 11
3. RESULTS
One hundred and ninety‐nine samples were included in this evaluation with a distribution of 150 positives and 49 negatives. The positive samples were not selected a priori according to their Ct. The observed mean Ct dispersion is therefore really representative of what was observed in routine. The median of the average Ct (±95% confidence interval [CI) was 25.83 (±1.09). A Kruskal–Wallis test comparing the mean Ct with the one obtained for each target separately did not show any significant difference (p = 0.59). Therefore, we selected the mean Ct for comparison purposes. The Ct distribution of positive samples were: Ct < 20 (N = 28; 18.7%), ≥ 20–< 25 (N = 41; 27.3%), ≥ 25–<30 (N = 28; 18.7%), ≥ 30–35 (N = 26; 17.3%), > 35 (N = 27; 18.0%). Among RT‐qPCR positives, the three targeted genes were detected in 129 samples (86.0%), two genes were detected in 10 samples (6.7%) and only one gene was detected in the remaining 11 samples (7.3%). The number of weak positive antigen tests was 24 for GSD NovaGen and 19 for Bio‐Rad and Aegle. Of these, three tests required a third operator reading for GSD NovaGen and five for both Bio‐Rad and Aegle. For Ct equal or above 20, reading difficulties occurred sporadically and often for the three tests at the same time. Only two Aegle tests did not show a control line and were, therefore, categorized as invalid. Figure 1A–C illustrates the relationship between Ct and observed sensitivity. The overall sensitivities (95% CI) were 61.9% (54.1–69.7), 62.7% (55.0–70.4), and 64.0% (56.3–71.7) for GSD NovaGen, Bio‐Rad, and Aegle, respectively. Nevertheless, when only taking into account samples with a Ct below 25, the sensitivities sharply increased (95% CI) reaching 95.7% (92.4–98.9), 97.1% (94.4–99.8), and 97.1% (94.4–99.8) for GSD NovaGen, Bio‐Rad, and Aegle, respectively. Table 1 shows the calculated sensitivities according to the Ct value. All antigen tests were negative for samples where at least one RT‐qPCR targeted gene was not detected. The cumulated sensitivities according to Ct values are listed in Figure 1D–F. It appears that below 27, sensitivity drops drastically. In our cohort, the percentage of Ct less than or equal to 27 was 81/150 (54%).
Figure 1.
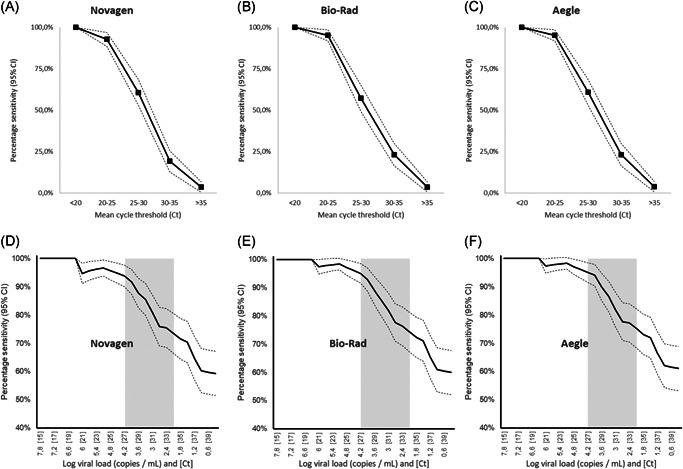
Ct‐observed sensitivity relationship (A)–(C) and cumulated sensitivity according to Ct and viral load (D)–(F) for Novagen, Bio‐Rad, and Aegle, respectively. Gray zone: area of lower performance in contagious patients. Ct, cycle threshold value
Table 1.
Sensitivity of the rapid antigenic Novagen, Bio‐Rad, and Aegle tests across different ranges of RT‐qPCR Ct values
| Overall | Ct < 20 | Ct < 25 | Ct < 30 | Ct < 35 | Ct ≥ 35 | |
|---|---|---|---|---|---|---|
| N | 199 | 28 | 69 | 97 | 123 | 76 |
| Novagen | ||||||
| Sensitivity | 59.3% | 100% | 95.7% | 85.6% | 71.5% | 3.7% |
| 95% CI | 51.5–67.2 | 100–100 | 92.4–98.9 | 79.9–91.2 | 64.3–78.8 | 0.7–6.7 |
| Bio‐Rad | ||||||
| Sensitivity | 60.0% | 100% | 97.1% | 85.6% | 72.4% | 3.7% |
| 95% CI | 52.2–67.8 | 100–100 | 94.4–99.8 | 79.9–91.2 | 65.2–79.5 | 0.7–6.7 |
| Aegle | ||||||
| Sensitivity | 61.1% | 100% | 97.1% | 86.6% | 73.2% | 3.8% |
| 95% CI | 53.3–68.9 | 100–100 | 94.4–99.8 | 81.1–92.0 | 66.4–80.3 | 0.8–6.9 |
Abbreviations: CI, confidence interval; Ct, cycle threshold value; qRT‐PCR, RT‐PCR quantitative reverse‐transcription polymerase chain reaction.
Regarding specificity, seven false‐positive results were found with GSD NovaGen among samples with previously diagnosed viruses. Five were positive to enterovirus/rhinovirus and five were positive either to influenza A, hMPV, or RSV A. Supplemental RT‐qPCRs targeting SARS‐CoV‐2 and common coronaviruses CoV‐229E, CoV‐NL63, and CoV‐OC43 were performed on six out of these seven samples with sufficient volume. Only one sample came positive to CoV‐OC43 with a Ct of 29.58. The specificities (95% CI; Cohen's kappa score) were 85.7% (75.9–95.5; 0.66), 100% (100–100; 0.70), and 100% (100–100; 0.71) for GSD NovaGen, Bio‐Rad, and Aegle, respectively.
4. DISCUSSION
4.1. Antigen test evaluation
Rapid antigen tests have fluctuating performance. 1 , 2 , 3 , 4 , 5 , 6 , 7 , 8 , 9 , 10 Sometimes sizeable differences in sensitivity are observed between what is announced by the manufacturers and what is observed in practice. In previous studies, our team and other authors have shown that performance may even be totally inadequate for routine use in a real‐life setting. 9 , 12 Since then, massive efforts to develop new and better performing rapid antigen tests have been deployed. Hundreds of tests similar to the GSD NovaGen, Bio‐Rad, and Aegle tests are currently referenced. 13 Based on the last WHO recommendations, 14 the assessment of these tests must take into account various aspects including real‐life settings (ideally working on fresh samples and considering prevalence at that time). Moreover, the clinical sensitivity obtained should be interpreted according to the Ct value distribution. Indeed, the patients for whom these tests are most likely to show good performance are those with a high viral burden (Ct values ≤ 25). This is often the case in the presymptomatic phase (1–3 days before the onset of symptoms) and in the early symptomatic phase (during the first 5–7 days of illness). 15 , 16 , 17 It was therefore crucial not to focus only on overall performance but also consider the viral load distribution of the samples tested, approximated by the number of cycles corresponding to the positivity of RT‐qPCR. In addition, the contagiousness seems to sharply decrease beyond 33 cycles and it is, therefore, necessary to validate the results by requiring a good sensitivity below 33 cycles. 18 However, taking into account the high variability of the Ct value associated with the infectivity threshold described in the literature, 1 it is important that clinical biology laboratories calibrate themselves the Ct values obtained with the molecular biology technique of their choice according to a referenced viral burden. In a previous internal evaluation (data not published), we estimated the threshold Ct value of 34 from which we observe a drop in the viral burden associated with. Nevertheless, clinical extrapolations from Ct values remain hazardous and CDC recently declared that Ct values cannot be used to assess when a person is no longer infectious. 19
To mimic the real‐life setting and to obtain a representative range of samples with different Ct, this study was deliberately prospective for positive samples. Samples intended to calculate sensitivity were selected from the samples diagnosed positive in RT‐qPCR and were tested within 24 h with antigen rapid tests. No selection was then made among the positives, so the diversity of Ct observed during the evaluation naturally reflected our routine Ct distribution. In fact, given the low prevalence in our hospital at the time of the study (6.2%), we would have obtained too many PCR‐negative samples using consecutive patients and therefore less accuracy in the comparison between the Ct and the antigen test results.
One limitation of our study is that rapid antigen testing was not performed directly on a bedside nasopharyngeal smear as expected in the instructions for use of each assay because two additional nasopharyngeal samplings would have been required for each patient. Instead, the swabs from the different kits were incubated in the viral transport medium previously analyzed in RT‐qPCR. We cannot exclude the fact that some dilution by the transport medium did happen to result in a systematic underestimation of the sensitivities we calculated.
As our RT‐qPCR detects four targets with three fluorochromes and therefore provides three potential Ct values for each reaction, we selected the average Ct of the positive targets as reference. We chose to do so as no significant difference between the single target Ct was observed. Also, when the detection of 1 or 2 targets failed, the available Ct was always very high, pleading for a low viral load.
The specificity study was conducted by testing frozen samples positive for other respiratory viruses and collected before the SARS‐CoV‐2 discovery. This allowed us to assess at the same time potential cross‐reactions. Low circulation of other respiratory viruses, thanks to anti‐COVID‐19 measures, prevented us from collecting fresh samples. The three antigenic kits we evaluated are manual ones, allowing ubiquitous use. They do not require any instrument or reader. As a result, each test was read by two operators in parallel to standardize the reading at best. The slightest test line, however, weak it was, was interpreted as positive. The tests were read under the best possible conditions in a clinical biology laboratory. However, the quality of reading may be lower in the context of a medical practice or emergency room where light conditions might not be optimal.
Some more automated antigen tests, allow to achieve better performance but can only be used within a laboratory. 1 , 2 These kits are therefore not intended for the same use.
4.2. Positioning of antigen testing in clinical practice
The main advantage of antigen testing is the ability to diagnose early and stop transmission quickly through targeted isolation and clustering of the most infectious cases and their close contacts. Nevertheless, the rapid kits tested in this study are inadequate for routine testing in a high throughput setting. Indeed, if the handling is fast and the result appears within 15 min, performing more than 6 tests at a time makes it difficult to respect the incubation times. Although rapid antigen tests are designed for use at the bedside, their use outside the laboratory environment raises biosecurity questions. Indeed, while all our manipulations were carried out under a laminar flow hood in an L2 + category room, this does not mimic the intended use of such tests. The taking and carrying out of the test in an unprotected environment entails non‐negligible risks of contamination of the people present, the equipment, and the premises.
Finally, the general recommendations for the use of rapid antigen tests for SARS‐CoV‐2 issued by the WHO provide for use when standard RT‐PCR techniques are not available or if the clinical utility of screening would be compromised by too long delays in obtaining results. 14
5. CONCLUSION
This study is the first to report the external validation of three antigen kits (GSD NovaGen, Bio‐Rad, and Aegle). The observed clinical sensitivities were satisfactory only for Ct < 25 with values of 95.7%, 97.1%, and 97.1%, respectively. Only Bio‐Rad and Aegle tests reached 100% specificity in this assessment. Given the high risk of false negatives especially for samples with Ct > 25, rapid antigen testing should be performed with caution and under close scrutiny.
CONFLICT OF INTERESTS
The authors have no relevant competing interest to disclose in relation to this study.
AUTHOR CONTRIBUTIONS
Conceptualization and Writing: Laurent Blairon and Marie Tré‐Hardy. Immunochromatographic Analyses: Laurent Blairon, Marie Tré‐Hardy, and Roberto Cupaiolo. Molecular Analyses: Isabelle Thomas and Sébastien Piteüs. Statistics: Laurent Blairon. Review: Laurent Blairon, Marie Tré‐Hardy, Roberto Cupaiolo, Alain Wilmet, and Ingrid Beukinga.
ETHICS STATEMENT
All the procedures were in accordance with the 1964 Helsinki Declaration and its later amendments.
INFORMED CONSENT
According to French Health Public Law (CSP Article L1121‐1), this type of study did not require specific informed consent or ethics committee approval.
ACKNOWLEDGMENTS
The authors thank all the members of the clinical laboratory staff for technical assistance. Ag Rapid Test Cassette (Bio‐Rad), the GSD NovaGen SARS‐CoV‐2 (COVID‐19) Antigen Rapid Test (NovaTec Immunodoagnostica GmbH), and the Aegle Coronavirus Ag Rapid Test Cassette (LumiraDx) were provided at no cost by the companies. The three companies had no role in study design, data collection, and analysis, decision to publish, or manuscript preparation.
Blairon L, Cupaiolo R, Thomas I, et al. Efficacy comparison of three rapid antigen tests for SARS‐CoV‐2 and how viral load impact their performance. J Med Virol. 2021;93:5783‐5788. 10.1002/jmv.27108
REFERENCES
- 1. Favresse J, Gillot C, Oliveira M, et al. Head‐to‐head comparison of rapid and automated antigen detection tests for the diagnosis of SARS‐CoV‐2 infection. J Clin Med. 2021;10(2):265. 10.3390/jcm10020265 [DOI] [PMC free article] [PubMed] [Google Scholar]
- 2. Pollock NR, Savage TJ, Wardell H, et al. Correlation of SARS‐CoV‐2 nucleocapsid antigen and RNA concentrations in nasopharyngeal samples from children and adults using an ultrasensitive and quantitative antigen assay. J Clin Microbiol. 2021;59(4):e03077‐20. 10.1128/JCM.03077-20 [DOI] [PMC free article] [PubMed] [Google Scholar]
- 3. Porte L, Legarraga P, Vollrath V, et al. Evaluation of a novel antigen‐based rapid detection test for the diagnosis of SARS‐CoV‐2 in respiratory samples. Int J Infect Dis. 2020;99:328‐333. 10.1016/j.ijid.2020.05.098 [DOI] [PMC free article] [PubMed] [Google Scholar]
- 4. Diao B, Wen K, Chen J, et al. Diagnosis of acute respiratory syndrome coronavirus 2 infection by detection of nucleocapsid protein [published online ahead of print March 13, 2020]. Epidemiology. 2020. 10.1101/2020.03.07.20032524 [DOI] [Google Scholar]
- 5. Lambert‐Niclot S, Cuffel A, Le Pape S, et al. Evaluation of a rapid diagnostic assay for detection of SARS‐CoV‐2 antigen in nasopharyngeal swabs. J Clin Microbiol. 2020;58(8):e00977‐20. 10.1128/JCM.00977-20 [DOI] [PMC free article] [PubMed] [Google Scholar]
- 6. Mak GC, Cheng PK, Lau SS, et al. Evaluation of rapid antigen test for detection of SARS‐CoV‐2 virus. J Clin Virol. 2020;129:104500. 10.1016/j.jcv.2020.104500 [DOI] [PMC free article] [PubMed] [Google Scholar]
- 7. Nagura‐Ikeda M, Imai K, Tabata S, et al. Clinical evaluation of self‐collected saliva by quantitative reverse transcription‐PCR (RT‐qPCR), direct RT‐qPCR, reverse transcription‐loop‐mediated isothermal amplification, and a rapid antigen test to diagnose COVID‐19. J Clin Microbiol. 2020;58(9):e01438‐20. 10.1128/JCM.01438-20 [DOI] [PMC free article] [PubMed] [Google Scholar]
- 8. Takeda Y, Mori M, Omi K. SARS‐CoV‐2 QRT‐PCR Ct value distribution in Japan and possible utility of rapid antigen testing kit [published online ahead of print June 19, 2020]. MedRxiv. 2020. 10.1101/2020.06.16.20131243 [DOI] [Google Scholar]
- 9. Scohy A, Anantharajah A, Bodéus M, Kabamba‐Mukadi B, Verroken A, Rodriguez‐Villalobos H. Low performance of rapid antigen detection test as frontline testing for COVID‐19 diagnosis. J Clin Virol. 2020;129:104455. 10.1016/j.jcv.2020.104455 [DOI] [PMC free article] [PubMed] [Google Scholar]
- 10. Weitzel T, Legarraga P, Iruretagoyena M, et al. Head‐to‐head comparison of four antigen‐based rapid detection tests for the diagnosis of SARS‐CoV‐2 in respiratory samples [published online ahead of print June 19, 2020]. Microbiology. 2020. 10.1101/2020.05.27.119255 [DOI] [Google Scholar]
- 11. Watson PF, Petrie A. Method agreement analysis: a review of correct methodology. Theriogenology. 2010;73(9):1167‐1179. 10.1016/j.theriogenology.2010.01.003 [DOI] [PubMed] [Google Scholar]
- 12. Blairon L, Wilmet A, Beukinga I, Tré‐Hardy M. Implementation of rapid SARS‐CoV‐2 antigenic testing in a laboratory without access to molecular methods: experiences of a general hospital. J Clin Virol. 2020;129:104472. 10.1016/j.jcv.2020.104472 [DOI] [PMC free article] [PubMed] [Google Scholar]
- 13. FindDx.org. SARS‐CoV‐2 Diagnostic Pipeline . FindDx. Published 2020. Accessed June 7, 2020. https://www.finddx.org/covid-19/pipeline/?avance=Commercialized%26type=all%26test_target=all%26status=CE-IVD%26section=immunoassays%26action=default#diag_tab
- 14. World Health Organisation . Antigen‐detection in the diagnosis of SARS‐CoV‐2 infection using rapid immunoassays: interim guidance. [Published online September 11, 2020]. Accessed March 9, 2021. https://apps.who.int/iris/handle/10665/334253
- 15. Weiss A, Jellingsø M, Sommer MOA. Spatial and temporal dynamics of SARS‐CoV‐2 in COVID‐19 patients: a systematic review and meta‐analysis. EBioMedicine. 2020;58:102916. 10.1016/j.ebiom.2020.102916 [DOI] [PMC free article] [PubMed] [Google Scholar]
- 16. Dinnes J, Deeks JJ, Adriano A, et al. Rapid, point‐of‐care antigen and molecular‐based tests for diagnosis of SARS‐CoV‐2 infection. Cochrane Database Syst Rev. 2020;8:CD013705. 10.1002/14651858.CD013705 [DOI] [PMC free article] [PubMed] [Google Scholar]
- 17. Arons MM, Hatfield KM, Reddy SC, et al. Presymptomatic SARS‐CoV‐2 infections and transmission in a skilled nursing facility. N Engl J Med. 2020;382(22):2081‐2090. 10.1056/NEJMoa2008457 [DOI] [PMC free article] [PubMed] [Google Scholar]
- 18. La Scola B, Le Bideau M, Andreani J, et al. Viral RNA load as determined by cell culture as a management tool for discharge of SARS‐CoV‐2 patients from infectious disease wards. Eur J Clin Microbiol Infect Dis. 2020;39(6):1059‐1061. 10.1007/s10096-020-03913-9 [DOI] [PMC free article] [PubMed] [Google Scholar]
- 19. Centers for Disease Control . Frequently Asked Questions: section on testing, isolation, and quarantine for persons who have recovered from previous SARS‐CoV‐2 infection. Accessed April 24, 2021. https://www.cdc.gov/coronavirus/2019-ncov/hcp/faq.html#Infection-Control