Abstract
In this observational study, 13 patients with severe COVID‐19 and 10 healthy controls were enrolled. The data concerning the analysis of circulating T cells show that, in severe COVID‐19 patients, the expansion of these cell compartments is prone to induce antibody response, inflammation (CCR4+ and CCR6+ TFH) and regulation (CD8+ Treg). This pathogenic mechanism could lead us to envision a possible new form of biological target therapy.
Keywords: adaptive immunity, COVID‐19, SARS‐CoV‐2, T lymphocytes
Highlights
In patients with severe COVID‐19 we found a relative expansion of T‐cell subsets (Th2‐ and Th17‐ oriented TFH and CD8+ Treg) with a relative reduction of Th1 cells, which are those associated with eradication of a viral infection. This pathogenic mechanism could lead us to envision a possible new form of biological target therapy.
1. INTRODUCTION
The coronavirus disease 19 (COVID‐19) caused by SARS‐CoV‐2 is determining a severe pandemic, indicating that immunity induced by other coronaviruses commonly circulating in the population1, 2 does not cover and protect a great part of the world population. The SARS‐CoV‐2 infection can lead to different clinical pictures (from asymptomatic/pauci‐symptomatic infection to moderate/severe forms of the disease), suggesting that the clinical picture of the infection might strictly depend on the outcome of the SARS‐CoV‐2‐immune system interaction in the patient. 3 Therefore, it is conceivable that patients with the worst forms of disease could have an immunological imbalance due to hampered virus eradication and overwhelming inflammatory response. 4
To investigate the immunological dynamics in SARS‐CoV‐2‐infected patients with severe disease, 5 we performed a study on peripheral T lymphocytes from patients with severe COVID‐19 in comparison to T cells from healthy controls.
2. MATERIALS AND METHODS
This was a descriptive observational study. Consecutive patients with severe COVID‐19 aged 18 years or over, admitted from March 5, 2020, at the Division of Infectious Diseases and at the Internal Medicine and Clinical Immunology Unit of the Policlinic San Martino Hospital in Genoa were enrolled in the present study. Confirmed infection was defined as real‐time reverse‐transcriptase polymerase chain reaction (RT‐PCR)‐positive from a nasal and/or throat swab. The study was carried out in compliance with the Helsinki Declaration and approved by the Ethical Committee of the San Martino Hospital in Genoa (N. CER Liguria 114/2020‐ID 10420). All enrolled patients and subjects provided informed consent.
2.1. Immunofluorescence analyses
Immunofluorescence analyses were performed on 100 µl of peripheral and on 1 × 10⁶ cells peripheral blood mononuclear cells (PBMC) purified from heparinized blood samples by centrifugation on Ficoll‐Hypaque gradient incubating with specific fluorochrome‐conjugated monoclonal antibodies (all purchased from BD Biosciences), as indicated in Table S1. To perform FoxP3 staining, the PBMC were incubated with Aqua dead (Molecular Probes, Thermo Fisher Scientific) for 15 min at room temperature to exclude dead cells before proceeding with surface staining. To perform intranuclear staining, the cells were fixed and permeabilized by Transcription Buffer Set (BD Pharmingen) for 30 min in the dark with the fluorochrome‐conjugated anti‐FoxP3. The cells were washed with 1 ml of phosphate‐buffered saline–bovine serum albumin (PBS‐BSA) 0.01% and resuspended in 300 μl of PBS. The samples were analyzed by a BD Fortessa X20 flow cytometer (BD Biosciences) using the BD FACS Diva™ software version 8.0 (BD Biosciences).
As regards the analysis strategy to follow the maturation of the CD4+ and CD8+ T populations, T‐cell differentiation has been delineated using a set of canonical markers, that is, CD45RA, CCR7, CD28, and CD95. 6 Briefly, the differential expression of these markers allows the identification of six subsets in the human peripheral blood: naive (TN), stem cell memory (TSCM), central memory (TCM), transitional memory (TTM), effector memory (TEM), and terminal effector (TTE), as shown in Figure S1. Moreover, to complete the study, we analyzed the activation markers on CD4+ and CD8+ T cells as an expression of CD38+ , DR+, and CD38+DR+.
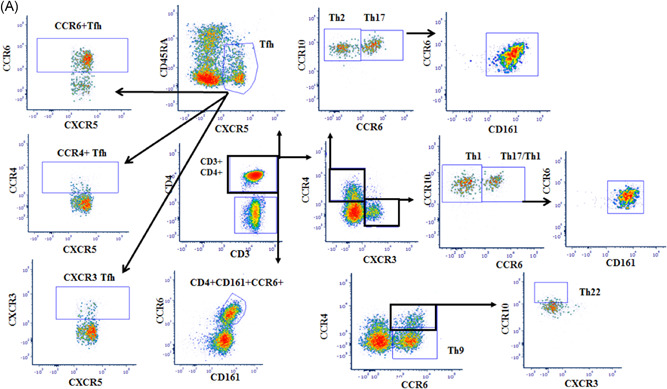
In particular, we considered the following specific phenotypic patterns as markers of T follicular helper (TFH), T helper (Th)1, Th2, Th17, Th1‐17, Th9, and Th22 functional T‐cell subsets, respectively 4 (Figure 1): CD4+CXCR5+CD45RA−: TFH; CD4+ CXCR3+ CCR4−CCR6− CCR10−: Th1; CD4+ CXCR3− CCR4+CCR6−CCR10−: Th2; CD4+ CXCR3− CCR4+CCR6+ CCR10−CD161+ : Th17; CD4+CXCR3+CCR4−CCR6+CD161+: Th17−Th1; CD4+CCR4−CCR6+: Th9; CD4+ CCR4+CCR6+CCR10+: Th22. Moreover, the sum of the Th17 and Th17−Th1 subsets corresponds to the CD161+CCR6+ population on CD4+ T lymphocytes.
Figure 1.

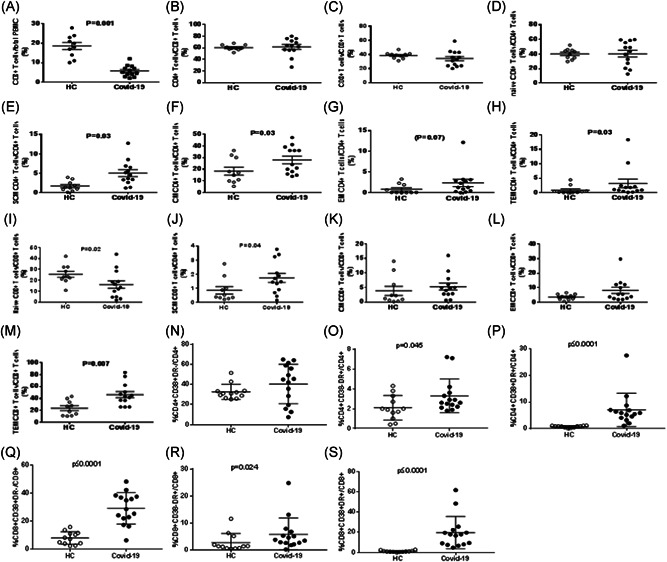
T‐cell maturation and activation in SARS‐CoV‐2‐infected patients with pneumonia. The figure shows the comparative analyses of the frequencies of circulating CD3+ (A), CD4+ (B), CD8+ (C), naïve CD4+ (D), SCM CD4+ (E), CM CD4+ (F), EM CD4+ (G), TEM CD4+ (H), naïve CD8+ (I), SCM CD8+ (J), CM CD8+ (K), EM CD8+ (L), TEM CD8+ (M), CD4+ CD38+ DR− (N), CD4+ CD38− DR+ (O), CD4+ CD38+ DR+ (P), CD8+ CD38+ DR− (Q), CD8+ CD38− DR+ (R), and CD8+ CD38+ DR+ (S) T‐cell subsets between SARS‐CoV‐2‐infected patients and healthy controls (HC)
Core elements to address the analysis strategy of CD4+ and CD8+ Tregs are shown in Figure S2.
2.2. Statistical analyses
The statistically significant differences (p < 0.05) between means of immunological parameters from patients and healthy subjects were analyzed by Mann–Whitney t test for nonparametric values. Calculations were performed by GraphPad Prism v.5 software (GraphPad Software).
3. RESULTS
Peripheral blood was collected from 13 patients affected by severe COVID‐19 (Table S1) and from 10 healthy subjects.
We focused on phenotypic features of cell maturation, activation, and functional commitment. First, we analyzed CD3+, CD4+, and CD8+ T‐cell frequencies in peripheral blood. The frequency of CD3+ T cells was remarkably reduced in patients (Figure 1A), considering the peculiar lymphopenia of these patients. We did not find differences in CD4+ and CD8+ T‐cell frequencies with respect to healthy subjects (Figure 1B,C).
Then, we focused on the maturation stage of both CD4+ and CD8+ T‐cell subpopulations, aiming to get insights into the kinetics of ongoing immune responses in subjects exposed to an acute viral infection. While no differences were observed concerning naïve CD4+ T‐cell frequency between patients and healthy subjects, COVID‐19 patients showed an increased frequency of stem central memory (SCM), central memory (CM), effector memory (EM) (although as a trend), and terminal effector memory (TEM) CD4+ T cells in comparison to controls (Figure 1D‐H).
Analyzing the CD8+ T‐cell compartment, we observed a decrease of naïve and an increase of SCM as well as TEM CD8+ T‐cell subsets in patients (Figure 1I‐M).
Of note, the study of T‐cell activation, through the analysis of expression of activation markers, such as CD38 and DR antigens, showed that both CD4+ and CD8+ T‐cell subsets of SARS‐CoV‐2‐infected patients were highly activated as expressing CD38 and DR antigens at a remarkably higher frequency than those of healthy subjects (Figure 1N‐S).
To further characterize the immune response of these patients, we studied the T‐cell functional commitment. Due to the technical limitations working with biological samples from SARS‐CoV‐2‐infected patients, related to the need to avoid any manipulation process potentially leading to the virus spreading in the environment, we inferred functional information analyzing phenotypical patterns strictly associated with specific functional commitments, as detailed in Table S1. 7
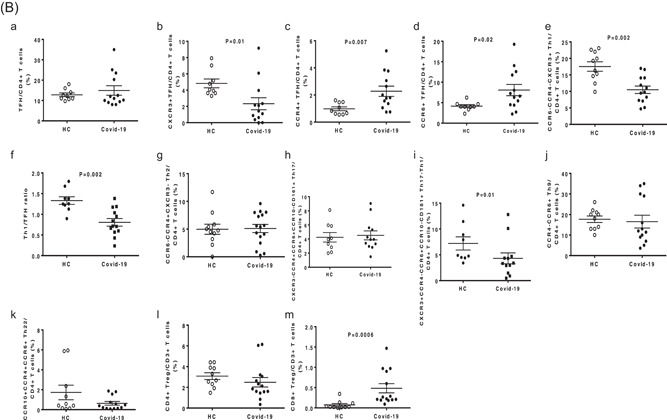
In Figure 2A the analysis strategy of Th subsets in peripheral blood is indicated. Figure 2B,a‐d shows that COVID‐19 patients had comparable TFH frequency in comparison to healthy subjects, but with a different functional commitment of these cells between patients and controls. We observed a reduction of both Th1 and Th17‐1 T‐cell subsets (Figure 2B,e,h).
Figure 2.
(A) Strategy analysis of Th subsets in peripheral blood (Patient G). The figure shows specific phenotypic patterns as markers of T follicular helper (TFH), T helper (Th)1, Th2, Th17, Th1‐17, Th9, and Th22 functional T‐cell subsets. CD4+CXCR5+CD45RA−: TFH; CD4+ CXCR3+ CCR4−CCR6− CCR10−: Th1; CD4+ CXCR3− CCR4+CCR6−CCR10−: Th2; CD4+CXCR3− CCR4+CCR6+ CCR10− CD161+: Th17; CD4+ CXCR3+ CCR4− CCR6+ CD161+: Th17− Th1; CD4+CCR4−CCR6 +: Th9; CD4+ CCR4+CCR6+CCR10+: Th22. (B) T‐cell functional differentiation in SARS‐CoV‐2‐infected patients with pneumonia. The figure shows the comparative analyses of the frequencies of circulating TFH (a), CXCR3+ TFH (b), CCR4+ TFH (c), CCR6+ TFH (d), Th1 (e), Th1/TFH ratio (f), Th2 (g), Th17 (h), Th17− Th1 (i), Th9 (j), Th22 (k), CD4+CD25+FoxP3+ Treg (l), and CD8+CD28−CD127−CD39+ Treg (m) between SARS‐CoV‐2‐infected patients and healthy controls


No significant differences concerning the frequencies of Th2, Th17, Th9, and Th22 T cells were detected between patients and controls (Figure 2B,f,g,i,j).
We also studied the regulatory T cells. In particular, we analyzed the circulating frequencies of CD4+CD25+Foxp3+ and CD8+CD28−CD127loCD39+ regulatory T lymphocyte (Treg) subsets. The interest for the latter one originated from our recent finding of its expansion in the circulation of HIV‐infected patients. 12 The frequency of CD4+CD25+Foxp3+ Treg was comparable in the two groups, while we observed a significantly higher frequency of CD8+CD28−CD127loCD39+ Treg in the circulation of patients (Figure 2B,l‐m).
4. DISCUSSION
Collectively, these data likely indicate that in patients with severe COVID‐19, a recent and robust immune stimulation leading to circulating expansion of activated memory and effector T‐cell subsets in both CD4+ and CD8+ T cell in SARS‐CoV‐2‐infected patients.
In fact, SARS‐CoV‐2‐infected patients had decreased frequency of CXCR3+ Th1‐oriented TFH and increased frequencies of both CCR4+ Th2‐oriented and CCR6+ Th17‐oriented TFH.8, 9 These findings, together with the reduction of Th1 and Th17‐1 T‐cell subsets, 10 suggest that in patients with severe COVID‐19, the SARS‐CoV‐2 infection may impair Th1 responses, which characterize effector immune responses as being able to eradicate viral infections.11, 12, 13, 14 Interestingly, the Th1/TFH ratio was significantly lower in severe COVID‐19 patients than in controls, likely suggesting redirection of CD4+ T‐cell differentiation toward TFH, as occurs in chronic and persistent viral infections.15, 16 Moreover, the expansion of Th2‐ and Th17‐oriented TFH cells typical of autoimmune/inflammatory diseases, suggests an activation of T cells that may favor the development of the antibody response but also the onset inflammatory responses poorly effective in controlling the viral infection. 8
The CD8+CD28−CD127loCD39+ Treg subpopulation have a twofold relevance, 17 it may indicate that in these patients are generated/recruited in the attempt to counteract the overwhelming inflammatory response, and their expansion may hamper virus‐specific effector responses.
This study has some limitations to be addressed. First, a small number of patients with severe COVID‐19 were analyzed; second, the difference of median age from patients and controls group could mislead the difference between the groups.
We found no differences between elderly patients (defined as ≥80 years) and patients <80 years old concerning the immunological parameters analyzed, as reported recently in the literature.18, 19 These results could derive from the small number of patients analyzed and/or from the group of patients enrolled in the study with severe COVID‐19.
Our data show a robust immune response in patients with severe COVID‐19 characterized by relative expansion of T‐cell subsets typical of persistent viral infection and prone to sustain inflammation (Th2‐ and Th17‐oriented TFH) as well as T‐cell subtypes devoted to regulation (CD8+ Treg), and by relative reduction of Th1 cells, which are those associated with eradication of a viral infection. This pathogenic mechanism could lead us to envision a possible new form of biological target therapy.
CONFLICT OF INTERESTS
The authors declare no conflict of interests.
AUTHOR CONTRIBUTORS
All authors contributed to the writing of the manuscript.
Supporting information
Supporting information.
ACKNOWLEDGMENT
The study was supported by a generous donation from Mediolanum Farmaceutici S.p.A.
Fenoglio D, Dentone C, Parodi A, et al. Characterization of T lymphocytes in severe COVID‐19 patients. J Med Virol. 2021;93:5608–5613. 10.1002/jmv.27037
Daniela Fenoglio and Chiara Dentone contributed equally to this study.
DATA AVAILABILITY STATEMENT
The data sets used and/or analyzed during the current study are available from the corresponding author on reasonable request.
REFERENCES
- 1. Yin Y, Wunderink RG. MERS, SARS and other coronaviruses as causes of pneumonia. Respirology. 2018;23(2):130‐137. [DOI] [PMC free article] [PubMed] [Google Scholar]
- 2. Corman VM, Muth D, Niemeyer D, Drosten C. Hosts and sources of endemic human coronaviruses. Adv Virus Res. 2018;100:163‐188. [DOI] [PMC free article] [PubMed] [Google Scholar]
- 3. Mehta P, Mc Auley DF, Brown M, et al. COVID‐19: consider cytokine storm syndromes and immunosuppression. Lancet. 2020;395:1033‐1034. [DOI] [PMC free article] [PubMed] [Google Scholar]
- 4. Siddiqi HK, Mehra MDR. COVID‐19 illness in native and immunosuppressed states: a clinical‐therapeutic staging proposal. J Heart Lung Transplant, 39:405‐407. 10.1016/j.healun.2020.03.012 [DOI] [PMC free article] [PubMed] [Google Scholar]
- 5. World Health Organization . WHO/2019‐nCoV/clinical/2021.1; 2021.
- 6. Mahnke YD, Brodie TM, Sallusto F, Roederer M, Lugli E. The who's who of T‐cell differentiation: human memory T‐cell subsets. Eur J Immunol. 2013;43:2797‐2809. [DOI] [PubMed] [Google Scholar]
- 7. Mahnke YD, Beddall MH, Roederer M. OMIP‐017: human CD4+ helper T‐cell subsets including follicular helper cells. Cytometry A. 2013;83(5):439‐440. [DOI] [PMC free article] [PubMed] [Google Scholar]
- 8. Schmitt N, Bentebibel SE, Ueno H. Phenotype and functions of memory Tfh cells in human blood. Trends Immunol. 2014;35(9):436‐442. [DOI] [PMC free article] [PubMed] [Google Scholar]
- 9. Velu V, Mylvaganam GH, Gangadhara S, et al. Induction of Th1‐biased T follicular helper (Tfh) cells in lymphoid tissues during chronic Simian immunodeficiency virus infection defines functionally distinct germinal center Tfh cells. J Immunol. 2016;197(5):1832‐1842. [DOI] [PMC free article] [PubMed] [Google Scholar]
- 10. Maggi L, Santarlasci V, Capone M, et al. Distinctive features of classic and nonclassic (Th17 derived) human Th1 cells. Eur J Immunol. 2012;42(12):3180‐3188. [DOI] [PubMed] [Google Scholar]
- 11. Snell LM, Osokine I, Yamada DH, la Fuente JRD, Elsaesser HJ, Brooks DG. Overcoming CD4 Th1 cell fate restrictions to sustain antiviral CD8 T cells and control persistent virus infection. Cell Rep. 2016;16(12):3286‐3296. [DOI] [PMC free article] [PubMed] [Google Scholar]
- 12. Cunha LL, Perazzio SF, Azzi J, Cravedi P, Riella LV. Remodeling of the immune response with aging: immunosenescence and its potential impact on COVID‐19 immune response. Front Immunol. 2020;11:1748. [DOI] [PMC free article] [PubMed] [Google Scholar]
- 13. Mathew D, Giles JR, Baxter AE, et al. Deep immune profiling of COVID‐19 patients reveals distinct immunotypes with therapeutic implications. Science. 2020;369(6508):eabc8511. [DOI] [PMC free article] [PubMed] [Google Scholar]
- 14. Kuri‐Cervantes L, Pampena MB, Meng W, et al. Comprehensive mapping of immune perturbations associated with severe COVID‐19. Sci Immunol. 2020. 5(49):eabd7114. [DOI] [PMC free article] [PubMed] [Google Scholar]
- 15. Fahey LM, Wilson EB, Elsaesser H, Fistonich CD, McGavern DB, Brooks DG. Viral persistence redirects CD4 T cell differentiation toward T follicular helper cells. J Exp Med. 2011;208(5):987‐999. [DOI] [PMC free article] [PubMed] [Google Scholar]
- 16. Jesenak M, Brndiarova M, Urbancikova I, et al. Immune parameters and COVID‐19 infection—associations with clinical severity and disease prognosis. Front Cell Infect Microbiol. 2020;10:364. [DOI] [PMC free article] [PubMed] [Google Scholar]
- 17. Fenoglio D, Dentone C, Signori A, et al. CD8+CD28‐CD127loCD39+ regulatory T‐cell expansion: a new possible pathogenic mechanism for HIV infection? J Allergy Clin Immunol. 2018;141(6):2220‐2233. [DOI] [PubMed] [Google Scholar]
- 18. Hezeldine J, Lord JM. Immunesenescence: a predisposing risk factor for the development of COVID‐19? Front Immunol. 2020;11:573662. 10.3389/fimmu.2020.573662 [DOI] [PMC free article] [PubMed] [Google Scholar]
- 19. Westmeier J, Paniskaki K, Karaköse Z, et al. Impaired cytotoxic CD8+ T cell response in elderly COVID‐19 patients. mBio. 2020;11(5):e02243‐20. 10.1128/mBio.02243-20 [DOI] [PMC free article] [PubMed] [Google Scholar]
Associated Data
This section collects any data citations, data availability statements, or supplementary materials included in this article.
Supplementary Materials
Supporting information.
Data Availability Statement
The data sets used and/or analyzed during the current study are available from the corresponding author on reasonable request.


