Abstract
Objective
This article investigates the impact of public reactions to the Covid‐19 panemic on voting for former President Donald Trump in the 2020 American presidential election.
Methods
The impact of the pandemic on voting is assessed by multivariate statistical analyses of representative national survey data gathered before and after the 2020 presidential election.
Results
Analyses show that voters reacted very negatively to Trump's handling of the pandemic. Controlling for several other relevant factors, these reactions affected voting for Trump and exerted a significant impact on the election outcome.
Conclusion
Before the onset of Covid‐19 Trump had a very narrow path to victory in 2020, and the pandemic did much to ensure his defeat.
On Friday, October 2, President Donald Trump tested positive for the novel Corona virus. At the time of the president's diagnosis, over 7 million Americans had contracted the disease and over 200,000 had died from it.1 In addition to its horrific impact on public health, the raging pandemic and attempts to combat it had inflicted damaging economic and psychological effects on millions of Americans. Although the president was fortunate to recover quickly from the disease, he was not so lucky regarding its political effects. Covid‐19 was the preeminent issue on many voters' minds in the autumn of 2020, and analyses of national survey data indicate that their concerns about the pandemic eroded Trump's already problematic re‐election chances. Operating in a context of deep partisan and ideological polarization, inflamed racial tensions, and widespread civil unrest, voters' perceptions of the president's efforts to combat the pandemic were highly negative and electorally consequential.
In this article, we employ data from a nationally representative two‐wave pre‐ and postelection survey to study how people's reactions to Covid‐19 and other salient issues affected the choices they made in the 2020 presidential election. Controlling for a variety of important factors such as partisanship, ideology, and racial attitudes, analyses of a two‐group finite mixture model reveal that the impact of the Covid‐19 issue on the likelihood of voting for Trump differed significantly across sub‐groups of the electorate. We begin by discussing the context of the presidential election and the dramatic changes therein brought about by the pandemic in the early months of 2020. After presenting data on the emphasis people placed on Covid‐19 and other issues, we conduct multivariate analyses of factors shaping voting behavior. The conclusion summarizes major findings and considers their implications for understanding how the multifaceted impact of the pandemic worked to oust Donald Trump from the White House.
The 2020 Election Context
The 2020 presidential election was never going to be easy for Donald Trump. Four years earlier, he had lost the popular vote to Hillary Clinton by nearly 3 million votes, and his Electoral College majority rested on unexpected, razor‐thin margins (averaging 0.57 percent) in three traditionally Democratic “blue wall” states, Michigan, Pennsylvania, and Wisconsin. After Trump became president, polls repeatedly documented that he was heartily disliked by a large swath of the electorate. Figure 1, which shows trends in his approval ratings from his inauguration on January 20, 2017 until the day before the 2020 election, documents that his initial job approval rating was only 46 percent—a very mediocre number for a new president. Thereafter, although individual polls varied, the trend in his ratings traversed a quite narrow range (from 38 to 47 percent) and never exceeded 50 percent. Trump's overall average was only 42.9 percent. On January 30, the day the World Health Organization designated Covid‐19 as a worldwide health emergency, his approval rating was 44.6 percent on trend. With numbers like these, the 2020 election campaign was bound to be an uphill battle for the president, even if the massive shocks to American's economy and society occasioned by the pandemic had not occurred.2 Assembling another Electoral College majority despite losing the popular vote as he had in 2016 would likely be the only realistic possibility.
FIGURE 1.
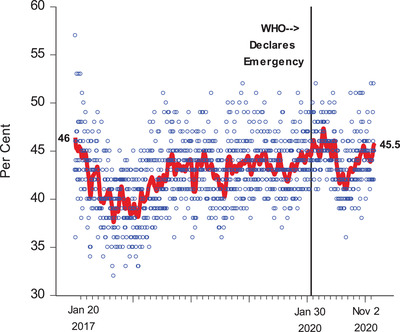
The Dynamics of Trump's Presidential Approval Ratings, January 20, 2017–November 2, 2020
Source: Real Clear Politics Presidential Approval Poll Archive
Going into the 2020 election Trump was relying heavily on a traditional political recipe of “peace and prosperity” to make his case for re‐election. The economy was the lynchpin of this strategy. During Trump's term in office, corporate taxes had been reduced, the stock market had soared to record highs, and unemployment had continued the downward trend established in the Obama years. In December 2019, shortly before the pandemic struck, the unemployment rate had fallen to 3.9 percent.3 Among women, it was even lower, only 3.2 percent. Unemployment among minorities had declined as well, with only 5.9 percent of African Americans and 4.2 percent of Hispanics in the job seeker queues. Peace also had broken out across much of the globe. The ISIS caliphate had been largely eliminated, troop reductions were occurring or had been planned for Afghanistan, Iraq, and Syria; although Trump had engaged in an abundance of bellicose rhetoric with North Korea and Iran, wars had not occurred. Peace accords between Israel and Mideast states including the United Arab Emirates and Bahrain were in the works and would be announced in the run‐up to the election.
Covid‐19 overturned the president's strategy. In addition to the mounting death toll caused by the virus, government efforts to combat the pandemic with lockdowns that closed restaurants, retail businesses, schools, sporting events, and many other public gatherings and severely curtailed travel combined to crash the American economy. The negative effects were swift and profound. As Figure 2 shows, unemployment soared to 14.7 percent in April 2020, a much higher figure than at any point during the “Great Recession” of a decade earlier. Although joblessness subsequently declined, when voters went to the polls on November 3, unemployment remained nearly twice as high as it had been before the pandemic began. As usual in economic downturns, lower income groups and ethnic/racial minorities were especially hard hit.
FIGURE 2.
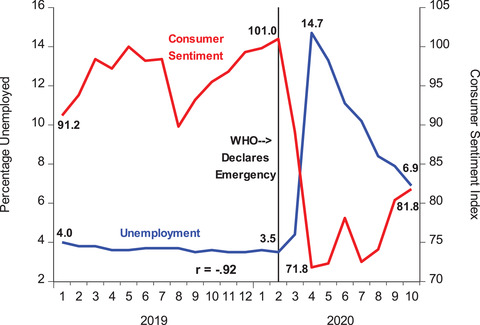
Unemployment Rate and Consumer Sentiment Index, January 2019–October 2020
Source: Surveys of Consumers University of Michigan and Federal Reserve Bank of St. Louis Database
The consequences for consumer confidence, a prime motivator of economic activity, were predictable. As Figure 2 illustrates, the University of Michigan's Index of Consumer Sentiment4 fell from 101.0 points in February 2020 to only 71.8 points in April. This was by far the lowest figure recorded during the Trump presidency. Thereafter, optimism about the economy remained in short supply. By October 2020, the Consumer Sentiment Index had revived, but only to a weak 81.8 points. Although when he was on the campaign trail Trump repeatedly invited voters to recall the prosperity he had overseen in pre‐Covid America, it proved to be a hard sell to audiences suffering the multifaceted privations occasioned by the pandemic.
The Issue Agenda and Electoral Choice
The Covid‐19 pandemic is a prime example of what students of electoral politics term a “valence” issue. As the late Donald Stokes observed in a seminal article written over half‐century ago (Stokes, 1963), valence issues are ones upon which there is broad agreement on the goals of public policy and political debate focuses on “how to do it” and “who is best able.” The economy is a canonical valence issue, with overwhelming majorities favoring vigorous, sustainable growth coupled with low rates of unemployment and inflation (see, e.g., Lewis‐Beck, 1988; Duch and Stevenson, 2008). Other prominent examples of valence issues are health care, education, and national and personal security. In recent years, environmental protection has joined this list. Research on the determinants of voting behavior in the United States and other Anglo‐American democracies shows that the economy and other valence issues typically dominate the issue agenda, and voters' judgments about which candidates and parties can best secure the goals associated with these issues typically do much to shape electoral choice (e.g., Clarke, Kornberg, and Scotto, 2009). The physical, economic, and psychological threats Covid‐19 posed to millions of voters quickly established its status as a prime valence issue.
We use data gathered in the 2020 national pre‐election and postelection surveys to study the incidence and impact of the Covid‐19 issue on voting in the 2020 presidential election.5 The pre‐election survey was conducted in the two weeks prior to the election and the postelection survey was fielded immediately afterward. Sample sizes for the two surveys are 2,500 and 2,612, respectively. A panel of 1,959 respondents participated in both waves. The percentages of people supporting Trump and Biden in the panel were very close to the actual result. Specifically, 48.7 percent of those voting for one of the two candidates reported that they chose Trump and 51.3 percent said they opted for Biden. The actual major party vote shares for Trump and Biden were 47.8 percent and 52.2 percent, respectively.6
To measure issue concerns, we presented the survey respondents with a randomized list of 12 issues and asked them to identify what they considered to be the three most important ones. Then, we asked the respondents to designate which of the three issues they believed was most important of all. A follow‐up question asked them to evaluate President Trump's performance on the issue they deemed most important. Figures 3 and 4 summarize key features of responses to these questions.
FIGURE 3.
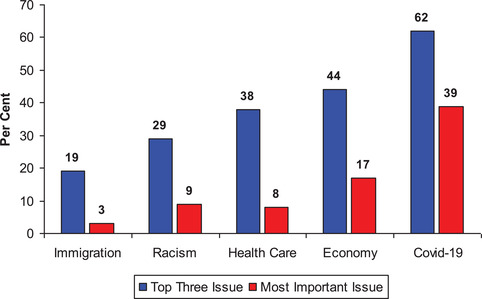
Important Issues Facing the Country, October 2020
Source: Cometrends 2020 Pre‐Election Survey
FIGURE 4.
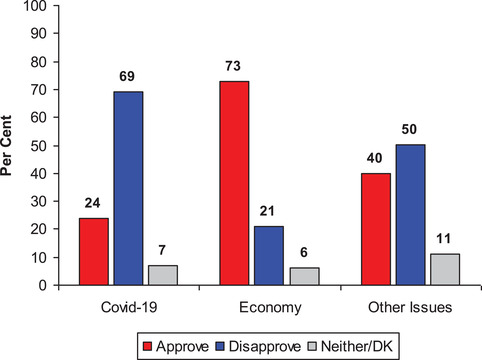
Trump's Job Approval Rating on Most Important Issues Selected by Survey Respondents
Source: Cometrends 2020 Pre‐Election Survey
Figure 3 shows that the five issues most frequently designated as “top three” concerns include Covid‐19, the economy, health care, racism, and immigration. Covid‐19 led the list with slightly over three‐fifths (62 percent) citing it. The economy ranked second with 44 percent mentioning it, and 38 percent, 29 percent, and 18 percent selected health care, racism, and immigration, respectively. For the most important issue of all, Covid and, to a lesser extent, the economy again dominated—39 percent cited the former and 17 percent the latter. No other issue was mentioned as “most important” by as many as one respondent in 10.
Figure 4 displays the survey respondents' evaluations of Trump's job performance on issues they designated as most important. The contrast between Covid‐19 and the economy is stark. Only 24 percent of those citing this issue as most important either “strongly approved” or “approved” of the president's performance, whereas fully 69 percent either “disapproved” or “strongly disapproved.” For the economy, the story is dramatically different; 73 percent approved of Trump's performance and only 21 percent disapproved. Figure 4 also shows that across all other most important issues, the president's ratings were less than stellar, with 40 percent approving and 50 percent disapproving.
Taken together, these job performance evaluations strongly suggest that the insertion of the pandemic as the preeminent issue on the political agenda damaged Trump's electoral prospects. Further evidence on this point is provided by answers to a question that directly asked about his handling of the pandemic. The responses show that only 17 percent believe he had done an “excellent” job and 21 percent thought he had done a “good” job. In contrast, fully 44 percent stated that he had done a “terrible” job and an additional 6 percent replied that he had done a “bad” job. Before the pandemic began Trump could reasonably entertain the prospect of campaigning in a context where “his” issue, the economy, was a dominant concern and judgments about his performance on it were strongly tilted a favorable direction. In early 2020, those assumptions were no longer valid. With the pandemic at the top of the issue agenda and the economy plunged into a deep recession, the terrain on which the election would be fought had changed markedly to his disadvantage. In the following section, we investigate how voters' assessments of Trump's job performance in handling the Covid crisis, the economy, and other important issues influenced the choices they made in 2020.
Modeling the Vote
The data presented above indicate that Covid‐19 dominated the issue agenda and that judgments about President Trump's handling of the pandemic were very negative. To determine if the Covid‐19 issue influenced electoral choice in 2020, we specify a multivariate model that controls for several other potentially important explanatory variables. Some of these variables involve concern with issues such as the state of the economy, the environment, health care, immigration, law and order, and race relations. Others, such as party identification, liberal‐conservative ideological orientations, and judgments about the state of the economy, long have been staples in the voting behavior literature (e.g., Campbell et al., 1960; Lewis‐Beck et al., 2008). Prominent studies of voting the 2016 and other recent presidential elections emphasize that racial attitudes also belong on this list (see, e.g., Abramowitz, 2018; Norris and Inglehart, 2019; Sides, Tessler, and Vavreck, 2018). In addition, given the many widely publicized protests that ensued in the wake of the death of George Floyd, an African‐American man killed by a Minneapolis police officer in May 2020, we employ a predictor measuring voters' perceptions of how police treat racial and ethnic minorities. Sociodemographic variables (age, education, gender, income, minority race‐ethnicity) are also included.7 Since the dependent variable is a dichotomy (vote Trump = 1, vote Biden = 0), we specify a binomial probit model (e.g., Long and Freese, 2014).8
The results of the analysis are summarized in Table 1. Overall, the model performs well—the McKelvey R 2 goodness‐of‐fit statistic is 0.82 (on a 0–1 scale) and fully 90.5 percent of the cases are correctly classified as Trump or Biden voters. Regarding individual predictors, as expected, Republican partisans, ideological conservatives, people offering (relatively) positive economic evaluations, and those ranking higher on the racial resentment scale all were significantly more likely to vote for Trump than were Democrats, ideological liberals, persons providing negative economic assessments, and those with lower levels of racial resentment. Perceptions of police–minority relations behaved as hypothesized—people with more positive views of how the police‐treated minorities were significantly more likely to vote for Trump and those with negative views tended to opt for Biden. All of these relationships aside, the voting model also indicates that four of the issue concern variables including Covid‐19, the economy, law and order, and race relations significantly influenced the likelihood of casting a Trump or a Biden ballot in expected ways.
TABLE 1.
Binomial Probit Analysis of Voting for Trump in 2020 Presidential Election
| Predictor Variable | β | SE | Change inProbability Vote Trump † |
|---|---|---|---|
| Important Issues | |||
| Covid‐19 | ‐0.286 *** | 0.078 | ‐0.07 |
| Economy | 0.271 ** | 0.097 | 0.07 |
| Environment | ‐0.152 | 0.139 | – |
| Health Care | ‐0.020 | 0.101 | – |
| Immigration | 0.088 | 0.136 | – |
| Law & Order | 0.434 *** | 0.135 | 0.12 |
| Race Relations | ‐0.388 *** | 0.125 | ‐0.10 |
| Party Identification | 0.961 *** | 0.081 | 0.37 |
| Liberal‐Conservative | 0.478 *** | 0.083 | 0.15 |
| Economic Evaluations | 0.181 *** | 0.058 | 0.10 |
| Police‐Minority Relations | 0.412 *** | 0.078 | 0.17 |
| Racial Resentment | 0.239 *** | 0.071 | 0.09 |
|
Sociodemographics |
|||
| Age | ‐0.005 | 0.004 | – |
| Education | ‐0.102 | 0.072 | – |
| Gender | ‐0.440 *** | 0.120 | ‐0.05 |
| Income | ‐0.232 ** | 0.094 | ‐0.05 |
| Ethnic/racial minority | ‐0.450 *** | 0.135 | ‐0.05 |
| Constant | −2.285 *** | 0.314 | – |
McKelvey R 2 = 0.82. N = 1535.
Percentage correctly predicted = 90.5.
p ≤ 0.001,
p ≤ 0.01; one‐tailed test.
Change in probability vote Trump when predictor variable is varied across its range with other predictors held at mean values.
The significant negative impact (p < 0.001) of the Covid‐19 issue and the significant positive effect (p < 0.01) of economic issues are particularly interesting in the present context. To gauge the strength of these relationships, we calculate the probability of voting for Trump as concern about the Covid‐19 and economic issues move from not being a top three issue to being the single most important issue. In this scenario, we hold all other predictors at their mean values. The resulting calculations are summarized in Figure 5, which shows that the probability of voting for Trump decreases from 0.53 (on a 0–1 scale) among voters who do not thought the pandemic was an important issue to 0.46 among those who thought it was most important. In a mirror image, the likelihood of casting a Trump ballot increases from 0.46 among people judging the economy was not an important issue to 0.53 among those who believed it was the paramount concern.
FIGURE 5.
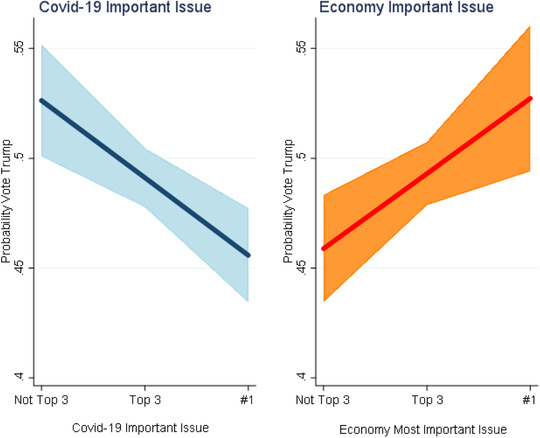
Probability of Voting for Trump by Importance of Covid‐19 and Economic Issues, Binomial Probit Model
Thinking of a “counterfactual world” absent Covid‐19 and the economic devastation it precipitated, these probabilities indicate that Trump's 2020 vote share would have been greater than what he actually received. In turn, given that the 2020 election was very close in several battleground states, this suggests that he might have been able to replicate his 2016 victory by again winning by extremely narrow margins in enough of the closely contested states to gather the requisite 270 electoral votes. The plausibility of such an outcome can be investigated by a more finely grained analysis of the forces driving the choices made by America's highly polarized electorate.
The findings above testify that voters' concerns with the Covid‐19 issue had a significant negative impact on support for Donald Trump, over and above the influence of several other “usual suspects” including partisanship, ideological orientations, economic evaluations, perceived police–minority relations, and racial attitudes. To check if the statistical significance of the Covid issue was an artifact of model specification, we replicated the vote analysis 65,536 times using all combinations of the other predictor variables in the model (see Young and Holsteen, 2017). These analyses testify that the result is robust—in all cases the coefficient for the Covid issue variable is negatively signed and statistical significant (p < 0.05).
These findings are based on analyses that assume that the effects of the Covid‐19 issue and all other predictors are homogeneous across the entire electorate. However, given the deep partisan and ideological divisions that characterize the content of contemporary political discourse generally and campaign rhetoric in particular, it is plausible that the pandemic's impact as a political issue varied significantly across partisan and ideological lines. This conjecture is buttressed by the observation that groups that tend to identify as Democrats and hold left‐of‐center ideological positions include ethnic/racial minorities who have been especially hard hit by the pandemic and government efforts to combat it. To determine if such heterogeneous effects on electoral support were operating, we specify a two‐group finite mixture model that includes the several predictor variables specified in the binomial probit voting model discussed above.
Following McLachlan, Lee, and Rathnayake (2019), a finite mixture model (fmm) may be expressed as:
where π is the probability of j class and 0 < πj < 1.0, z are the variables predicting probability of membership in class j, y is the dependent variable in class 1…j models, xj is the predictor variable for class j model, and
βj are the parameters for predictor variables in class j model, f is the conditional probability density function for observed response in jth class model.
We estimate a two‐group version of this model. In our application, y is voting for Trump or Biden, x is the set of predictor variables employed in the simple one‐group binomial probit model, and z are party identification and liberal‐conservative ideological orientations. These latter two variables are used to predict the probability πj of group membership.9
Model estimates reveal that 42.4 percent of the cases (voters) have the highest probability of being in Group 1 while the remaining 57.6 percent cases have the highest probability of Group 2 membership. Democratic party identifiers and persons with more liberal ideological stances are significantly more likely to be in Group 1, whereas Republicans and more conservative individuals tend to be in Group 2. As hypothesized, the impact of concern with the Covid‐19 issue on voting for Trump or Biden varies across the groups (χ 2 = 7.08, p = 0.008), being significant and negative for Group One and negative but statistically insignificant for Group Two.10
The impact of concern with the Covid‐19 issue on the probability of voting for Trump is illustrated in Figure 6. Here, we consider scenarios where concern with the pandemic varies from “not a top three issue” to “most important.” Again, all other predictor variables are held at their mean values. The results show that for people in Group One, the probability of a Trump vote is 0.28 among those who do not rank Covid‐19 as one of their top three issues. This probability falls to 0.07 among those ranking the pandemic as a second or third most important issue and to 0.00 among those who rank it most important of all issues. The pattern is the same in Group Two, but the decrease is much smaller and statistically insignificant, with the probabilities of voting for Trump declining from 0.62 to 0.59 to 0.56.
FIGURE 6.
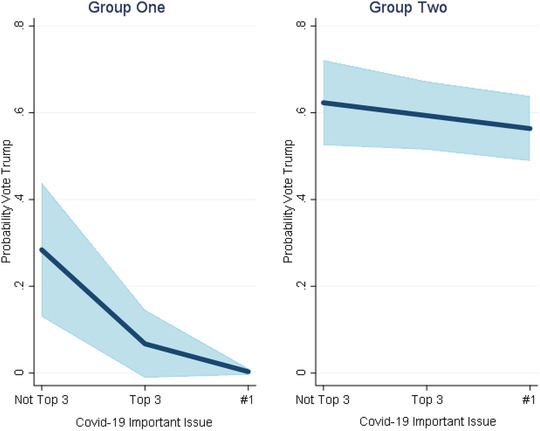
Probability of Voting for Trump by Importance of Covid‐19 Issue, Two‐Group Finite Mixture Model
Taken together, these numbers indicate that, as anticipated, the impact of the Covid‐19 issue was concentrated in a group of voters who, for various other reasons, were unlikely to support Trump. This does not mean that the effect was electorally inconsequential. If Covid‐19 had been absent from the issue concerns of the 42.4 percent of voters estimated to be in Group One, this implies that, ceteris paribus, the likelihood that they would cast a ballot for Trump would be slightly greater than one in four (0.28). If that proportion of Group One people actually did cast their ballots for Trump, his vote share would have increased by 11.9 percentage points.
The strength of this “no Covid issue” effect would be have been magnified if—as Trump hoped—the economy had dominated the issue agenda. Consonant with the results reported above for the simple binomial probit model, the finite mixture estimates indicate that issue concern with the economy had a significant positive impact on the likelihood of voting for Trump. Unlike the Covid‐19 issue, this positive effect was significant (p < 0.01) for voters in both Group One and Group Two, although significantly stronger (χ 2 = 4.58, p = 0.034) for members of Group One. In a nonpandemic world, these findings would have been good news for Trump because, as discussed above, a large majority of those emphasizing economy approved of how he had handled it.
In scenarios where extent of concern about the economy is varied holding other predictors at their mean values, the probability of Group One people voting for Trump increases by 0.18 points for those who rank the economy as the most important issue as compared to those who do not think it is a top three issue (see Figure 7). For Group Two people, the comparable increase is 0.13. These changes in probability indicate that Trump had the potential to increase his vote share by electorally valuable ways in both groups depending on the importance voters accorded the economy as an election issue. Related increases in Trump's support would have been generated by the more positive economic evaluations that likely would have obtained if the enormous job losses and attendant financial hardship precipitated by pandemic had not occurred.
FIGURE 7.
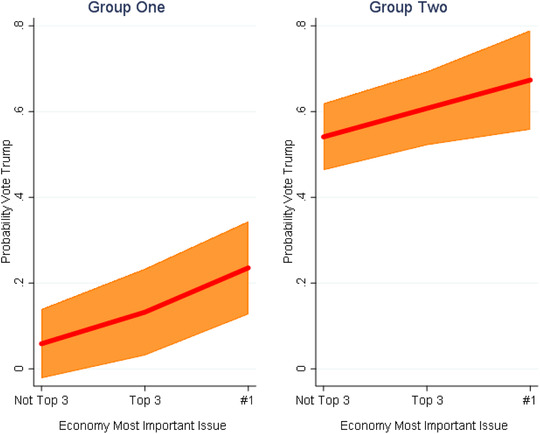
Probability of Voting for Trump by Importance of Economy as Issue, Two‐Group Finite Mixture Model
Finally, the impact of Covid‐19 on Trump's electoral fortunes may have acted in yet another way as well. Turnout in the 2020 presidential election was extraordinary by American standards, with two‐thirds (66.7 percent) of the electorate casting a ballot. The 2020 turnout was up approximately 10 percent from 2016 and it was the highest figure in 120 years. As the pandemic unfolded in the winter and spring of 2020, many states took steps to enable voters to vote early and by mail. Many people took advantage of these opportunities. Although postal voting had been increasingly steadily since the 1990s, it surged from 20.9 percent in 2016 to fully 41.5 percent in 2020.11
Although it is not known if the stricter, pre‐Covid rules for postal voting would have inhibited some of the surge in electoral participation and Biden voting, since 1980 there has a modest, but nontrivial, negative correlation (r = –0.37) between turnout and Republican victories in presidential elections. Over the 120 years since 1900 this correlation is weaker, but still negative (r = –0.27). In the key “blue wall” battleground states of Michigan, Pennsylvania, and Wisconsin, turnout was over 70 percent in 2020, while Biden's margins of victory were very small, averaging 1.5 percent. Turnout also was relatively high in states such as Georgia (67.7 percent) and Arizona (65.5 percent) where Biden won by even slimmer margins—0.24 percent in the former and 0.31 percent in the latter. Given the tendency of higher turnout to favor Democrats, efforts to reduce the health risks associated with showing up physically at the polls by facilitating the option of mail balloting likely contributed to higher turnout, which, in turn, contributed to Trump's losses in hotly contested states he needed to translate a minority popular vote into a 2016‐style majority in Electoral College.12
There is relevant survey data on the point. A Pew Research Foundation survey conducted soon after the election indicates that sizable majority (58 percent) of Biden's ballots was cast by mail, while two‐thirds of Trump's were cast in person.13 Similarly, although the Cometrends postelection survey did not ask respondents if they voted in person or by mail, the 2020 Cooperative Congressional Election Study (CCES) postelection survey14 shows that 67.9 percent of voters who used mail ballots supported Biden. In sharp contrast, 58.3 percent of those voting in‐person supported Trump. In the five closely contested states—Arizona, Georgia, Michigan, Pennsylvania, and Wisconsin—that Trump won in 2016 (average margin of victory 1.7 percent) but lost in 2020 (average margin of defeat 1.1 percent), 70.2 percent of the CCES respondents voting by mail supported Biden, whereas 65.0 percent of those voting in‐person favored Trump. These data document that the former president had good reason to worry about a surge in mail voting.15
Conclusion: Trumped by Covid‐19
President Trump repeatedly emphasized his accomplishments in the economic and foreign policy domains, boasting that markets were at all time highs and unemployment rates among all sectors of society were at record lows. He touted also good news in the international arena—claiming that under his leadership America was finally freeing itself from decades of debilitating foreign conflicts that had drained the country's wealth while imposing heavy human costs. Echoing the “you never had it so good” rhetoric of former British Prime Minister Harold Macmillan, Trump was banking that his “prosperity and peace” message would offset his personal unpopularity across large segments of the electorate.
As 2020 began, Trump's popularity ratings continued to linger in the mid‐40 percent range, suggesting a path to victory across America's highly polarized political landscape would be very narrow, much as it had been in 2016. Then the Covid‐19 pandemic transformed that landscape to Trump's disadvantage. Covid‐19 was the dominant issue on many voters' minds and they judged Trump's performance in combating it very negatively. Although he had implemented “Operation Warp Speed” to produce a vaccine that would quell the virus, that treatment was unavailable when voters cast their ballots and the possibility that it soon might be a reality seemingly did little or nothing to temper negative appraisals of how Trump was handling the issue. Multivariate analyses controlling for several politically influential factors such as partisanship, ideology, and racial attitudes show that concern about the pandemic significantly depressed the likelihood of voting for the president.
Although the effects of the Covid‐19 issue were not the largest ones driving the vote, they were sufficiently strong to be electorally consequential. In a “counterfactual political world” where Covid‐19 was absent and prosperity continued unabated, Trump's vote totals would be been higher, perhaps sufficiently so for him to traverse a narrow path to victory in the Electoral College like he had four years earlier. Even with Covid‐19 a reality, his margins of defeat in several battleground states were very narrow in 2020 and it is not farfetched to imagine that absent Covid and its massive collateral damage he could have been successful in enough of these states to cobble together the needed 270 Electoral College votes.
His prospects for doing so appear higher when the impact of the extraordinarily high turnout (by American standards) associated with the increased use of mail balloting to mitigate the risk of Covid infection is taken into account. As discussed above, turnout and Republican success in presidential elections are negatively correlated. This relationship is modest, but the number of votes Trump needed to prevail in key battlegrounds such as Georgia, Pennsylvania, and Wisconsin was quite small. In the event, he lost these three states by knife‐edged margins (averaging 0.73 percent) and survey evidence presented above indicates postal voters in these locales opted heavily for Biden in 2020. With their Electoral College votes in his column, Trump would still be in the White House.
Based on the results of our statistical analyses, the “no Covid” counterfactual is informative but, ultimately, it remains in the realm of political fiction. In fact, Covid‐19 was an omnipresent, if unexpected, reality in 2020, and it made Trump's already difficult task of securing re‐election significantly harder. As he contemplates his political fate, the former president might recall another of British Prime Minister Macmillan's famous aphorisms. When asked by a reporter about what could harm his government's fortunes Macmillan insightfully replied “Events, dear boy, events.” Covid‐19's impact on the 2020 presidential election illustrates this important point.
Variables—Measurement
Age—Age in years.
Economic Evaluations—A factor score variable based on responses to six questions: (a) “Thinking about economic conditions, how does the financial situation of your household now compare with what it was 12 months ago? Has it?…” (b) “Would you say that over the past year, the nation's economy has?…” (c) “'Thinking ahead, how do you think the financial situation of your household will change over the next 12 months? Will it?…” Response categories to (a)–(c) are scored: “much better” = 5, “better” = 4, “stay about the same,” “don't know” = 3, “worse” = 2, “much worse” = 1. Two additional questions ask respondents to choose four words from a list of eight words (four and four negative) describing their feelings about (e) national economic conditions and (f) their personal financial situation. A variable measuring emotional reactions to the economy is generated by subtracting the number of negative words from the number of positive words.
Education—A three‐category ordinal variable ranging from “no high school” = 1 to “university post‐graduate” = 3.
Gender—A 0–1 dummy variable scored women = 0, men = 1.
Income—A 3‐category ordinal‐scale variable: less than $64,000 = 1, $64,001–$149,999 = 2, $150,000 and over = 3.
Liberal‐Conservative Ideological Self‐Placement—A three‐category ordinal variable scored: liberal = 1, moderate = 2, conservative = 3.
Most Important Issues—Respondents were shown a list of 12 issues and asked to select the three they considered most important. Next, they were asked to select the one issue they considered the most important of all. Responses to these two questions were used to construct ordinal‐scale variables scored 0 = issue not ranked as top‐three issue, 1 = issue ranked as third or second most important issue, 2 = issue ranked as most important. Issues include Covid‐19 pandemic, economy (including economy generally and unemployment), environment, health care, law and order, race relations.
Minority Race/Ethnicity—A dummy variable scored: White = 0, Minority (African American, Hispanic, Asian, Other) = 1.
Party identification—A three‐category ordinal‐scale variable based on responses to the question: “Generally speaking, do you usually think of yourself as a Republican, a Democrat, an Independent or what?” Democrats are scored 1, Independents and minor party identifiers are scored 2, and Republicans are scored 3.
Police–Minority Community Relations: A factor‐score variable based on responses to the following four questions: (a) “In most cases, the police treat minorities with courtesy and respect.” (b) “The police often use excessive force when dealing with minorities.” (c) “Generally speaking minority communities have good relations with the police.” (d) “Many police officers racially profile minorities.” Response categories for items (a) and (c) are: “Strongly agree = 1,” “Agree = 2,” “Neither agree nor disagree/Don't know = 3,” “Disagree = 4,” “Strongly disagree = 5.” Scoring of responses to items (b) and (d) is reversed.
Racial Resentment—A factor‐score variable based responses to the following four questions: (a) “Generations of slavery and discrimination have created conditions that make it difficult for African Americans to work their way out of the lower class.” (b) “Many other minority groups have overcome prejudice and worked their way up. African Americans should do the same without any special favors.” (c) “Over the past few years, African Americans have gotten less than they deserve.” (d) “It's really a matter of some people not trying hard enough; if African Americans would only try harder they could be just as well off as whites.” Responses to items (b) and (d) are scored “strongly agree” = 5, “agree” = 4, “neither agree nor disagree,” “don't know” = 3, “disagree” = 2, “strongly disagree” = 1. Scoring of responses to items (a) and (c) is reversed.
Voting in 2020 Presidential Election—A dummy variable scored vote Biden = 0, vote Trump = 1. Minor party voters and nonvoters are treated as missing data.
Footnotes
https://covid.cdc.gov/covid‐data‐tracker/#trends_totalandratedeaths.
Echoing Trump's mediocre poll numbers, a number of widely cited forecasters produced analyses indicating that there was a high probability that Biden would win (see, e.g., Abramowitz 2021; Heidemann, Gelman, and Morris 2020; Silver 2020).
Unemployment data are available at the Federal Reserve Bank of St. Louis data base: https://fred.stlouisfed.org.
The Consumer Sentiment time series data are available at: data.sca.isr.umich.edu.
Fieldwork for the Cometrends 2020 election surveys was conducted by Qualtrics.
The questionnaires and survey data are available at cometrends.utdallas.edu. The dataset also will be made available on the Harvard Dataverse.
https://en.wikipedia.org/wiki/2020_United_States_presidential_election.
Details concerning the measurement of the variables used in the voting model are presented in the Appendix.
Model parameters are estimated using Stata 15.
The finite mixture model parameters are estimated using Stata 15's FMM procedure.
The Akaike Information Criterion (AIC) model selection statistic equals 686.76 for the finite mixture model and 693.26 for the single group binomial probit model. Smaller values of the AIC indicate better model fit (see, e.g., Burnham and Anderson 2011).
Data on mail balloting from 1996 to 2016 are presented by Pew Research in: https://www.pewresearch.org/fact‐tank/2020/06/24/as‐states‐move‐to‐expand‐the‐practice‐relatively‐few‐americans‐have‐voted‐by‐mail/.
Unlike most other forecasts, Helmut Norpoth's "Primary Model" did not use poll data and predicted a Trump victory in 2020 (Norpoth, 2021). In a post‐mortem on the model's failure, Norpoth concluded it is likely that Biden's victory "owes much to the surge of mail‐in voting" that followed from the relaxation of vote‐by‐mail regulations. See https://primarymodel.com.
https://www.pewresearch.org/politics/2020/11/20/the‐voting‐experience‐in‐2020/.
Fieldwork for the 2020 CCES was conduced by YouGov and the sample size for the post‐election wave is N = 51,551 (see cces.gov.harvard.edu).
Both before and after the 2020 election, Trump charged that postal voting increased the possibilities of fraud (see, e.g., https://www.vox.com/2020/9/30/21494840/2020‐debate‐fact‐check‐trump‐vote‐by‐mail‐fraud). After his defeat, Trump launched legal challenges of results in several states, some of which involved the administration of postal ballots. None of these challenges resulted in the overturn of a state's reported election results.
REFERENCES
- Abramowitz, Alan I. 2018. The Great Alignment: Race Party Transformation and the Rise of Donald Trump. New Haven, CT: Yale University Press. [Google Scholar]
- ———. 2021. “It's the Pandemic, Stupid: A Simplified Model for Forecasting the 2020 Presidential Election.” PS: Political Science & Politics 54:52–54. [Google Scholar]
- Burnham, Kenneth P. , and Anderson David R.. 2011. Model Selection and Multimodel Inference: A Practical Information‐Theoretic Approach, 2nd ed. New York: Springer‐Verlag. [Google Scholar]
- Campbell, Angus , Converse Philip, Miller Warren, and Stokes Donald E.. 1960. The American Voter. New York: John Willey & Sons. [Google Scholar]
- Clarke, Harold D. , Kornberg Allan, and Scotto Thomas J.. 2009. Making Political Choices: Canada and the United States. Toronto: University of Toronto Press. [Google Scholar]
- Duch, Raymond M. , and Stevenson Randolph T. 2008. The Economic Vote: How Political and Economic Institutions Condition Electoral Results. Cambridge: Cambridge University Press. [Google Scholar]
- Heidemanns, Merlin , Gelman Andrew, and Morris G. Ellitoo. 2020. “An Updated Bayesian Forecasting Model for the U.S. Presidential Election”. Harvard Data Science Review. Available at 〈https://hdsr.mitpress.mit.edu/pub/nw1dzd02/release/1〉 [Google Scholar]
- Lewis‐Beck, Michael. 1988. Economics and Elections: The Major Western Democracies. Ann Arbor, MI: University of Michigan Press. [Google Scholar]
- Lewis‐Beck, Michael , Norpoth Helmut, Jacoby William G., and Weisberg Herbert F.. 2008. The American Voter Revisited. Ann Arbor, MI: University of Michigan Press. [Google Scholar]
- Long, J. Scott , and Freese Jeremy. 2014. Regression Models for Categorical Dependent Variables Using Stata, 3rd ed. College Station, TX: Stata Press. [Google Scholar]
- McLachlan, Geoffrey J. , Lee Sharon X., and Rathnayake Suren I.. 2019. “Finite Mixture Models.” Annual Review of Statistics and Its Application 6:355–78. [Google Scholar]
- Norpoth, Helmut. 2021. The Primary Model. Available at 〈https://primarymodel.com〉. [Google Scholar]
- ———. 2021. “Primary Model Predicts Trump Reelection.” PS: Political Science & Politics 54:63–66. [Google Scholar]
- Norris, Pippa , and Inglehart Ronald. 2019. Cultural Backlash: Trump, Brexit and Authoritarian Populism. Cambridge: Cambridge University Press. [Google Scholar]
- Sides, John , Tessler Michael, and Vavreck Lynn. 2018. Identity Crisis. The 2016 Presidential Campaign and the Battle for the Meaning of America. Princeton, NJ: Princeton University Press. [Google Scholar]
- Silver, Nate. 2020. “Biden is Favored to Win the Election.” FiveThirtyEight 2020. Available at 〈https://projects.fivethirtyeight.com/2020‐election‐forecast〉. [Google Scholar]
- Stokes, Donald E. 1963. “Spatial Models of Party Competition.” American Political Science Review 57:368–77. [Google Scholar]
- Young, Cristobal , and Holsteen Katherine. 2017. “Model Uncertainty and Robustness: A Computational Framework for Multimodel Analysis.” Sociological Methods & Research 46:3–40. [Google Scholar]


