

Abstract
Complement system hyperactivation has been proposed as a potential driver of adverse outcomes in severe acute respiratory syndrome coronavirus 2 infected patients, given prior research of complement deposits found in tissue and blood samples, as well as evidence of clinical improvement with anticomplement therapy. Its role in augmenting thrombotic microangiopathy mediated organ damage has also been implicated in coronavirus disease 2019 (COVID‐19). This study aimed to examine associations between complement parameters and progression to severe COVID‐19 illness, as well as correlations with other systems. Blood samples of COVID‐19 patients presenting to the emergency department (ED) were analyzed for a wide panel of complement and inflammatory biomarkers. The primary outcome was COVID‐19 severity at index ED visit, while the secondary outcome was peak disease severity over the course of illness. Fifty‐two COVID‐19 patients were enrolled. C3a (p = 0.018), C3a/C3 ratio (p = 0.002), and sC5b‐9/C3 ratio (p = 0.021) were significantly elevated in with severe disease at ED presentation. Over the course of illness, C3a (p = 0.028) and C3a/C3 ratio (p = 0.003) were highest in the moderate severity group. In multivariate regression controlled for confounders, complement hyperactivation failed to predict progression to severe disease. C3a, C3a/C3 ratio, and sC5b‐9/C3 ratio were correlated positively with numerous inflammatory biomarkers, fibrinogen, and VWF:Ag, and negatively with plasminogen and ADAMTS13 activity. We found evidence of complement hyperactivation in COVID‐19, associated with hyperinflammation and thrombotic microangiopathy. Complement inhibition should be further investigated for potential benefit in patients displaying a hyperinflammatory and microangiopathic phenotype.
Keywords: complement system, coronavirus disease 2019, SARS‐CoV‐2 hyperinflammation, thrombotic microangiopathy
1. INTRODUCTION
Evidence has emerged that multiorgan injury from severe acute respiratory syndrome coronavirus 2 (SARS‐CoV‐2) infection is propagated by a maladaptive, dysregulated host immune response, including complement hyperactivation.1, 2, 3 The complement system plays a central role within the innate immune system, responding to invading pathogens via the classical, alternative, and lectin pathways, which all converge at component 3 (C3), a core constituent in this pathway. 4 This common product results in enzymatically‐driven formation of many activation products (C3a, C5a), and culminates in formation of the membrane attack complex (C5b‐9), which kills invading pathogens via generation of membrane pores. 4 Complement not only plays a key role in the first line of defense against infectious agents, but also acts to bridge innate and adaptive immune responses through activation of T and B cells, and creation of immunologic memory. 5
While complement is essential in defense against viral infections, its hyperactivation and dysregulation can result in widespread systemic multiorgan damage. 6 Moreover, complement mediates vascular injury in various thrombotic microangiopathies (TMAs), such as atypical hemolytic uremic syndrome and antiphospholipid syndrome.7, 8 In keeping with this previous evidence, complement has been implicated in the pathogenesis of microvascular thrombosis frequently observed in patients with coronavirus disease 2019 (COVID‐19). 9
In five COVID‐19 patients with pulmonary and dermatologic signs of microvascular thrombosis, Magro et al. identified terminal complement (C5d‐9), C4d, and mannose‐binding protein‐associated serine protease 2 (MASP‐2) deposits in biopsies of lung and skin tissue, thus highlighting a potential contribution of the complement pathway to the process of thrombotic microvascular injury via endothelial damage and subsequent activation of the coagulation cascade. 9 Gao et al. 10 performed lung biopsies of patients who died from COVID‐19, and also reported evidence of complement activation, including deposits of mannose binding lectin, MASP‐2, C4a, C3, and C5b‐9. Additionally, patients with severe COVID‐19 illness were found to have significantly increased serum C5a, a potent anaphylatoxin which triggers the release of a myriad of inflammatory cytokines from leukocytes.2, 10 Holter and colleagues observed increased values of all markers of complement early in the course of SARS‐CoV‐2 infection, as well as an association of C4d and C5b‐9 with respiratory failure and systemic inflammation. 11 In accordance with these findings, small case series using anti‐C5a and anti‐C5 monoclonal antibodies (BDB‐0001 and eculizumab) in patients with COVID‐19 reported decreases in systemic inflammation and improvement in pulmonary function.10, 12
Hence, in this study we have carried out an assessment of a complete complement panel in patients with COVID‐19, using blood samples collected at initial presentation at the Emergency Department (ED). Our aim was to analyze the relationship between complement parameters and COVID‐19 severity, as well as explore correlations between the complement cascade and other systems, to help elucidate the pathophysiology of SARS‐CoV‐2 infection.
2. MATERIALS AND METHODS
Adult patients with reverse transcriptase polymerase chain reaction confirmed SARS‐CoV‐2 infection presenting at the ED of the University of Cincinnati Medical Center\ between April and May 2020 were enrolled in this prospective, observational study. Blood samples were taken as part of routine blood draws in the ED, and analyzed at the Clinical Nephrology Lab of the Cincinnati Children's Hospital Medical Center, a national referral center for complement testing. This study was approved by the Institutional Review Board of the University of Cincinnati and received a waiver of informed consent. This study was conducted in compliance with the Declaration of Helsinki, under the terms of relevant local and national legislation.
Serum levels of 50% hemolytic complement activity (CH50, representing total complement activity, MicroVue; Quidel Corporation), alternative pathway activity and lectin pathway activity (Wieslab, SVAR) were assessed using enzyme‐linked immunosorbent assays (ELISA). Quidel MicroVue ELISA kits were also used to measure complement components, including C3a, C4a, C5a, sC5b‐9, Bb, and C1 inhibitor activity. C3, C4, and C1 inhibitor antigen were measured by immunonephelometry on a Behring Nephelometer II (BNII; Siemens Medical Solutions USA). Radioimmunoassays were performed using both institutionally developed (Factor I: Cincinnati Children's Hospital Medical Center) and commercially available antisera (Factor B, Factor H, C1q: Complement Technology, Inc.).
Inflammatory markers evaluated by immunonephelometry included C reactive protein (CRP), ferritin, haptoglobin, myoglobin, fibrinogen, and plasminogen (BNII System; Siemens Medical Solutions USA). Interleukin (IL)‐6, IL‐8, IL‐10, and tumor necrosis factor‐α (TNF‐α) were run on a multi‐analyte immunoassay (MesoScale Diagnostics LLC). PAI‐1 and von Willebrand Factor antigen (VWF:Ag) were assayed with ELISA (Technoclone), whilst ADAMTS13 (a disintegrin and metalloproteinase with a thrombospondin type 1 motif, member 13) activity was quantified using a fluorescence resonance energy transfer (FRET) assay (Immucor, Inc.). Lactate dehydrogenase (LDH) was measured on RxL Integrated Chemistry System (Siemens Medical Solutions USA). Complete blood cell count and differential was carried out on Beckman Coulter UniCel DxH 800 Cellular Analysis System (Brea). All assays were run according to manufacturer instructions; ELISA assays were run on either the DS2 or DSX automated ELISA processing systems (DYNEX Technologies). The primary outcome was COVID‐19 disease severity at index ED visit, while the secondary outcome was peak disease severity over the course of illness. Patients were stratified into three severity level classes, according to the World Health Organization R&D Blueprint for COVID‐19 severity scale, 13 as follows: mild (ambulatory), moderate (hospitalized), severe (requiring intensive care unit admission).
Categorical variables were reported as frequencies (%), whilst continuous data was described using median and interquartile ranges (IQR). Statistically significant differences in laboratory values among groups were identified using the Kruskal–Wallis test, followed by Dunn test for multiple comparisons (when necessary). The relationship between complement parameters and inflammatory biomarkers was tested using Spearman's correlation coefficient. C3a/C3 and sC5b‐9/C3 ratios were calculated to assess potential alternative pathway and terminal pathway hyperactivation, respectively. Multivariable logistic regression was used to identify complement variables independently predicting disease severity after adjusting for age, sex, and comorbidities, with calculation of odds ratios and their 95% confidence intervals (95% confidence interval). Variable selection was based on univariate analysis and Stepwise algorithm. All statistical analyses were performed using R software (version 4.0.2; R Foundation for Statistical Computing), with p < 0.05 being considered statistically significant.
3. RESULTS
A total number of 52 adult patients with laboratory‐confirmed SARS‐CoV‐2 infection were enrolled in the study. The median age was 50.5 (IQR: 39.3–66.0) years and 30 (57.7%) were males. Patient demographics and outcomes are summarized in Table 1. At ED presentation, 6 patients (12%) were severe, while over the course of illness 16 (31%) patients reached a peak severe disease status.
Table 1.
Patient demographics, comorbidities, and outcomes
| Demographics | |
| Males, n (%) | 31 (59.6%) |
| Age, median (IQR) | 50.5 (41.5–66.0) years |
| Race, n (%) | |
| Black | 21 (40.4%) |
| Hispanic | 19 (36.5%) |
| White | 9 (17.3%) |
| Other | 3 (5.8%) |
| Comorbidities, n (%) | |
| Hypertension | 26 (50%) |
| Coronary artery disease | 8 (15.4%) |
| Heart failure | 9 (17.3%) |
| Hyperlipidemia | 15 (28.8%) |
| Diabetes | 21 (40.4%) |
| COPD | 8 (15.4%) |
| Chronic kidney disease | 6 (11.5%) |
| Chronic liver disease | 7 (13.5%) |
| Emergency department disease status, n (%) | |
| Mild | 19 (36.5%) |
| Moderate | 27 (51.9%) |
| Severe | 6 (11.5%) |
| Peak disease status, n (%) | |
| Mild | 19 (36.5%) |
| Moderate | 17 (31.7%) |
| Severe | 16 (30.8%) |
Abbreviations: COPD, chronic obstructive lung disease; IQR, interquartile range.
The values of complement parameters stratified according to COVID‐19 disease severity at ED presentation and peak are summarized in Table 2. Statistically significant elevations were observed in C3a (p = 0.018) over the normal range, as well as C3a/C3 ratio (p = 0.002) and sC5b‐9/C3 ratio (p = 0.021) in those with severe disease at ED presentation (Figure 1). For peak disease, only C3a (p = 0.028) and the C3a/C3 ratio (p = 0.003) were significantly different between severity groups, with moderate group displaying the highest values. C5a and sC5b‐9 had nonsignificant trends toward higher levels those with more severe disease both at ED presentation and at peak, although levels were relatively within normal range. When adjusted for age and comorbidities, no complement variable measured at ED presentation was predictive of progression to severe disease during illness.
Table 2.
Complement levels measured on admission in patients with COVID‐19 stratified by disease severity upon emergency department (ED) presentation and at peak during hospitalization
| Lab variable | Reference range | COVID‐19 severity at ED presentation | Peak COVID‐19 severity | ||||||
|---|---|---|---|---|---|---|---|---|---|
| Mild (n = 19) | Moderate (n = 27) | Severe (n = 6) | p value | Mild (n = 19) | Moderate (n = 17) | Severe (n = 16) | p value | ||
| Alternative pathway, % | >63% | 103.4 (90.1–108.9) | 89.7 (77.7–102.0) | 92.5 (81.0–100.0) | 0.102 | 103.4 (90.1–108.9) | 89.3 (82.0–102.3) | 94.6 (77.1–100.6) | 0.099 |
| Lectin pathway, % | >11% | 88.1 (1.6–120) | 23.2 (0.6–99.9) | 51.7 (1.2–106.9) | 0.516 | 88.1 (1.6–120) | 20.2 (0.1–103.6) | 37.0 (3.8–101.5) | 0.398 |
| Classical pathway, CH50/ml | 101–300 units | 211.8 (162.7–280.8) | 196.2 (142–257.6) | 169.6 (138.8–232.1) | 0.457 | 211.8 (162.7–280.8) | 240.3 (148.2–306.0) | 159.8 (127.6–195.2) | 0.075 |
| C3, mg/dl | 71–150 mg/dl | 151.0 (120.5–169.0) | 140.0 (119.0–153.5) | 134.5 (100.3–166.2) | 0.723 | 151.0 (120.5–169.0) | 143.0 (121.0–158.0) | 132.5 (112.0–149.5) | 0.501 |
| C3a, ng/ml | 25–88.2 ng/ml | 205.4 (138.1–218.0) | 244.0 (174.6–392.0) | 389.1 (226.9–499.2) | 0.018 | 205.4 (138.1–218.0) | 299.6 (179.2–397.4) | 229.8 (195.1–482.0) | 0.028 |
| C4, mg/dl | 15.7–47 mg/dl | 33.5 (28.0–36.1) | 31.5 (26.4–39.9) | 37.0 (25.4–45.3) | 0.868 | 33.5 (28.0–36.1) | 33.5 (25.9–42.3) | 30.9 (25.9–38.2) | 0.787 |
| C4a, ng/dl | 383.5–8168.2 ng/ml | 445.7 (276.9–692.5) | 498.5 (352.6–1154.5) | 585.8 (386.8–815.8) | 0.347 | 445.7 (276.9–692.5) | 709.7 (476.6–1198.9) | 420.4 (334.4–847.5) | 0.098 |
| C5a, ng/ml | 2.7–16.3 ng/ml | 8.7 (6.9–14.1) | 16.8 (8.1–23.8) | 16 (9.1–24.2) | 0.150 | 8.7 (6.9–14.1) | 23.3 (7.2–25) | 12.5 (9.4–20) | 0.115 |
| C1q, mg/dl | 5.1–7.5 mg/dl | 4.8 (3.8–5.9) | 5.1 (3.3–6.9) | 4.8 (1.7–5.7) | 0.909 | 4.83 (3.8–5.9) | 5.7 (3.1–6.9) | 4.8 (3.0–6.0) | 0.865 |
| Factor B, mg/dl | 13.3–31.5 mg/dl | 15.6 (12.0–19.6) | 15.2 (10.4–18.6) | 13.2 (8.3–18.8) | 0.785 | 15.6 (12.0–19.6) | 15.6 (10.4–18.6) | 13.2 (10.3–19.9) | 0.821 |
| Factor Bb, µg/ml | 0.49–1.42 µg/ml | 1.24 (0.96–1.92) | 1.75 (1.32–2.58) | 2.16 (1.25–2.68) | 0.192 | 1.24 (0.96–1.92) | 1.69 (1.29–2.37) | 2.07 (1.26–2.62) | 0.185 |
| sC5b‐9, ng/ml | <244 ng/ml | 125.3 (86.3–238.8) | 199.6 (144.4–297.5) | 238.5 (207.2–273.3) | 0.094 | 125.3 (86.3–238.8) | 203.1 (139.6–314.1) | 213.4 (178.5–258.6) | 0.166 |
| C1‐inhibitor antigen, mg/dl | 21.0–39.0 mg/dl | 37.6 (33.4–48.0) | 44.8 (36.1–54.2) | 43.2 (42.9–51.3) | 0.255 | 37.6 (33.4–48.0) | 44.3 (35.9–54.5) | 44.0 (42.3–54.0) | 0.242 |
| C1‐inhibitor activity, % | >67% | 92.0 (88.1–96.6) | 95.5 (89.8–97.3) | 91.7 (90.4–94.4) | 0.647 | 92.0 (88.1–96.6) | 95.5 (89.6–97.5) | 94.2 (90.2–96.6) | 0.840 |
| Factor H, mg/dl | 37.0–68.0 mg/dl | 70.6 (58.0–84.4) | 68.7 (52.7–82.5) | 52.0 (42.8–66.9) | 0.283 | 70.6 (58.0–84.4) | 72.4 (55.4–79.9) | 59.4 (45.9–76.2) | 0.431 |
| Factor I, mg/dl | 2.4–4.9 mg/d | 4.45 (3.98–5.51) | 4.6 (3.7–5.4) | 4.1 (3.4–4.8) | 0.742 | 4.4 (4.0–5.5) | 4.8 (4.3–5.4) | 4.3 (3.3–5.0) | 0.568 |
| C3a/C3 | – | 1.1 (1.1–1.7) | 1.7 (1.5–2.8) | 0.002 | 1.1 (1.1–1.7) | 2.4 (1.5–3.0) | 1.9 (1.5–2.9) | 0.003 | |
| SC5b‐9/C3 | – | 1.11 (0.60–1.64) | 1.5 (1.0–2.1) | 2.0 (1.5–2.9) | 0.021 | 1.1 (0.6–1.6) | 1.6 (1.0–2.1) | 1.6 (1.2–2.4) | 0.059 |
Note: Bold p values indicate p < 0.05. All data presented as median (IQR). p Values calculated with Kruskal–Wallis test. CH50–50% hemolytic complement activity.
Abbreviation: COVID‐19, coronavirus disease 2019.
Figure 1.
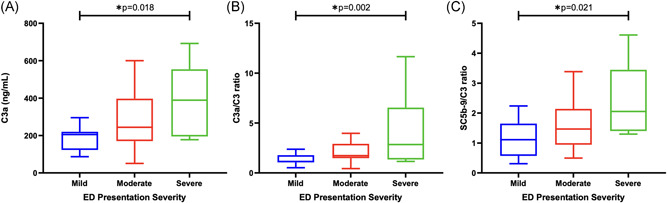
(A) C3a levels, (B) C3a/C3 ratio, and (C) sC5b‐9/C3 ratio measured at emergency department (ED) presentation according to COVID‐19 severity at time of presentation. COVID‐19, coronavirus disease 2019
Spearman's correlation coefficients representing association between C3a, C3a/C3, as well as sC5b‐9/C3 and a panel of inflammatory markers are presented in Table 3. Levels of the individual inflammatory markers measured at ED presentation are summarized in Table S1. Increased C3a was positively and significantly correlated with CRP (r = 0.630), ferritin (r = 0.485), haptoglobin (r = 0.437), IL‐6 (r = 0.626), IL‐8 (r = 0.470), IL‐10 (r = 0.522), LDH (r = 0.432), TNF‐α (r = 0.514), myoglobin (r = 0.492), fibrinogen (r = 0.487), as well as with VWF:Ag (r = 0.484), all at a p ≤ 0.001. C3a levels were negatively associated with ADAMTS13 activity (r = −0.416, p = 0.002) and ratio of ADAMTS13/VWF:Ag (r = −0.630, p < 0.001). Increased C3a/C3 was positively and significantly correlated with CRP (r = 0.478, p < 0.001), ferritin (r = .389, p = 0.04), IL‐6 (r = 0.631, p < 0.001), IL‐8 (r = 0.573, p < 0.001), IL‐10 (r = 0.505, p < 0.001), LDH (r = 0.430, p = 0.001), TNF‐α (r = 0.632, p < 0.001), myoglobin (r = 0.540, p < 0.001), and VWF:Ag (r = 0.405, p = 0.003). C3a/C3 levels were negatively associated with plasminogen (r = −0.305, p = 0.029), ADAMTS13 activity (r = −0.552, p < 0.001) and ratio of ADAMTS13/VWF:Ag (r = −0.640, p < 0.001). Finally, the ratio of sC5b‐9/C3 had a statistically significant positive correlation with CRP (r = 0.458, p < 0.001), ferritin (r = 0.350, p = 0.012), haptoglobin (r = 0.289, p < 0.039), IL‐6 (r = 0.540, p < 0.001), IL‐8 (r = 0.333, p = 0.018), IL‐10 (r = 0.405, p = 0.003), LDH (r = 0.300, p = 0.032), TNF‐α (r = 0.305, p = 0.031), myoglobin (r = 0.307, p = 0.028), VWF:Ag (r = 0.466, p < 0.001), and a negative association with ADAMTS13 (r = −0.354, p = 0.011), and ADAMTS13/VWF:Ag (r = −0.520, p < 0.001). None of the complement markers were correlated significantly with PAI‐1, d ‐dimer, white leukocyte or lymphocyte counts.
Table 3.
Spearman rank correlation coefficients between C3a, C3a/C3, and sC5b‐9/C3 and inflammatory biomarkers
| Lab variable | Spearman's correlation coefficient (p value) | ||
|---|---|---|---|
| C3a | C3a/C3 | sC5b‐9/C3 | |
| CRP | 0.6299 (p < 0.001) | 0.478 (p < 0.001) | 0.458 (p < 0.001) |
| Ferritin | 0.485 (p < 0.001) | 0.389 (p = 0.004) | 0.350 (p = 0.012) |
| Haptoglobin | 0.437 (p = 0.001) | 0.213 (p = 0.133) | 0.289 (p = 0.039) |
| IL‐6 | 0.626 (p < 0.001) | 0.631 (p < 0.001) | 0.540 (p < 0.001) |
| IL‐8 | 0.470 (p < 0.001) | 0.573 (p < 0.001) | 0.333 (p = 0.018) |
| IL‐10 | 0.522 (p < 0.001) | 0.505 (p < 0.001) | 0.405 (p = 0.003) |
| LDH | 0.432 (p = 0.001) | 0.430 (p = 0.001) | 0.300 (p = 0.032) |
| TNF‐α | 0.514 (p < 0.001) | 0.632 (p < 0.001) | 0.305 (p = 0.031) |
| Myoglobin | 0.492 (p < 0.001) | 0.540 (p < 0.001) | 0.307 (p = 0.028) |
| Fibrinogen | 0.487 (p = 0.001) | 0.271 (p = 0.090) | 0.117 (p = 0.470) |
| Plasminogen | −0.026 (p = 0.852) | −0.305 (p = 0.029) | −0.080 (p = 0.577) |
| PAI‐1 | 0.244 (p = 0.084) | 0.185 (p = 0.194) | 0.199 (p = 0.161) |
| d ‐Dimer | 0.147 (p = 0.483) | 0.245 (p = 0.238) | 0.182 (p = 0.384) |
| WBC | 0.169 (p = 0.246) | 0.109 (p = 0.456) | 0.249 (p = 0.084) |
| Lymphocytes | −0.169 (p = 0.249) | −0.232 (p = 0.112) | −0.148 (p = 0.313) |
| ADAMTS13 activity | −0.416 (p = 0.002) | −0.552 (p < 0.001) | −0.354 (p = 0.011) |
| VWF:Ag | 0.484 (p < 0.001) | 0.405 (p = 0.003) | 0.466 (p < 0.001) |
| ADAMTS13/VWF:Ag | −0.630 (p < 0.001) | −0.640 (p < 0.001) | −0.520 (p < 0.001) |
Note: Levels of inflammatory biomarkers are summarized in Table S1.
Abbreviations: ADAMTS13, a disintegrin and metalloproteinase with a thrombospondin type 1 motif, member 13; CRP, C reactive protein; IL‐6, interleukin‐6; LDH, lactate dehydrogenase; TNF‐α, tumor necrosis factor‐α; VWF:Ag, von Willebrand Factor antigen; WBC, white blood cells.
4. DISCUSSION
In this prospective study, we observed evidence of complement hyperactivation in patients presenting to the ED with severe disease, as reflected by significant increase in C3a above the norm, as well as elevations in the C3a/C3 and sC5b‐9/C3 ratios, which are suggestive of alternative and terminal pathway hyperactivation, respectively.
C3a is an anaphylatoxin that induces inflammation, endothelial activation, 14 as well as coagulation via binding of the C3a receptor (C3aR) on platelets,9, 15 in turn aggravating microthrombosis and contributing to a TMA‐like phenomenon. 16 Interestingly though, emerging evidence also proposes an anti‐inflammatory role for C3a, with potential ability to antagonize the potent anaphylatoxin and chemoattractant C5a, 17 which may potentially explain the observation of lower admission levels of C3a among the group that developed highest severity later in the course of hospitalization. This dichotomy in the function of C3a may even contribute to immune dysregulation, now a distinguishing feature of COVID‐19. 3
Finding elevations above the normal range of only C3a may seem surprising in light of several other studies, such as that by Cugno et al., 18 as well as Carvelli et al., 19 that observed considerable elevations in other complement cascade components implicated in inflammation and tissue damage in COVID‐19, namely C5a and sC5b‐9, and with levels corresponding to disease severity. Nonetheless, despite being within normal range in most of our patients measured at time of ED presentation, C5a and sC5b‐9 displayed a nonsignificant trend toward higher levels among patients with moderate and severe disease severity both in the ED and at peak during hospitalization. Moreover, the trend for sC5b‐9 is in part supported by significant elevations in the sC5b‐9/C3 ratio in patients with severe disease on admission. Absence of such considerable elevations in C5a and sC5b‐9 in our study may be attributed to the differences in severity of patients at time of sampling and the non‐significance may be explained by differences in sample sizes, whereby the smaller cohort in our study compared to the study by Cugno et al. may have limited the statistical power to identify these differences, or by heterogeneity related to underlying baseline characteristics of included patients in both studies. 20 Additionally, C5a has a much shorter half‐life than relatively more stable C3a, as it quickly binds to high affinity C5a receptors (C5aR) on neutrophils, 21 complicating the ability to detect accurate levels of C5a in blood samples.
In multivariable regression, complement hyperactivation did not predict progression to severe disease in patients with mild or moderate illness at ED presentation. This suggests that complement levels may only reflect acute disease status, becoming hyperactivated following other insults during progression to more critical illness. This finding is in opposition to a recent report suggesting that complement overactivation on admission was associated with development of respiratory failure. 11 We suspect that this heterogeneity between studies may also be attributed to the differences in severity of patients at time of sampling.
Gralinski et al. earlier reported that SARS‐CoV infected mice bearing a deficient C3 gene had significantly less respiratory dysfunction than those with an intact complement system, despite equivalent viral loads. 22 In COVID‐19, Ramlall et al. noted that none of the patients with complement deficiency who would normally be at higher risk of developing severe infection required invasive oxygen support or died. 23 Moreover, the role of complement in driving COVID‐19 severity is reflected in small clinical trials demonstrating reduced system inflammation and lung injury with anti‐C5, anti‐C5a, and anti‐C3 monoclonal antibodies.10, 12, 24
Our results also show that C3a and the C3a/C3 and sC5b‐9/C3 ratios were correlated with an array of inflammatory biomarkers, thus suggesting a close interplay between different systems. Elevated C3a was correlated with fibrinogen levels, which is in accordance with extensive cross‐talk between complement and coagulation systems. 25 C3a/C3 was inversely correlated with plasminogen, in agreement with reports of lower plasminogen levels in COVID‐19 patients requiring ICU admission, and thus suggesting fibrinolytic system disruption occurring in concert with complement hyperactivation. 26 Fibrinolysis disturbance due to increased PAI‐1, 1 however, did not appear to be linked to complement hyperactivity, therefore suggesting that plasminogen depletion may be the result of consumptive fibrinolysis.
Positive correlations of C3a, C3a/C3, and sC5b‐9/C3 with VWF:Ag, with parallel negative correlations with ADAMTS13 activity and ADAMTS13 activity/VWF:Ag ratio is strongly suggestive of a TMA‐like phenomenon in COVID‐19. Henry et al. provided evidence suggesting multiorgan injury in COVID‐19 is driven by a secondary TMA, with low ADAMTS13 activity/VWF:Ag ratio associated with severe illness and acute kidney injury. 16 Bazzan et al. found lower ADAMTS13 activity and higher VWF:Ag to be highly predictive of fatal outcome in COVID‐19. 27 Recently, by demonstrating an association between sC5b‐9 and VWF, Cugno et al. 18 provided evidence suggesting a role of complement in bridging endotheliopathy and VWF‐mediated hypercoagulability. Adverse outcomes in other TMAs, such as thrombotic thrombocytopenic purpura and hemolytic uremic syndrome have likewise been associated with reduced ADAMTS13 activity and elevated VWF, notably in the setting of complement activation. 28 This association may explain in part the high complement levels observed in COVID‐19 patients, given that the microthrombotic process triggered by ADAMTS13 deficiency has been shown to activate complement. 29 The result is a vicious cycle, wherein complement activation results in further endothelial damage and hemostasis activation. 9 Evidence of these associations not only substantiates the use of anticoagulants and/or antiplatelet agents in hospitalized COVID‐19 patients, but also warrants further investigation of the potential benefits of using anticomplement therapy.
Findings of significant correlations between complement end products and inflammatory mediators, such as CRP, IL‐6, IL‐8, and TNF‐ɑ corroborate the favorable effects that complement inhibitors may have in dampening the hyperinflammatory response in patients with severe COVID‐19.12, 30, 31 However, in light of the strong associations previously observed between anti‐inflammatory IL‐10 and disease progression in COVID‐19 patients, our findings of positive correlations of complement with IL‐10 give further evidence for a picture of immune dysregulation in COVID‐19, stressing the fact that immunomodulatory therapy must be fitted to the particular patient immunophenotype. 3 Furthermore, close correlations call for further research to test whether inflammatory biomarkers may serve as a reliable proxy for the state of the complement system. This is important in light of the fact that complement biomarkers are fairly unstable, and thus may be unreliable for identification of disease severity. 6
This study was limited by the relatively modest sample size of 52 patients, such that certain differences in complement may have been missed. Additionally, variance in findings with the limited other complement studies in patients with COVID‐19 may stem from significant differences in inflammatory laboratory values at admission that have been reported in other cohorts, especially across different geographic regions. 20 As such, these values could be impacted by several confounders, such as different viral strains or underlying patient demographics. 20 These findings should thus be corroborated by additional multi‐national studies. However, finding statistically significant differences in C3a level, and the C3a/C3 and sC5b‐9/C3 ratios in a design with high probability of a false negative error, reinforces our confidence that the results are valid. Additionally, our study is strengthened by many multi‐system biomarkers analyzed, enabling assessment of potential interaction between complement and other systems. Finally, as this study was exploratory, we did not control for multiple comparisons.
In conclusion, our results suggest that complement hyperactivation may be associated with hyperinflammation and thrombotic microangiopathy in COVID‐19. As complement activation may propagate immune‐mediated and thrombotic organ damage, further studies should be planned to address whether complement inhibition may have potential therapeutic benefits in selected categories of patients with a hyperinflammatory and microangiopathic phenotype.
CONFLICT OF INTERESTS
The authors declare that there are no conflict of interests.
AUTHOR CONTRIBUTIONS
Brandon Michael Henry, Jens Vikse, and Giuseppe Lippi conceived and designed the study. Brandon Michael Henry, Justin L. Benoit, and Stefanie W. Benoit collected samples and ran experiments. Justin L. Benoit and Maria Helena Santos de Oliveira performed data acquisition and collection. Brandon Michael Henry, Ivan Szergyuk, and Maria Helena Santos de Oliveira did data analysis. Brandon Michael Henry, Ivan Szergyuk, Giuseppe Lippi, Justin L. Benoit, Jens Vikse, and Stefanie W. Benoit interpreted the data. Ivan Szergyuk prepared the first draft. Brandon Michael Henry, Maria Helena Santos de Oliveira, Giuseppe Lippi, Justin L. Benoit, Jens Vikse, and Stefanie W. Benoit critically revised the manuscript for important intellectual content. All authors have approved the final article.
PEER REVIEW
The peer review history for this article is available at https://publons.com/publon/10.1002/jmv.27077
ETHICS STATEMENT
This study was approved by the Institutional Review Board (IRB) of the University of Cincinnati and received a waiver of informed consent on the basis of no more than minimal risk.
Supporting information
Supplementary information.
ACKNOWLEDGMENTS
This study was funded by the University of Cincinnati College of Medicine Special Coronavirus (COVID‐19) Research Pilot Grant Program.
Henry BM, Szergyuk I, Santos de Oliveira MH, et al. Complement levels at admission as a reflection of coronavirus disease 2019 (COVID‐19) severity state. J Med Virol. 2021;93:5515–5522. 10.1002/jmv.27077
DATA AVAILABILITY STATEMENT
The data that support the findings of this study are available from the corresponding author upon reasonable request.
REFERENCES
- 1. Henry BM, Vikse J, Benoit S, Favaloro EJ, Lippi G. Hyperinflammation and derangement of renin‐angiotensin‐aldosterone system in COVID‐19: a novel hypothesis for clinically suspected hypercoagulopathy and microvascular immunothrombosis. Clin Chim Acta Int J Clin Chem. 2020;507:167‐173. [DOI] [PMC free article] [PubMed] [Google Scholar]
- 2. Noris M, Benigni A, Remuzzi G. The case of complement activation in COVID‐19 multiorgan impact. Kidney Int. 2020;98(2):314‐322. [DOI] [PMC free article] [PubMed] [Google Scholar]
- 3. Henry BM, Benoit SW, Vikse J, et al. The anti‐inflammatory cytokine response characterized by elevated interleukin‐10 is a stronger predictor of severe disease and poor outcomes than the proinflammatory cytokine response in coronavirus disease 2019 (COVID‐19). Clin Chem Lab Med CCLM. 2021;59(3):599‐607. [DOI] [PubMed] [Google Scholar]
- 4. Sarma JV, Ward PA. The complement system. Cell Tissue Res. 2011;343(1):227‐235. [DOI] [PMC free article] [PubMed] [Google Scholar]
- 5. Dunkelberger JR, Song W‐C. Complement and its role in innate and adaptive immune responses. Cell Res. 2010;20(1):34‐50. [DOI] [PubMed] [Google Scholar]
- 6. Risitano AM, Mastellos DC, Huber‐Lang M, et al. Complement as a target in COVID‐19? Nat Rev Immunol. 2020;20(6):343‐344. [DOI] [PMC free article] [PubMed] [Google Scholar]
- 7. Manrique‐Caballero CL, Peerapornratana S, Formeck C, Rio‐Pertuz GD, Danies HG, Kellum JA. Typical and atypical hemolytic uremic syndrome in the critically ill. Crit Care Clin. 2020;36(2):333‐356. [DOI] [PubMed] [Google Scholar]
- 8. Ruffatti A, Calligaro A, Lacognata CS, et al. Insights into the pathogenesis of catastrophic antiphospholipid syndrome. A case report of relapsing catastrophic antiphospholipid syndrome and review of the literature on ischemic colitis. Clin Rheumatol. 2020;39(4):1347‐1355. [DOI] [PubMed] [Google Scholar]
- 9. Magro C, Mulvey JJ, Berlin D, et al. Complement associated microvascular injury and thrombosis in the pathogenesis of severe COVID‐19 infection: a report of five cases. Transl Res J Lab Clin Med. 2020;220:1‐13. [DOI] [PMC free article] [PubMed] [Google Scholar]
- 10. Gao CA, Bailey JI, Walter JM, et al. Highly pathogenic coronavirus N protein aggravates lung injury by MASP‐2‐mediated complement over‐activation. medRxiv. 2020. [Google Scholar]
- 11. Holter JC, Pischke SE, de Boer E, et al. Systemic complement activation is associated with respiratory failure in COVID‐19 hospitalized patients. Proc Natl Acad Sci USA. 2020;117(40):25018‐25025. [DOI] [PMC free article] [PubMed] [Google Scholar]
- 12. Diurno F, Numis FG, Porta G, et al. Eculizumab treatment in patients with COVID‐19: preliminary results from real life ASL Napoli 2 Nord experience. Eur Rev Med Pharmacol Sci. 2020;24(7):4040‐4047. [DOI] [PubMed] [Google Scholar]
- 13. World Health Organization . WHO R&D blueprint novel coronavirus: COVID‐19 therapeutic trial synopsis. 2020. https://www.who.int/blueprint/priority-diseases/key-action/COVID-19_Treatment_Trial_Design_Master_Protocol_synopsis_Final_18022020.pdf. Accessed January 6, 2020.
- 14. Klos A, Tenner AJ, Johswich K‐O, Ager RR, Reis ES, Köhl J. The role of the anaphylatoxins in health and disease. Mol Immunol. 2009;46(14):2753‐2766. [DOI] [PMC free article] [PubMed] [Google Scholar]
- 15. Sauter RJ, Sauter M, Reis ES, et al. Functional relevance of the anaphylatoxin receptor C3aR for Platelet function and arterial thrombus formation marks an intersection point between innate immunity and thrombosis. Circulation. 2018;138(16):1720‐1735. [DOI] [PMC free article] [PubMed] [Google Scholar]
- 16. Henry BM, Benoit SW, de Oliveira MHS, Lippi G, Favaloro EJ, Benoit JL. ADAMTS13 activity to von Willebrand factor antigen ratio predicts acute kidney injury in patients with COVID‐19: Evidence of SARS‐CoV‐2 induced secondary thrombotic microangiopathy. Int J Lab Hematol. 2020;00:1‐8. [DOI] [PMC free article] [PubMed] [Google Scholar]
- 17. Coulthard LG, Woodruff TM. Is the complement activation product C3a a proinflammatory molecule? Re‐evaluating the evidence and the myth. J Immunol. 2015;194(8):3542‐3548. [DOI] [PubMed] [Google Scholar]
- 18. Cugno M, Meroni PL, Gualtierotti R, et al. Complement activation and endothelial perturbation parallel COVID‐19 severity and activity. J Autoimmun. 2021;116:102560. [DOI] [PMC free article] [PubMed] [Google Scholar]
- 19. Carvelli J, Demaria O, Vély F, et al. Association of COVID‐19 inflammation with activation of the C5a‐C5aR1 axis. Nature. 2020;588(7836):146‐150. [DOI] [PMC free article] [PubMed] [Google Scholar]
- 20. Lippi G, Henry BM, Hoehn J, Benoit S, Benoit J. Validation of the Corona‐score for rapid identification of SARS‐CoV‐2 infections in patients seeking emergency department care in the United States. Clin Chem Lab Med CCLM. 2020;58(12):e311‐e313. [DOI] [PubMed] [Google Scholar]
- 21. de Nooijer AH, Grondman I, Janssen NAF, et al. Complement activation in the disease course of coronavirus disease 2019 and its effects on clinical outcomes. J Infect Dis. 2021;223(2):214‐224. [DOI] [PMC free article] [PubMed] [Google Scholar]
- 22. Gralinski LE, Sheahan TP, Morrison TE, et al. Complement activation contributes to severe acute respiratory syndrome coronavirus pathogenesis. mBio. 2018;9(5). [DOI] [PMC free article] [PubMed] [Google Scholar]
- 23. Ramlall V, Thangaraj PM, Meydan C, et al. Immune complement and coagulation dysfunction in adverse outcomes of SARS‐CoV‐2 infection. Nat Med. 2020;26(10):1609‐1615. [DOI] [PMC free article] [PubMed] [Google Scholar]
- 24. Mastaglio S, Ruggeri A, Risitano AM, et al. The first case of COVID‐19 treated with the complement C3 inhibitor AMY‐101. Clin Immunol Orlando Fla. 2020;215:108450. [DOI] [PMC free article] [PubMed] [Google Scholar]
- 25. Kenawy HI, Boral I, Bevington A. Complement‐coagulation cross‐talk: a potential mediator of the physiological activation of complement by low pH. Front Immunol. 2015;6:215. [DOI] [PMC free article] [PubMed] [Google Scholar]
- 26. Henry BM, Benoit SW, Hoehn J, Lippi G, Favaloro EJ, Benoit JL. Circulating plasminogen concentration at admission in patients with coronavirus disease 2019 (COVID‐19). Semin Thromb Hemost. 2020;46(7):859‐862. [DOI] [PMC free article] [PubMed] [Google Scholar]
- 27. Bazzan M, Montaruli B, Sciascia S, Cosseddu D, Norbiato C, Roccatello D. Low ADAMTS 13 plasma levels are predictors of mortality in COVID‐19 patients. Intern Emerg Med. 2020;18:1‐3. [DOI] [PMC free article] [PubMed] [Google Scholar]
- 28. Farkas P, Csuka D, Mikes B, et al. Complement activation, inflammation and relative ADAMTS13 deficiency in secondary thrombotic microangiopathies. Immunobiology. 2017;222(2):119‐127. [DOI] [PubMed] [Google Scholar]
- 29. Tati R, Kristoffersson A‐C, Ståhl AL, et al. Complement activation associated with ADAMTS13 deficiency in human and murine thrombotic microangiopathy. J Immunol. 2013;191(5):2184‐2193. [DOI] [PMC free article] [PubMed] [Google Scholar]
- 30. Kulasekararaj AG, Lazana I, Large J, et al. Terminal complement inhibition dampens the inflammation during COVID‐19. Br J Haematol. 2020;190(3):e141‐e143. [DOI] [PMC free article] [PubMed] [Google Scholar]
- 31. Mastellos DC, Pires da Silva BGP, Fonseca BAL, et al. Complement C3 vs C5 inhibition in severe COVID‐19: early clinical findings reveal differential biological efficacy. Clin Immunol Orlando Fla. 2020;220:108598. [DOI] [PMC free article] [PubMed] [Google Scholar]
Associated Data
This section collects any data citations, data availability statements, or supplementary materials included in this article.
Supplementary Materials
Supplementary information.
Data Availability Statement
The data that support the findings of this study are available from the corresponding author upon reasonable request.