Abstract
Coronavirus disease 2019 (COVID‐19) is a global epidemic disease caused by a novel virus, severe acute respiratory syndrome coronavirus 2 (SARS‐CoV‐2), causing serious adverse effects on human health. In this study, we obtained a blood leukocytes sequencing data set of COVID‐19 patients from the GEO database and obtained differentially expressed genes (DEGs). We further analyzed these DEGs by protein–protein interaction analysis and Gene Ontology enrichment analysis and identified the DEGs closely related to SARS‐CoV‐2 infection. Then, we constructed a six‐gene model (comprising IFIT3, OASL, USP18, XAF1, IFI27, and EPSTI1) by logistic regression analysis and calculated the area under the ROC curve (AUC) for the diagnosis of COVID‐19. The AUC values of the training group, testing group, and entire group were 0.930, 0.914, and 0.921, respectively. The six genes were highly expressed in patients with COVID‐19 and positively correlated with the expression of SARS‐CoV‐2 invasion‐related genes (ACE2, TMPRSS2, CTSB, and CTSL). The risk score calculated by this model was also positively correlated with the expression of TMPRSS2, CTSB, and CTSL, indicating that the six genes were closely related to SARS‐CoV‐2 infection. In conclusion, we comprehensively analyzed the functions of DEGs in the blood leukocytes of patients with COVID‐19 and constructed a six‐gene model that may contribute to the development of new diagnostic and therapeutic ideas for COVID‐19. Moreover, these six genes may be therapeutic targets for COVID‐19.
Keywords: bioinformatics, COVID‐19, diagnosis, leukocyte, SARS‐CoV‐2
Highlights
COVID‐19 is a global epidemic and poses a serious risk to human health.
The differentially expressed genes related to SARS‐CoV‐2 infection in leukocytes of patients with COVD‐19 were screened.
A 6‐gene model for COVID‐19 diagnosis and treatment was constructed by logistic regression analysis.
The role and mechanism of these six genes (IFIT3, OASL, USP18, XAF1, IFI27, and EPSTI1) in COVID‐19 were preliminarily analyzed.
1. INTRODUCTION
Coronavirus disease 2019 (COVID‐19) is a respiratory disease caused by severe acute respiratory syndrome coronavirus 2 (SARS‐CoV‐2) and is extremely contagious. The COVID‐19 epidemic emerged in Wuhan, Hubei, China, in December 2019; since then this outbreak has spread around the world, causing global concern. 1 The most common clinical symptoms of the disease are fever, fatigue, dry cough, myalgia, diarrhea, and vomiting. In severe cases, COVID‐19 can cause dyspnea, loss of taste or smell, and kidney failure. 2 The outbreak of COVID‐19 has affected all aspects of life, posing a great threat to human health. According to the data published by the World Health Organization (WHO), there were 122,992,844 confirmed cases of COVID‐19 and 2,711,071 related deaths worldwide as of March 22, 2021. The top five countries with more than 1,000,000 cumulative confirmed cases of COVID‐19 are the United States, India, Brazil, Russia, and France. 3 COVID‐19 has already exceeded the total number of cases and deaths observed with atypical pneumonia (SARS‐CoV in 2003) and the Middle East respiratory syndrome coronavirus (in 2012) because SARS‐CoV‐2 has a higher transmission rate.4, 5 Therefore, it is crucial to analyze the current situation and study the impact of prevention and control measures separately for different epidemic situations in countries around the world.
Currently, quantitative real‐time polymerase chain reaction (qRT‐PCR) measurement of the SARS‐CoV‐2 nucleic acid is an important method for the diagnosis of COVID‐19 in China to determine whether patients can be discharged from the hospital and/or need to enter isolation. 6 However, a negative qRT‐PCR test result is not sufficient to exclude SARS‐CoV‐2 infection, and a combination of symptoms, radiological examination, and hematological examination are required to improve the sensitivity and accuracy of COVID‐19 diagnosis. 7 Published studies have revealed that some hematological/biochemical changes in patients (e.g., normal or decreased leukocytes) may contribute to the diagnosis of COVID‐19.8, 9
After SARS‐CoV‐2 infection, immune cells are activated, which can result in a significant increase in immune cell infiltration into the lung tissue. These immune cells can secrete a large of inflammatory cytokines, resulting in a strong inflammatory response, namely, a “cytokine storm.” This excessive inflammatory response can lead to many complications and even death. 10 By analyzing transcriptome sequencing data from peripheral blood samples, we can identify differentially expressed genes (DEGs) associated with host immune and/or inflammatory responses. Studying the changes in gene expression in human immune cells after SARS‐CoV‐2 infection helps improve understanding of the mechanism of SARS‐CoV‐2 damage to the human body and helps improve the diagnosis and treatment of the disease.11, 12, 13, 14 Overmyer et al. 15 sequenced the leukocytes of patients with positive (n = 102) and negative (n = 102) SARS‐CoV‐2 tests and developed a COVID‐19 severity prediction model through machine learning. The model's predictive ability was significantly better than that of the standard Charlson comorbidity index. Due to the advantage of easy access to blood samples, the development of predictive models based on blood leukocytes sequencing can be of great help for enhancing the diagnosis and treatment of COVID‐19. A recently published study performed whole‐transcriptome RNA sequencing of 14 peripheral blood samples from COVID‐19 patients (n = 10) and healthy donors (n = 4), from which researchers screened a large number of differentially expressed mRNAs and miRNAs and constructed a lncRNA‐miRNA‐mRNA regulatory network. 16 In addition, Arg1 has recently been found to be highly expressed in the peripheral blood leukocytes of COVID‐19 patients and may be a diagnostic marker for COVID‐19. 17 These studies contribute to the understanding of gene regulatory relationships and inflammatory mechanisms in the immune cells of COVID‐19 patients and lay the foundation for the discovery of new diagnostic markers for COVID‐19. However, at present, there are still few genomic studies on peripheral blood leukocytes in patients with COVID‐19, and the mechanism of the abnormal inflammatory response to SARS‐CoV‐2 infection is still not fully understood.
In this study, we obtained a blood leukocytes RNA sequencing data set (GSE157103) of COVID‐19 patients from the GEO database and performed differential expression analysis to obtain a large number of DEGs. We further screened the genes associated with SARS‐CoV‐2 infection using commonly used bioinformatics methods and constructed a six‐gene model using logistic regression analysis. We also analyzed the predictive ability of the model and the expression of the six genes to understand their expression regulation mechanism in COVID‐19. Our findings provide a reliable six‐gene model that might be helpful for the diagnosis and treatment of COVID‐19. The objectives of this study were to explore aberrantly expressed genes related to SARS‐CoV‐2 infection in peripheral blood leukocytes and to develop a diagnostic model for COVID‐19 using SARS‐CoV‐2 infection‐related genes. These findings may advance human understanding of the mechanisms of the inflammatory response following SARS‐CoV‐2 infection and also contribute to the genome‐wide search for promising targets for COVID‐19 diagnosis and treatment.
2. MATERIALS AND METHODS
2.1. Data acquisition and DEG screening
The SARS‐CoV‐2‐related sequencing data sets used in this study were all obtained from the GEO database (https://www.ncbi.nlm.nih.gov/geo/). We searched the GEO database using “SARS‐CoV‐2 or COVID‐19” as keywords to obtain COVID‐19‐related data sets. The overall information about the data sets is shown in Table 1. The GSE157103 data set sample origin is leukocytes from whole blood. We used the limma package in R language to screen for DEGs (COVID‐19 vs. non‐COVID‐19) in the GSE157103 data set with a log2|fold change (FC) | > 2 and false discovery rate (FDR) < 0.05. The GSE156063 data set sample origin is clinical naso‐/pharyngeal swab specimens. Out of the 141 non‐COVID‐19 patients in the GSE156063 data set, 100 were virus‐free patients and 41 were patients infected with other viruses. The GSE154104 data set sample origin was lung tissues from mice 2, 4, and 7 days postinfection. The GSE156063 and GSE154104 data sets were used to analyze the expression of the finally obtained genes.
Table 1.
Overall information about the data sets used in this study
2.2. Protein–protein interaction network construction and module analysis
After obtaining DEGs from the GSE157103 data set, we used the STRING database (https://string-db.org/) to construct a protein–protein interaction (PPI) network to understand the interaction between the DEGs. The MCODE plug‐in with default parameters in Cytoscape 3.7.1 was used for the PPI network module analysis. After obtaining the genes in each module, we used the DAVID database (https://david.ncifcrf.gov/) to perform Gene Ontology (GO) analysis of the module genes separately with a screening condition of p < 0.05 to understand the role of each module in COVID‐19.
2.3. Construction of the model
We extracted the expression values of the genes in the selected module based on the GSE157103 data set. We randomly divided all samples in the GSE157103 data set into the training group and the testing group at a ratio of 7:3. A Χ 2 test was used to compare the characteristics of the patients between the two groups. We performed lasso regression analysis in the training group using the glmnet package in R language to calculate the coefficients of genes and removed genes with coefficients of 0. The remaining genes were then used to construct a logistic regression model to determine whether patients were infected with SARS‐CoV‐2 by using the risk score formula: risk score = (ExpressionGENE1 × CoefficientGENE1) + (ExpressionGENE2 × CoefficientGENE2) + ⋯+(ExpressionGENEn × CoefficientGENEn) + CoefficientIntercept. We applied the logistic regression formula obtained in the training group to the testing and entire groups to calculate the risk scores and used 0.5 as the cutoff value of the high‐ and low‐risk groups. We used the pROC package to plot the ROC curve and calculate the area under the ROC curve (AUC), and we also performed principal component analysis (PCA) for each group. We calculated the sensitivity, specificity, negative predictive value, positive predictive value, and accuracy of the model in each group to assess the predictive performance of the model.
2.4. Gene expression and risk score correlation analysis
After constructing the model, we extracted data on the expression of the six genes from the GSE157103, GSE156063, and GSE154104 data sets. Moreover, the correlation between risk scores and the expression of SARS‐CoV‐2 invasion‐related genes was analyzed in the GSE157103 data set. SARS‐CoV‐2 invasion‐related genes were obtained from the Human Protein Atlas database (https://www.proteinatlas.org/humanproteome/sars-cov-2). The above analyses were conducted using R language software 3.6.1 and results were considered significant at p < 0.05.
3. RESULTS
3.1. DEG screening and PPI network module analysis
We identified 245 DEGs in the GSE157103 data set based on the criteria mentioned above, including 226 upregulated DEGs and 19 downregulated DEGs (Figure 1A). The expression heat map is shown in Figure 1B. To understand the interaction between these DEGs, we used the STRING database to construct a PPI network. After obtaining the PPI network data, we further used Cytoscape to perform a module analysis of the network (Table 2, Figure 2A).
Figure 1.
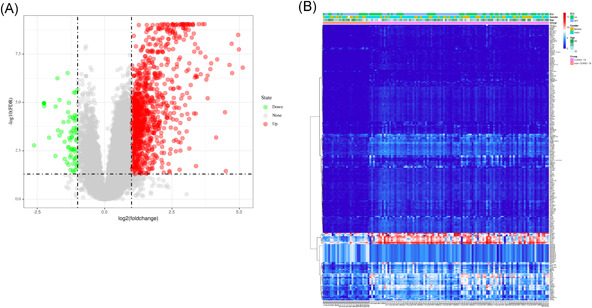
Differentially expressed genes (DEGs) screening. (A) Volcano map of DEGs. Green indicates downregulated DEGs, red indicates upregulated DEGs, and gray indicates genes without differential expression. (B) Heat map of DEGs
Table 2.
Results of the module analysis
| Module | Score | Nodes | Edges |
|---|---|---|---|
| 1 | 75.929 | 85 | 3189 |
| 2 | 14.714 | 15 | 103 |
| 3 | 9 | 9 | 36 |
| 4 | 3 | 3 | 3 |
| 5 | 3 | 3 | 3 |
Figure 2.
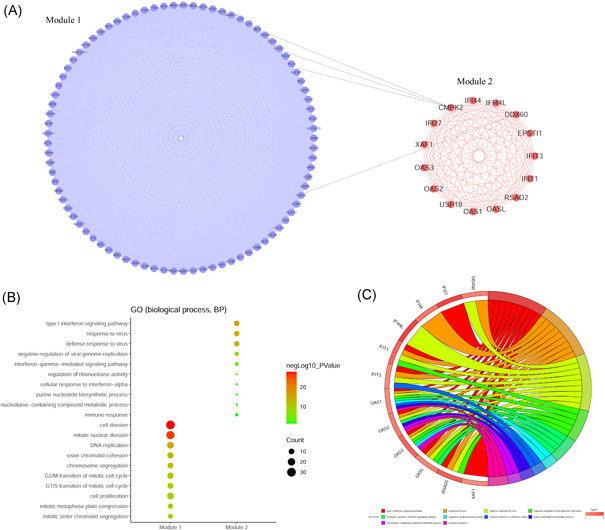
Module analysis and GO function analysis of differentially expressed genes. (A) PPI network of module 1 and module 2. (B) Top 10 results of GO functional annotation of module 1 and module 2 genes. (C) Relationship between module 2 genes and GO functional annotation. GO, Gene Ontology; PPI, protein–protein interaction
According to module analysis results, we selected the genes in the top two modules to perform GO functional annotation (biological process) to understand the roles of the two modules in SARS‐CoV‐2 infection. The analysis results showed that the genes in module 1 were mainly enriched in cell division function, while the genes in module 2 were mainly enriched in inflammation and the antiviral response (Figure 2B). The enrichment relationship between module 2 genes and GO functional annotations is shown in Figure 2C.
3.2. Construction of the prediction model
After GO functional annotation analysis of the genes in the two selected modules, we found that the genes in module 2 were related to the inflammatory response and viral resistance. Therefore, these 15 genes in module 2 were the most relevant to this study. We then extracted the expression values for these 15 genes from the GSE157103 data set and randomly divided all samples into the training group (n = 89) and testing group (n = 37) at a ratio of 7:3. The training group had 69 COVID‐19 patients, while the testing group had 31 COVID‐19 patients. We found no difference after comparing the clinical characteristics of the two groups, indicating that the grouping results were reasonable (Table 3).
Table 3.
Comparison of clinical features between the training group and testing group
| Covariates | Type | Entire | Training | Testing | p |
|---|---|---|---|---|---|
| Age | >60 | 73 (57.94%) | 49 (55.06%) | 24 (64.86%) | 0.5149 |
| ≤60 | 52 (41.27%) | 39 (43.82%) | 13 (35.14%) | ||
| Unknown | 1 (0.79%) | 1 (1.12%) | 0 (0%) | ||
| Gender | Female | 51 (40.48%) | 39 (43.82%) | 12 (32.43%) | 0.3773 |
| Male | 74 (58.73%) | 49 (55.06%) | 25 (67.57%) | ||
| Unknown | 1 (0.79%) | 1 (1.12%) | 0 (0%) | ||
| ICU | No | 60 (47.62%) | 44 (49.44%) | 16 (43.24%) | 0.6612 |
| Yes | 66 (52.38%) | 45 (50.56%) | 21 (56.76%) | ||
| Hospital‐free days | >30 | 61 (48.41%) | 46 (51.69%) | 15 (40.54%) | 0.3450 |
| ≤30 | 65 (51.59%) | 43 (48.31%) | 22 (59.46%) |
In the training group, six nonzero coefficient genes were obtained by lasso regression analysis and used as potential predictors of logistic regression analysis (Figure 3A). These six selected genes were interferon‐induced protein with tetratricopeptide repeats 3 (IFIT3), 2′–5′‐oligoadenylate synthetase‐like protein (OASL), ubiquitin‐specific protease 18 (USP18), XIAP‐associated factor 1 (XAF1), interferon alpha‐inducible protein 27 (IFI27), and epithelial‐stromal interaction 1 (EPSTI1). The gene expression obtained from the GSE157103 data set is visualized in Figure 3B.
Figure 3.
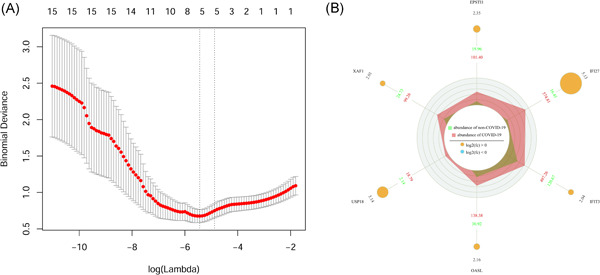
Lasso regression analysis and expression information visualization of module 2 genes. (A) The adjustment parameter (λ) selected in the lasso model is cross‐verified 10 times by the minimum standard. The Y‐axis represents the binomial deviation and the X‐axis represents log (λ). (B) Visualization of selected gene expression information. The number in the outermost circle and the size of the yellow circle indicate log2FC, and the blue and red data in the third circle indicate the average expression values of COVID‐19 and non‐COVID‐19 samples
Finally, we used logistic regression to establish a six‐gene model, and the risk score of SARS‐CoV‐2 infection was calculated by the following formula:
risk score = (−0.00318 × ExpressionIFIT3) + (0.01133 × ExpressionOASL) + (0.00015 × ExpressionUSP18) + (−0.02515 × ExpressionXAF1) + (0.00269 × ExpressionIFI27) + (0.05727 × ExpressionEPSTI1) − 0.66853. Therefore, for each patient, we obtained the expression level of these six genes and substituted these values into this formula to calculate the risk value. We then divided the patients into high‐ and low‐risk groups according to the cutoff value. We found that patients in the high‐risk group are more likely to have COVID‐19 disease, but the accuracy of the model needs to be further evaluated.
3.3. Evaluation of the prediction ability of the model
We found a positive correlation between the average expression levels of six genes and the risk scores in the training group, testing group, and entire group (Figures 4A, 4D, and 4G). We also calculated the AUC value for each group to evaluate the prediction ability of the six‐gene model. The AUC values of the training group, testing group, and entire group were 0.930, 0.914, and 0.921, respectively (Figures 4B, 4E, and 4H; Table 4). Additionally, the PCA results showed that the model could be a classifier and distinguish COVID‐19 patients from non‐COVID‐19 patients (Figures 4C, 4F, and 4I).
Figure 4.
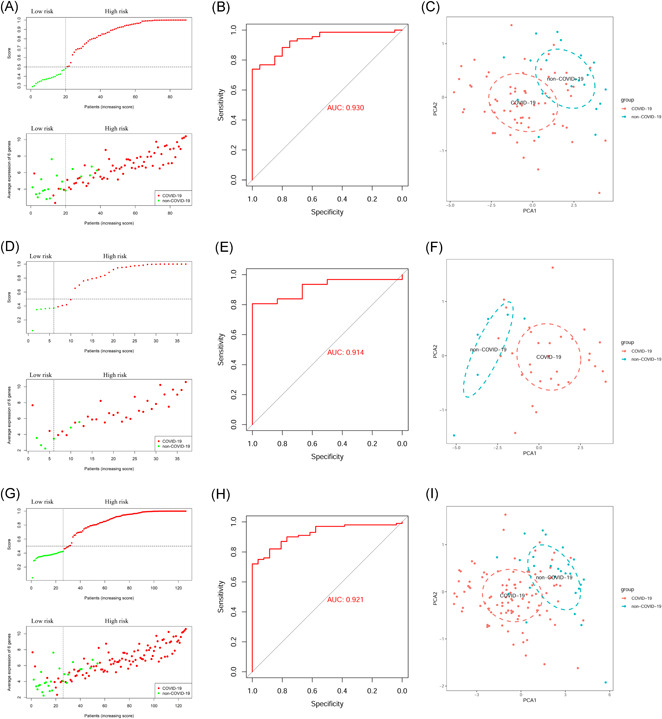
Predictive ability evaluation of the six‐gene model in the training group, testing group, and entire group. (A–C) training group; (D–F) testing group; (G–I) entire group
Table 4.
Evaluation of the prediction accuracy of the six‐gene model in each group
| Group | SE | SP | PPV | NPV | Accuracy | AUC |
|---|---|---|---|---|---|---|
| Training | 0.9275 | 0.7500 | 0.9275 | 0.7500 | 0.8876 | 0.9304 |
| Testing | 0.8387 | 0.8333 | 0.9630 | 0.5000 | 0.8378 | 0.9140 |
| Entire | 0.9000 | 0.7692 | 0.9375 | 0.6667 | 0.8730 | 0.9212 |
Abbreviations: AUC, the area under the curve; NPV, negative predictive value; PPV, positive predictive value; SE, sensitivity; SP, specificity.
We also analyzed the predictive ability of single‐gene expression and six clinical indicators for COVID‐19 infection. By comparing the AUC values, we found that the predictive ability of the individual genes and clinical indicators was lower than that of the six‐gene model (Figures 5A and 5B). We fit the six‐gene model to ferritin and fibrinogen (AUC > 0.7) to predict SARS‐CoV‐2 infection and found that the predictive ability could be further improved (AUC = 0.976; Figure 5C).
Figure 5.
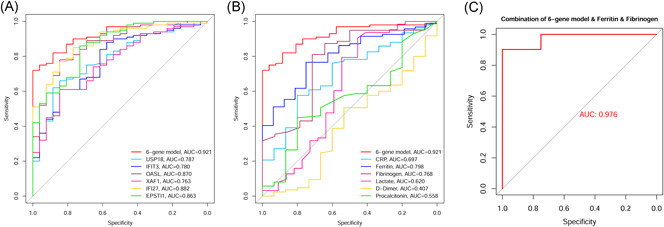
Analysis of the prediction ability of each independent index for SARS‐CoV‐2 infection. (A) Analysis of the predictive ability of the six genes individually for SARS‐CoV‐2 infection. (B) Analysis of the predictive ability of six clinical indexes for SARS‐CoV‐2 infection. (C) Predictive ability analysis after fitting the six‐gene model with ferritin and fibrinogen
These results suggested that the six‐gene model can distinguish patients into high‐ and low‐risk groups and may contribute to the detection of COVID‐19.
3.4. Expression analysis of six genes in the model
We analyzed the expression of IFIT3, OASL, USP18, XAF1, IFI27, and EPSTI1 in the GSE157103 data set. The results showed that these six genes were differentially overexpressed in SARS‐CoV‐2‐infected patients (Figure 6A), and the expression of these genes in ICU patients with SARS‐CoV‐2 infection was lower than that in non‐ICU patients with SARS‐CoV‐2 infection (Figure 6B). Moreover, the expression of these six genes was not significantly different in terms of the sex and age of the SARS‐CoV‐2‐infected patients (Figures 6C and 6D). We also analyzed the expression of these six genes in the GSE156063 data set. The results showed that the expression of these six genes in SARS‐CoV‐2‐infected patients was significantly higher than that in patients without SARS‐CoV‐2 infection (Figure 6E). We also found that the expression levels of EPSTI1, IFI27, IFIT3, and OASL in patients with other viral infections were significantly higher than those in patients with SARS‐CoV‐2 infection (Figure 6F). This indicates that these six genes are highly expressed in upper airway samples and blood leukocytes of patients with COVID‐19, and their expression may be different in patients with different severities of COVID‐19.
Figure 6.
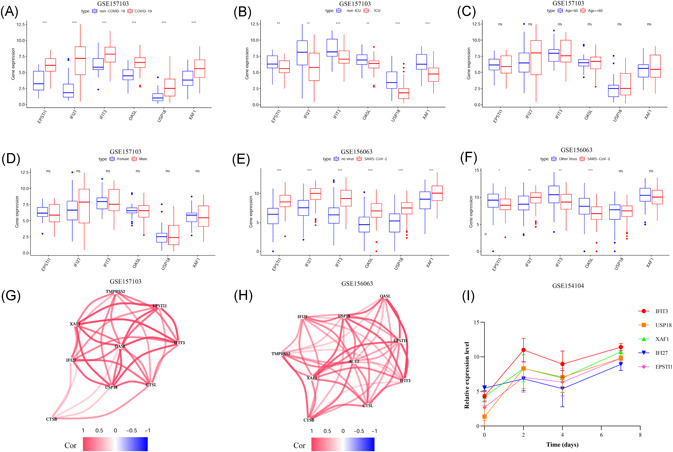
Expression analysis of six genes (A–D), Expression analysis of the six genes in the GSE157103 data set; (E, F) Expression analysis of the six genes in the GSE156063 data set; (G) Analysis of the coexpression of the six genes and SARS‐CoV‐2 infection‐related genes in the GSE157103 data set; (H) Analysis of the coexpression of the six genes and SARS‐CoV‐2 infection‐related genes in the GSE156063 data set; (I) Analysis of the expression of IFIT3, USP18, XAF1, IFI27, and EPSTI1 in the lung tissue of SARS‐CoV‐2‐infected mice in the GSE154104 data set
To understand the expression relationship between these six genes and SARS‐CoV‐2 invasion‐related genes (ACE2, TMPRSS2, CTSB, and CTSL), we performed a coexpression analysis using the GSE157103 and GSE156063 data sets and found that the expression of these six genes was positively correlated with the expression of ACE2, TMPRSS2, CTSB, and CTSL (Figures 6G and 6H). We also analyzed the expression of these six genes using SARS‐CoV‐2‐infected mouse lung tissue sequencing data from the GSE154104 data set and found that the expression of five genes (IFIT3, USP18, XAF1, IFI27, and EPSTI1) increased after SARS‐CoV‐2 infection in mice (Figure 6I). Considering that the OASL gene probe is not present in the GSE154104 data set, we did not obtain expression data for OASL from this data set. This finding suggests that these five genes are highly expressed in the lung tissues of mice with COVID‐19 and that this alteration in gene expression may be closely related to SARS‐CoV‐2 infection.
3.5. Analysis of the correlation between risk score and the expression of genes related to SARS‐CoV‐2 invasion
To further understand the relationship between the six‐gene model and SARS‐CoV‐2 infection, we analyzed the correlation between the risk score and the expression of SARS‐CoV‐2 infection‐related genes (ACE2, TMPRSS2, CTSB, and CTSL) in the GSE157103 data set. The results showed that the risk score was not significantly correlated with the expression of ACE2 (Figure 7A) but was positively correlated with the expression of TMPRSS2, CTSB, and CTSL (Figure 7B–D). The results indicate that the risk score calculated by the six‐gene model may also be closely related to SARS‐CoV‐2 infection.
Figure 7.
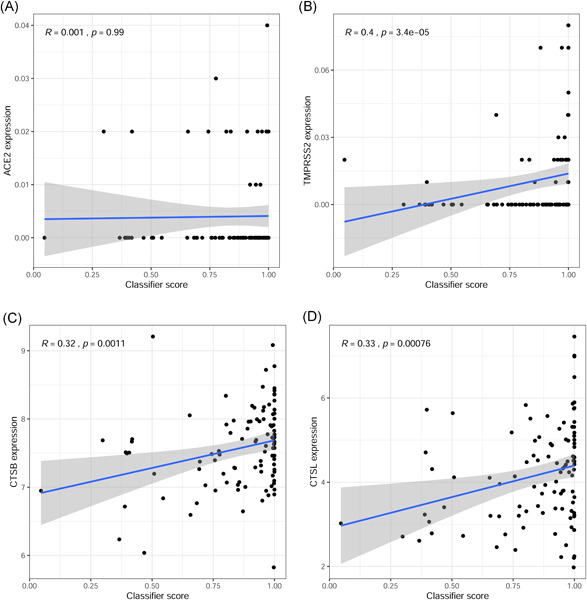
Analysis of the relationship between risk score and expression of genes related to SARS‐CoV‐2 infection in the GSE157103 data set. (A) Analysis of the correlation between risk score and ACE2 expression. (B) Analysis of the correlation between risk score and TMPRSS2 expression. (C) Analysis of the correlation between risk score and CTSB expression. (D) Analysis of the correlation between risk score and CTSL expression
4. DISCUSSION
COVID‐19 is spreading rapidly worldwide, and no specific drug has been developed for the treatment of this disease. 18 The results of routine blood examination of patients with COVID‐19 typically show increased neutrophils and decreased lymphocytes. 19 As inflammatory activators, neutrophils may participate in the overactivation of the immune response and cytokine storm. A large level of leukocyte infiltration dominated by mononuclear cells is also found in the lung tissue of COVID‐19 patients. 10 Therefore, leukocytes are involved in the body's immune response against viral invasion, and this overactivated immune response is one of the possible causes of SARS‐CoV‐2 damage to the body. Neutrophils are considered to be an indicator of severe respiratory symptoms and poor prognosis in patients with COVID‐19. 20 There are many abnormally expressed genes in peripheral blood leukocytes after SARS‐CoV‐2 infection. Therefore, the study of the function of these DEGs is of great value for the diagnosis and treatment of COVID‐19. The objectives of our study were to analyze the abnormally expressed genes in the peripheral blood leukocytes of COVID‐19 patients and construct a diagnostic model for COVID‐19.
The GEO database is a public database that consists of a variety of sequencing data sets. 21 In this study, we obtained the COVID‐19‐related data set GSE157103 from the GEO database, which consists of human blood leukocytes sequencing data from 100 COVID‐19 patients and 26 non‐COVID‐19 individuals. Using this data set, we obtained 245 DEGs in COVID‐19 patients and screened 15 DEGs associated with viral resistance by module analysis. In the following study, these 15 DEGs were used to construct a COVID‐19 prediction model composed of six genes (IFIT3, OASL, USP18, XAF1, IFI27, and EPSTI1) to diagnose COVID‐19. The AUC values of the model in the training group, testing group, and entire group were 0.930, 0.914, and 0.921, respectively. These results showed that the model has a good predictive ability, and the predictive ability of the model was higher than that of individual genes. Previous studies have shown that C‐reactive protein, ferritin, fibrinogen, d‐dimer, lactate, and procalcitonin are common clinical indicators associated with SARS‐CoV‐2 infection and severity, which can assist in the diagnosis and treatment of COVID‐19.22, 23, 24, 25 The diagnostic ability of our model is also higher than these clinical indicators in the same data set. The combined diagnostic model obtained by fitting the six‐gene model with ferritin and fibrinogen had a higher AUC value (0.976), indicating that the six‐gene model combined with ferritin and fibrinogen clinical indicators could better identify patients infected with SARS‐CoV‐2.
The expression analysis results of the six genes in the diagnostic model showed that they were all differentially highly expressed in leukocytes from SARS‐CoV‐2‐infected patients and had different expression patterns in SARS‐CoV‐2‐ and other virus‐infected patients. IFIT3 is a member of the IFIT protein family, which is composed of RNA‐binding proteins. IFIT3 is often highly expressed during the immune response against viral infection. 26 Previous studies have shown that IFIT3 is highly expressed in the pulmonary inflammatory cells of patients with COVID‐19, which is closely related to the immune response to SARS‐CoV‐2 infection.27, 28 EPSTI1, an interferon‐responsive gene, has been identified as an oncogene in human breast cancer. 29 One study found that EPSTI1 is a regulator of macrophage activation and polarization through the Stat1 and p65 pathways and regulates the inflammatory response in a mouse model. 30 OASL is widely considered to play an important role in antiviral defense mechanisms and is an interferon‐stimulating gene. 31 The results of the single‐cell sequencing analysis of neutrophils and inflammatory macrophages showed that the expression levels of EPSTI1, OASL, and IFI27 in immune cells were all increased and that these genes participated in the inflammatory response to SARS‐CoV‐2. 27 USP18 belongs to the UBP family and plays an important role in the regulation of interferon action in viral immune responses.32, 33 XAF1 is regarded as a novel binding ligand of XIAP that can reverse the antiapoptotic effect of XIAP. 34 A single‐cell sequencing study of single nucleated cells in the peripheral blood from patients with COVID‐19 and influenza revealed that XAF1 expression is upregulated in COVID‐19 patients and that the XAF1‐induced increase in T‐cell apoptosis may be associated with the TNF‐α/TNFR1 and Fas/FasL pathways. 35
To further study the expression of the six genes after SARS‐CoV‐2 infection, we analyzed the changes in their expression with the time of infection in the lung tissue sequencing data of SARS‐CoV‐2‐infected mice and found that their expression in the lung tissue increased after SARS‐CoV‐2 infection. Given that no OASL gene expression data were obtained, only five of the genes were analyzed in this study. On the basis of the analysis results, we speculate that the expression of the six genes in the model may be related to SARS‐CoV‐2 infection.
ACE2 and TMPRSS2 are key proteins required for SARS‐CoV‐2 invasion, and the inhibition of their protein activities can exert antiviral effects. 36 CTSL/B can mediate the entry of SARS‐CoV‐2 into cells through endosomes and inhibiting the expression of CTSL/CTSB can reduce the replication capacity and infectivity of the virus. 37 In this study, our results showed that the expression of the six genes in the model was positively correlated with the expression of SARS‐CoV‐2 invasion‐related genes (ACE2, TMPRSS2, CTSB, and CTSL). We also found that the risk score calculated by this model was positively correlated with the expression of TMPRSS2, CTSB, and CTSL. Therefore, these results suggested that inhibiting the expression of IFIT3, OASL, USP18, XAF1, IFI27, and EPSTI1 may reduce the risk of SARS‐CoV‐2 infection and may also have a positive effect on antiviral therapy in patients with SARS‐CoV‐2 infection.
In conclusion, this study comprehensively analyzed the blood leukocytes gene expression profile data of COVID‐19 patients by using bioinformatics methods and provided a preliminary understanding of the functions and mechanisms of DEGs in the leukocytes of COVID‐19 patients. We also constructed a six‐gene model that may contribute to the diagnosis and treatment of COVID‐19. The high expression of the six genes (IFIT3, OASL, USP18, XAF1, IFI27, and EPSTI1) in this model was closely related to SARS‐CoV‐2 infection, and these six genes may be used as diagnostic markers and therapeutic targets for COVID‐19. Our study revealed the function of these six genes in COVID‐19, which lays a foundation for the further study of the inflammatory mechanisms of the disease. However, the limitation of this study is that the sample size was small, and larger sample size is needed in the future to verify the diagnostic ability of the six‐gene model and the function of the included genes.
CONFLICT OF INTERESTS
The authors declare that there are no conflict of interests.
AUTHOR CONTRIBUTIONS
Xin Gao designed the study, performed data analysis work, and aided in writing the manuscript. Yuan Liu, Shaohui Zou, Pengqin Liu, Jing Zhao, Changshun Yang, Mingxing Liang, and Jinlian Yang edited the manuscript and prepared the figures. All authors read and approved the final manuscript.
ACKNOWLEDGMENTS
The authors thank the National Center for Biotechnology Information (NCBI) for its public data sets and its contribution to the fight against COVID‐19. Dr. Xin Gao also acknowledged his mother, Kuanfeng Xiang, for her support during the difficult time in his work and life. Here, Dr. Gao wishes his mother a healthy and happy life. This study was supported by the school‐level scientific research project of Jishou University (Jdlc2021).
Gao X, Liu Y, Zou S, et al. Genome‐wide screening of SARS‐CoV‐2 infection‐related genes based on the blood leukocytes sequencing data set of patients with COVID‐19. J Med Virol. 2021;93:5544‐5554. 10.1002/jmv.27093
REFERENCES
- 1. Li Q, Guan X, Wu P, et al. Early transmission dynamics in Wuhan, China, of novel coronavirus‐infected pneumonia. N Engl J Med. 2020. 2020;382(13):1199‐1207. 10.1056/NEJMoa2001316 [DOI] [PMC free article] [PubMed] [Google Scholar]
- 2. Ballaalla M, Merugu GP, Patel M, et al. COVID‐19, modern pandemic: a systematic review from front‐line health care providers' perspective. J Clin Med Res. 2020;12(4):215‐229. 10.14740/jocmr4142 [DOI] [PMC free article] [PubMed] [Google Scholar]
- 3. World Health Organization. WHO Coronavirus Disease (COVID‐19) Dashboard. 2021. [Data last updated: 2021/03/22]. https://covid19.who.int.
- 4. Mann R, Perisetti A, Gajendran M, Gandhi Z, Umapathy C, Goyal H. Clinical characteristics, diagnosis, and treatment of major coronavirus outbreaks. Front Med. 2020;7:581521. 10.3389/fmed.2020.581521 [DOI] [PMC free article] [PubMed] [Google Scholar]
- 5. Ye ZW, Yuan S, Yuen KS, Fung SY, Chan CP, Jin DY. Zoonotic origins of human coronaviruses. Int J Biol Sci. 2020;16(10):1686‐1697. 10.7150/ijbs.45472 [DOI] [PMC free article] [PubMed] [Google Scholar]
- 6. Farasani A. Genetic analysis of the 2019 coronavirus pandemic with from real‐time reverse transcriptase polymerase chain reaction. Saudi J Biol Sci. 2020;28(1):911‐916. 10.1016/j.sjbs.2020.11.035 [DOI] [PMC free article] [PubMed] [Google Scholar]
- 7. Songong L, Liang EY, Wang HM, et al. Differential diagnosis and prospective grading of COVID‐19 at the early stage with simple hematological and biochemical variables. Diagn Microbiol Infect Dis. 2020;99(2):115169. 10.1016/j.diagmicrobio.2020.115169 [DOI] [PMC free article] [PubMed] [Google Scholar]
- 8. Chenhen N, Zhou M, Dong X, et al. Epidemiological and clinical characteristics of 99 cases of 2019 novel coronavirus pneumonia in Wuhan, China: a descriptive study. Lancet. 2020;395(10223):507‐513. 10.1016/S0140-6736(20)30211-7 [DOI] [PMC free article] [PubMed] [Google Scholar]
- 9. Sahu KK, Cerny J. A review on how to do hematology consults during COVID‐19 pandemic. Blood Rev. 2020;47:100777. 10.1016/j.blre.2020.100777 [DOI] [PMC free article] [PubMed] [Google Scholar]
- 10. Xu Z, Shi L, Wang Y, et al. Pathological findings of COVID‐19 associated with acute respiratory distress syndrome. Lancet Respir Med. 2020;8(4):420‐422. [DOI] [PMC free article] [PubMed] [Google Scholar]
- 11. Li C, Hu X, Li L, Li J. Differential microRNA expression in the peripheral blood from human patients with COVID‐19. J Clin Lab Anal. 2020;34(10):e23590. 10.1002/jcla.23590 [DOI] [PMC free article] [PubMed] [Google Scholar]
- 12. Poran A, Harjanto D, Malloy M, et al. Sequence‐based prediction of SARS‐CoV‐2 vaccine targets using a mass spectrometry‐based bioinformatics predictor identifies immunogenic T cell epitopes. Genome Med. 2020;12(1):70. 10.1186/s13073-020-00767-w [DOI] [PMC free article] [PubMed] [Google Scholar]
- 13. Schultheiß C, Paschold L, Simnica D, et al. Next‐generation sequencing of T and B cell receptor repertoires from COVID‐19 patients showed signatures associated with severity of disease. Immunity. 2020;53(2):442‐455. 10.1016/j.immuni.2020.06.024 [DOI] [PMC free article] [PubMed] [Google Scholar]
- 14. Zeng F, Deng G, Cui Y, et al. A predictive model for the severity of COVID‐19 in elderly patients. Aging. 2020;12(21):20982‐20996. 10.18632/aging.103980 [DOI] [PMC free article] [PubMed] [Google Scholar]
- 15. Overmyervermyer KA, Shishkova E, Miller IJ, et al. Large‐scale multi‐omic analysis of COVID‐19 severity. Cell Syst. 2021;12(1):23‐40. 10.1016/j.cels.2020.10.003 [DOI] [PMC free article] [PubMed] [Google Scholar]
- 16. Li C, Chen J, Lv S, Li J, Li L, Hu X. Whole‐transcriptome RNA sequencing reveals significant differentially expressed mRNAs, miRNAs, and lncRNAs and related regulating biological pathways in the peripheral blood of COVID‐19 patients. Mediators Inflamm. 2021;2021:6635925. 10.1155/2021/6635925 [DOI] [PMC free article] [PubMed] [Google Scholar]
- 17. Derakhshani A, Hemmat N, Asadzadeh Z, et al. Arginase 1 (Arg1) as an up‐regulated gene in COVID‐19 patients: a promising marker in COVID‐19 immunopathy. J Clin Med. 2021;10(5):1051. 10.3390/jcm10051051 [DOI] [PMC free article] [PubMed] [Google Scholar]
- 18. Linin KJ, Schneeweiss S, Tesfaye H, et al. Pharmacotherapy for hospitalized patients with COVID‐19: treatment patterns by disease severity. Drugs. 2020;80(18):1961‐1972. 10.1007/s40265-020-01424-7 [DOI] [PMC free article] [PubMed] [Google Scholar]
- 19. Xu X, Wu X, Jiang X, et al. Clinical findings in a group of patients infected with the 2019 novel coronavirus (SARS‐Cov‐2) outside of Wuhan, China: retrospective case series. BMJ (Clin Res Ed). 2020;368:m606. 10.1136/bmj.m606 [DOI] [PMC free article] [PubMed] [Google Scholar]
- 20. Wang J, Jiang M, Chen X, Montaner LJ. Cytokine storm and leukocyte changes in mild versus severe SARS‐CoV‐2 infection: review of 3939 COVID‐19 patients in China and emerging pathogenesis and therapy concepts. J Leukoc Biol. 2020;108(1):17‐41. 10.1002/JLB.3COVR0520-272R [DOI] [PMC free article] [PubMed] [Google Scholar]
- 21. Edgar R, Domrachev M, Lash AE. Gene Expression Omnibus: NCBI gene expression and hybridization array data repository. Nucleic Acids Res. 2002;30(1):207‐210. 10.1093/nar/30.1.207 [DOI] [PMC free article] [PubMed] [Google Scholar]
- 22. Caoao P, Wu Y, Wu S, et al. Elevated serum ferritin level effectively discriminates severity illness and liver injury of coronavirus disease 2019 pneumonia. Biomarkers. 2020;7:1‐18. 10.1080/1354750X.2020.1861098 [DOI] [PMC free article] [PubMed] [Google Scholar]
- 23. Ren L, Yao D, Cui Z, Chen S, Yan H. Corona Virus Disease 2019 patients with different disease severity or age range: a single‐center study of clinical features and prognosis. Medicine. 2020;99(49):e22899. 10.1097/MD.0000000000022899 [DOI] [PMC free article] [PubMed] [Google Scholar]
- 24. Singh K, Mittal S, Gollapudi S, Butzmann A, Kumar J, Ohgami RS. A meta‐analysis of SARS‐CoV‐2 patients identifies the combinatorial significance of D‐dimer, C‐reactive protein, lymphocyte, and neutrophil values as a predictor of disease severity. Int J Lab Hematol. 2020;43:324‐328. 10.1111/ijlh.13354 [DOI] [PMC free article] [PubMed] [Google Scholar]
- 25. Zhang X, Yang X, Jiao H, Liu X. Coagulopathy in patients with COVID‐19: a systematic review and meta‐analysis. Aging. 2020;12:24535‐24551. 10.18632/aging.104138 [DOI] [PMC free article] [PubMed] [Google Scholar]
- 26. Fleith RC, Mears HV, Leong XY, et al. IFIT3 and IFIT2/3 promote IFIT1‐mediated translation inhibition by enhancing binding to non‐self RNA. Nucleic Acids Res. 2018;46(10):5269‐5285. 10.1093/nar/gky191 [DOI] [PMC free article] [PubMed] [Google Scholar]
- 27. Shaath H, Vishnubalaji R, Elkord E, Alajez NM. Single‐cell transcriptome analysis highlights a role for neutrophils and inflammatory macrophages in the pathogenesis of severe COVID‐19. Cells. 2020;9(11):2374. 10.3390/cells9112374 [DOI] [PMC free article] [PubMed] [Google Scholar]
- 28. Vishnubalaji R, Shaath H, Alajez NM. Protein coding and long noncoding RNA (lncRNA) transcriptional landscape in SARS‐CoV‐2 infected bronchial epithelial cells highlight a role for interferon and inflammatory response. Genes. 2020;11(7):760. 10.3390/genes11070760. [DOI] [PMC free article] [PubMed] [Google Scholar]
- 29. De Neergaard M, Kim J, Villadsen R, et al. Epithelial‐stromal interaction 1 (EPSTI1) substitutes for peritumoral fibroblasts in the tumor microenvironment. Am J Pathol. 2010;176(3):1229‐1240. 10.2353/ajpath.2010.090648 [DOI] [PMC free article] [PubMed] [Google Scholar]
- 30. Kim Y, Lee J, Hahn M. Regulation of inflammatory gene expression in macrophages by epithelial‐stromal interaction 1 (Epsti1). Biochem Biophys Res Commun. 2018;496(2):778‐783. 10.1016/j.bbrc.2017.12.014 [DOI] [PubMed] [Google Scholar]
- 31. Leisching G, Ali A, Cole V, Baker B. 2'−5'‐Oligoadenylate synthetase‐like protein inhibits intracellular M. tuberculosis replication and promotes proinflammatory cytokine secretion. Mol Immunol. 2020;118:73‐78. 10.1016/j.molimm.2019.12.004 [DOI] [PubMed] [Google Scholar]
- 32. Li L, Lei Q, Zhang S, Kong L, Qin B. Suppression of USP18 potentiates the anti‐HBV activity of interferon alpha in HepG2.2.15 cells via JAK/STAT signaling. PLOS One. 2016;11(5):e0156496. 10.1371/journal.pone.0159019 [DOI] [PMC free article] [PubMed] [Google Scholar]
- 33. Malakhova OA, Kim KI, Luo JK, et al. UBP43 is a novel regulator of interferon signaling independent of its ISG15 isopeptidase activity. EMBO J. 2006;25(11):2358‐2367. 10.1038/sj.emboj.7601149 [DOI] [PMC free article] [PubMed] [Google Scholar]
- 34. Lin B, Xu D, Leaman DW. X‐linked inhibitor of apoptosis‐associated factor 1 regulates TNF receptor 1 complex stability. FEBS Lett. 2016;590(23):4381‐4392. 10.1002/1873-3468.12467 [DOI] [PMC free article] [PubMed] [Google Scholar]
- 35. Zhu L, Yang P, Zhao Y, et al. Single‐cell sequencing of peripheral mononuclear cells reveals distinct immune response landscapes of COVID‐19 and influenza patients. Immunity. 2020;53(3):685‐696. 10.1016/j.immuni.2020.07.009 [DOI] [PMC free article] [PubMed] [Google Scholar]
- 36. Hoffmann M, Kleine‐Weber H, Schroeder S, et al. SARS‐CoV‐2 cell entry depends on ACE2 and TMPRSS2 and is blocked by a clinically proven protease inhibitor. Cell. 2020;181(2):271‐280. 10.1016/j.cell.2020.02.052 [DOI] [PMC free article] [PubMed] [Google Scholar]
- 37. Smieszek SP, Przychodzen BP, Polymeropoulos MH. Amantadine disrupts lysosomal gene expression: a hypothesis for COVID19 treatment. Int J Antimicrob Agents. 2020;55(6):106004. 10.1016/j.ijantimicag.2020.106004 [DOI] [PMC free article] [PubMed] [Google Scholar]


