

Abstract
Objective
Adipose tissue plays a role in the novel coronavirus disease 2019 (COVID‐19). Epicardial adipose tissue (EAT), a unique visceral fat, presents with a high degree of inflammation in severe COVID‐19. Whether and how adipose tissue may respond to the COVID‐19 therapies is unknown.
Methods
The difference in computed tomography‐measured EAT and subcutaneous (SAT) attenuation, defined as mean attenuation expressed in Hounsfield units (HU), was retrospectively analyzed in 72 patients (mean [SD] age was 59.6 [12.4] years, 50 patients [69%] were men) at the hospital admission for COVID‐19 and 99 days (interquartile range = 71‐129) after discharge.
Results
At the admission, EAT‐HU was significantly correlated with blood glucose levels, interleukin 6, troponin T levels, and waist circumference. EAT‐HU decreased from −87.21 (16.18) to −100.0 (11) (p < 0.001), whereas SAT‐HU did not change (−110.21 [12.1] to −111.11 [27.82]; p = 0.78) after therapy. Changes in EAT‐HU (expressed as ∆) significantly correlated with dexamethasone therapy (r = −0.46, p = 0.006) and when dexamethasone was combined with tocilizumab (r = −0.24, p = 0.04).
Conclusions
Dexamethasone therapy was associated with significant reduction of EAT inflammation in COVID‐19 patients, whereas SAT showed no changes. Anti‐inflammatory therapies targeting visceral fat may be helpful in COVID‐19.
Study Importance.
What is already known?
-
►
Individuals with visceral obesity are at higher risk of more serious coronavirus disease 2019 (COVID‐19) complications.
-
►
Epicardial adipose tissue (EAT), the visceral fat depot of the heart, has been suggested to play a role in COVID‐19.
-
►
Higher EAT inflammation, measured by computed tomography (CT) attenuation, is associated with more severe COVID‐19.
What does this study add?
-
►
CT‐measured EAT attenuation was high at hospital admission and then normalized after discharge in COVID‐19 patients.
-
►
Among the different COVID‐19 therapies, CT‐measured EAT inflammation reduction was stronger in patients who received dexamethasone.
-
►
Subcutaneous fat did not change with COVID‐19 therapies.
How might these results change the focus of clinical practice?
-
►
EAT is a measurable and responsive target to COVID‐19 therapies.
-
►
Anti‐inflammatory therapies targeting EAT may be helpful in COVID‐19.
INTRODUCTION
Obesity plays an important role in the coronavirus disease 2019 (COVID‐19) (1). Individuals with obesity, particularly those with predominant visceral adipose tissue (VAT) accumulation, are at higher risk of more serious COVID‐19 complications (2). Adipose tissue appears to serve as a reservoir for viral spread and inflammatory response amplification (3). However, whether and how adipose tissue may respond to the COVID‐19 therapies is unknown.
We sought to evaluate the effects of various therapeutic COVID‐19 protocols on epicardial adipose tissue (EAT). We focused our attention to this visceral fat depot for a number of reasons. EAT is a peculiar adipose tissue with highly inflammatory infiltrate, transcriptome, and proteasome (4, 5). Computed tomography (CT)‐measured EAT attenuation is a novel marker of cardiovascular risk, as it reflects inflammatory changes within the fat depot itself and is increased in patients with coronary artery disease (6, 7). EAT has been suggested to play a role in COVID‐19 cardiomyopathy (8), and we and others have associated EAT density with COVID‐19 severity (9, 10, 11). Last, but not least, EAT rapidly and significantly responds to drugs targeting the fat (12).
Therefore, we hypothesize that COVID‐19 hospital therapies may change EAT density in patients who were admitted for COVID‐19.
METHODS
Study design
This was a retrospective, multicenter study. Patients’ data were collected from the electronic medical records at the admission, during the hospitalization and after the discharge. Owing to the retrospective nature of this analysis, informed consent was deemed as not necessary and was waived, as approved by the local ethical committee (Ethics Committee of San Raffaele Clinical Research Hospital). Patient confidentiality was protected by assigning anonymous identification codes.
Study population
We analyzed patients with a confirmed diagnosis of COVID‐19 who were admitted to the Azienda Socio‐Sanitaria Territorial Santi Paolo and Carlo Hospital (center 1) and Istituto Ricovero e Cura a Carattere Scientifico San Donato Polyclinic (center 2) from March 3, 2020, to July 9, 2020. A total of 427 patients met the following inclusion criteria: 1) diagnosis of COVID‐19 confirmed with reverse‐transcriptase polymerase‐chain‐reaction assay of a specimen collected on a nasopharyngeal swab; 2) chest CT imaging suggestive of COVID‐19 pneumonia; and 3) age >18 years. COVID‐19 severity was rated according to the latest World Health Organization guidelines (13). After discharge, patients were scheduled for a follow‐up CT scan as per hospital protocol. Patients who could not return for the follow‐up CT or who had a poor‐quality image were excluded. A total of 72 patients were eventually included in the analysis.
CT imaging of EAT
Chest CT images were retrospectively analyzed for EAT measurement at hospital admission and at follow‐up. Non‐contrast images were evaluated. Scan protocol was optimized for lung evaluation, and no electrocardiogram gating was used. Two expert radiologists (FS and ST) independently interpreted the images. First, each reader chose the axial slice that allowed the best visualization of EAT in the anterior interventricular sulcus at the mid‐level of the left anterior descending coronary artery. EAT and subcutaneous adipose tissue (SAT) attenuation were defined as mean attenuation expressed in Hounsfield units (HU). A region of interest was placed in the EAT, visualized in the anterior interventricular sulcus and in the anterior thorax SAT to obtain the HU value, as previously described (9). Coronary artery calcification score was also calculated, as previously described (9).
Lung involvement score
The percentage of each lung zone involvement was scored using the following system: 0 = no involvement; 1 = <25%; 2 = 26% to 50%; 3 = 51% to 75%; and 4 = >75%. Total lung involvement score was calculated by summing scores of all of the three zones of the two lungs (maximum score = 24), as previously described (14).
Drug therapy during hospitalization
During the hospitalization, patients received the following therapies, combined or in monotherapy:
1) oral or intravenous (IV) dexamethasone 6 mg once daily for up to 10 days (15); 2) hydroxychloroquine 200 mg three times daily for 7 to 10 days and azithromycin 500 mg once daily for 7 to 10 days (16); 3) remdesevir 200 mg on day 1 followed by 100 mg once daily for the subsequent 5 or 10 days (17); 4) lopinavir 200 mg or ritonavir 50 mg twice daily for 5 to 7 days (18); 5) tocilizumab (8 mg/Kg, IV not exceeding 800 mg) (19); or 6) enoxaparin 4,000 UI daily for up to 14 days.
Statistical analysis
Continuous variables are presented as means with their standard deviations or medians for skewed data with interquartile range or percentage. Differences in the study parameters were evaluated with multiple t tests with 95% confidence intervals. The difference in EAT‐HU and other parameters before and after the hospital treatment was calculated as delta (∆). Relationships between study variables were calculated using univariate regression analysis with Pearson or Spearman (Rho) coefficient for skewed data with two‐tailed p < 0.05 indicating statistical significance. Multivariate regression analyses were performed to evaluate which therapy most relevantly changed EAT attenuation and which laboratory value was independently related to EAT attenuation at baseline. Statistical analysis was performed using SPSS version 26 (IBM Corp., Armonk, New York).
Results
Baseline characteristics of patients are reported in Table 1.
TABLE 1.
Baseline characteristics of total population and stratified by dexamethasone exposure
| Total population (n = 72) | Dexamethasone exposure (n = 33) | No dexamethasone exposure (n = 39) | p value | |
|---|---|---|---|---|
| Demographic information | ||||
| Age (y) | 59.6 ± 12.4 | 60.7 ± 12.7 | 58.8 ± 12.2 | 0.522 |
| Gender | 0.285* | |||
| Male | 50 (69.0) | 25 (75.8) | 25 (64.1) | |
| Female | 22 (31.0) | 8 (24.2) | 14 (35.9) | |
| Smoking | 0.338* | |||
| Current smoker | 11 (15.3) | 7 (21.2) | 4 (10.3) | |
| Former smoker | 17 (23.6) | 6 (18.2) | 11 (28.2) | |
| Never smoked | 44 (61.1) | 20 (60.6) | 24 (61.5) | |
| Anthropometric measures | ||||
| Weight (kg) | 81.9 ± 15.4 | 85.0 ± 15.4 | 79.2 ± 15.0 | 0.105 |
| Height (cm) | 170.7 ± 10.4 | 172.4 ± 11.0 | 169.2 ± 9.7 | 0.187 |
| Waist (cm) | 100.3 ± 12.4 | 101.8 ± 12.8 | 99.0 ± 12.1 | 0.340 |
| Waist male (cm) | 102.8 ± 10.3 | 102.3 ± 10.8 | 103.2 ± 10.1 | 0.757 |
| Waist female (cm) | 94.7 ± 15.0 | 100.4 ± 18.7 | 91.5 ± 12.0 | 0.187 |
| WHtR | 0.6 ± 0.1 | 0.6 ± 0.1 | 0.6 ± 0.1 | 0.693 |
| BMI (kg/m2) | 28.2 ± 5.4 | 28.8 ± 5.9 | 27.7 ± 5.0 | 0.386 |
| Adiposity status | ||||
| Abdominal obesity | 0.782* | |||
| Yes | 38 (52.8) | 18 (54.5) | 20 (51.3) | |
| No | 34 (47.2) | 15 (45.8) | 19 (48.7) | |
| BMI classes | 0.625* | |||
| Underweight | 1 (1.4) | 1 (3.0) | 0 (0.0) | |
| Normal weight | 23 (31.9) | 9 (27.3) | 14 (35.9) | |
| Overweight | 26 (36.1) | 12 (36.4) | 14 (35.9) | |
| General obesity | 22 (36.6) | 11 (33.3) | 11 (28.2) | |
| Comorbidities | ||||
| Hypertension | 29 (40.3) | 11 (33.3) | 18 (46.2) | 0.269* |
| Diabetes mellitus | 6 (8.3) | 2 (6.1) | 4 (10.3) | 0.521* |
| Ischemic cardiomyopathy | 12 (16.7) | 5 (15.2) | 7 (17.9) | 0.751* |
| Dyslipidemia | 6 (8.3) | 4 (12.1) | 2 (5.1) | 0.285* |
| Cancer | 1 (1.4) | 0 (0.0) | 1 (2.6) | 0.354* |
| Bronchial asthma | 1 (1.4) | 1 (3.0) | 0 (0.0) | 0.274* |
| Chronic obstructive pulmonary disease | 0 (0.0) | 0 (0.0) | 0 (0.0) | 0.905* |
| Clinical features | ||||
| EAT‐HU | −88 (−101 to −76) | −88 (−102 to −81) | −89 (−98 to −76) | 0.727 |
| SAT‐HU | −110 (−116 to −102) | −112 (−121 to −101) | −107 (−115 to −103) | 0.199 |
| SpO2 (%) at admission | 90 (85 to 96) | 88 (83 to 90) | 90 (86 to 98) | 0.036 |
| Oxygen support | 0.028* | |||
| Room air | 5 (6.9) | 3 (9.4) | 2 (5.1) | |
| Nasal cannulae | 15 (20.8) | 2 (6.3) | 13 (33.3) | |
| Simple mask or reservoir | 12 (16.7) | 5 (15.6) | 7 (17.9) | |
| Boussignac mask | 8 (11.1) | 2 (6.3) | 6 (15.4) | |
| CPAP | 20 (27.8) | 12 (37.5) | 8 (20.5) | |
| NIMV | 9 (12.5) | 7 (21.9) | 2 (5.1) | |
| IMV | 3 (4.2) | 2 (6.3) | 1 (2.6) | |
| Illness severity | 0.005* | |||
| Mild | 5 (6.9) | 3 (9.4) | 2 (5.1) | |
| Moderate | 15 (20.8) | 2 (6.3) | 13 (33.3) | |
| Severe | 20 (27.8) | 7 (21.9) | 13 (33.3) | |
| Critical | 32 (44.4) | 21 (65.6) | 11 (28.2) | |
| ICU | 7 (9.7) | 4 (12.1) | 3 (7.7) | 0.527 |
| Days of hospitalization | 20 (9‐27) | 22 (15‐33) | 14 (8‐25) | 0.058 |
Data are presented as mean ± SD, median (interquartile range), and frequency (percentage) to compare variables between different groups. A t test or *χ2 test was used for categorial variables. Data shown in bold are statistically significant (p < 0.05).
Abbreviations: CPAP, continuous airway pressure; EAT‐HU, epicardial adipose tissue in Hounsfield units; ICU, intensive care unit; IMV, invasive mechanical ventilation; NIMV, noninvasive mechanical ventilation; EAT‐HU, subcutaneous adipose tissue in Hounsfield units; SpO2, oxygen saturation; WHtR, waist to height ratio.
Changes with hospital treatment
At follow‐up, 99 days (interquartile range = 71‐129) after discharge, EAT‐HU decreased from −87.21 (16.18) to −100.0 (11; p < 0.001; 95% CI: 9.89‐15.83), whereas SAT‐HU did not change (−110.21 [12.1] to −111.11 [27.82], p = 0.78) after therapy (Figure 1). CT‐measured EAT thickness also reduced from 6.2 (2.2) to 5.9 (2.4) mm (p = 0.03, 95% CI: 0.023‐0.677 after therapy); as expected, c‐reactive‐protein significantly decreased from 79.0 (50.29) to 6.3 (4.5; p < 0.001; 95% CI: 60.61‐84.72 between hospital admission and follow‐up. Neither BMI nor waist circumference significantly changed during the admission (from 28.1 [5.4] to 27.5 [4] kg/m2; from 100.3 [11] to 100 [10] cm, respectively).
FIGURE 1.
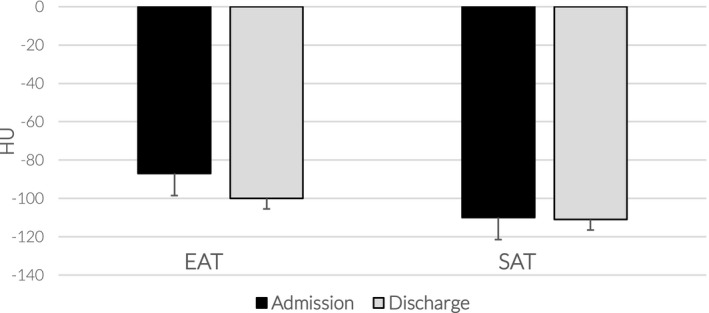
EAT and SAT density between admission and discharge. Changes in epicardial (EAT) and subcutaneous adipose tissue (SAT) density expressed in Hounsfield units (HU) between hospital admission (black columns) and approximately 3 months after discharge (gray columns). EAT‐HU changed significantly (p < 0.001), whereas SAT remained unchanged. Data are represented as median (interquartile range)
Correlates of EAT‐HU at the admission
At the admission, EAT‐HU was strongly correlated with blood glucose levels (r = −0.70, p < 0.01), interleukin 6 (IL‐6; r = −0.48, p < 0.01), troponin T levels (r = −0.36, p < 0.01), waist circumference (r = −0.37, p < 0.01), and age (r = −0.30, p < 0.01), whereas there was no significant correlation with BMI, gender, preexisting conditions, or coronary artery calcification score.
Correlation of the changes with the therapeutic protocol
We looked at the correlation between the different hospital therapeutic protocols and EAT‐HU changes, expressed as ∆, between the admission and follow‐up. A total of 33 out of the 72 patients received dexamethasone, 11 patients received dexamethasone combined with tocilizumab, and 21 patients used lopinavir or ritonavir, whereas 60 patients were treated with hydroxychloroquine. EAT‐HU reduction was greater in those who received dexamethasone compared with any of the other therapies (p < 0.01; Figure 2). When data were analyzed in patients who received combined or multiple therapies, EAT‐HU reduction was substantially similar between the combined drugs and dexamethasone monotherapy. ∆EAT‐HU significantly correlated with the dexamethasone therapy (r = −0.46, p = 0.006), and when dexamethasone was combined with tocilizumab (r = −0.24, p = 0.04) and with oxygen therapy (r = −0.23, p = 0.04), although the last two correlations were milder. No statistically significant correlations between the other treatments and ∆EAT‐HU were observed. ∆EAT‐HU was also associated with lung involvement score at follow‐up (r = −0.27, p = 0.017), whereas there was no relationship between ∆EAT‐HU and days of the admission. Multivariate regression analysis confirmed that dexamethasone therapy was the best independent correlate of EAT attenuation change (β coeffient = −0.46, t value = −3.88, p < 0.01).
FIGURE 2.
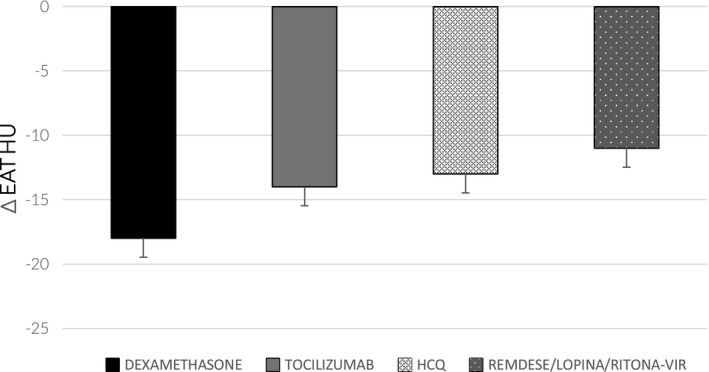
EAT‐HU changes in relation to therapy. Changes in epicardial adipose tissue (EAT) density expressed in Hounsfield units (HU) in relation to each single therapy. ∆EAT‐HU was higher in those who received dexamethasone (p < 0.01) compared with those treated with tocilizumab, hydroxychloroquine (HCQ), remdesevir, lopinavir, or ritonavir. Data are represented as median (interquartile range)
DISCUSSION
This is the first analysis, to our knowledge, reporting EAT inflammatory changes in response to various COVID‐19 therapies in admitted patients. CT‐measured EAT attenuation was significantly elevated at the admission and then dramatically reduced to substantially normal values after the discharge. On the contrary, we found no changes in SAT inflammation with the various COVID‐19 therapies. Among the different therapeutic protocols, we found that CT‐EAT inflammation reduction was stronger in patients who received dexamethasone.
We and other groups recently reported that EAT inflammation is related to COVID‐19 severity (9, 10, 11). In this study, we showed that EAT is not only a marker of inflammation, but that it can serve as a therapeutic target for anti‐inflammatory treatment and particularly for dexamethasone.
The lack of changes within SAT reinforces the hypothesis that VAT is a more sensitive target in COVID‐19, as previously suggested (2).
Adipose tissue is a well‐known target of glucocorticoids. If long‐term corticosteroids use undoubtedly increases adipogenesis, their effect on the adipocytes is more complex. It is likely that EAT density reduction is associated with the dexamethasone anti‐inflammatory effects and is certainly not related to the weight loss, as these COVID‐19 patients did not lose any significant weight during the hospitalization. Interestingly, some studies have suggested a lipolytic and brown‐fat‐like effect of acute glucocorticoids (20), and EAT displays brown‐fat‐like properties; therefore, steroids may speed up EAT metabolism and free fatty acids mobilization, ultimately causing a reduction in EAT inflammation. Although dexamethasone produced the greatest change in EAT‐HU, the anti‐inflammatory effect of the IL‐6 inhibitor tocilizumab could contribute to reduced EAT attenuation.
The correlation of EAT attenuation with hyperglycemia, IL‐6, and troponin levels suggests its use as an early imaging marker of COVID‐19‐related inflammation and myocardial damage.
This analysis, like many COVID‐19 studies, has several limitations. The independent effect of dexamethasone or other therapies on EAT should be assessed with randomized clinical trials. Most of these patients received multiple therapies; therefore, it is difficult to discriminate whether EAT changes were related to the combined effects or whether one drug was predominant. Patients had the follow‐up CT approximately 3 months after discharge. Although we cannot rule out the potential confounding effects of other factors, patients were certainly off any of the COVID‐19 therapies after the discharge.
CONCLUSION
In conclusion, dexamethasone therapy was associated with a significant reduction of EAT inflammation in COVID‐19 patients, whereas SAT showed no changes. Anti‐inflammatory therapies targeting VAT may be helpful in COVID‐19.
CONFLICT OF INTEREST
The authors declared no conflict of interest.
Iacobellis G, Malavazos AE, Basilico S, et al. Epicardial fat inflammation response to COVID‐19 therapies. Obesity (Silver Spring). 2021;29:1427–1433. 10.1002/oby.23232
Gianluca Iacobellis and Alexis Elias Malavazos are co‐first authors.
REFERENCES
- 1. Iacobellis G, Malavazos AE, Ferreira T. COVID‐19 rise in younger adults with obesity: visceral adiposity can predict the risk. Obesity (Silver Spring). 2020;28:1795. [DOI] [PMC free article] [PubMed] [Google Scholar]
- 2. Malavazos AE, Corsi Romanelli MM, Bandera F, Iacobellis G. Targeting the adipose tissue in COVID‐19. Obesity (Silver Spring). 2020;28:1178‐1179. [DOI] [PMC free article] [PubMed] [Google Scholar]
- 3. Ryan PM, Caplice NM. Is adipose tissue a reservoir for viral spread, immune activation, and cytokine amplification in coronavirus disease 2019? Obesity (Silver Spring). 2020;28:1191‐1194. [DOI] [PMC free article] [PubMed] [Google Scholar]
- 4. McAninch EA, Fonseca TL, Poggioli R, et al. Epicardial adipose tissue has a unique transcriptome modified in severe coronary artery disease. Obesity (Silver Spring). 2015;23:1267‐1278. [DOI] [PMC free article] [PubMed] [Google Scholar]
- 5. Iacobellis G, Malavazos AE, Corsi MM. Epicardial fat: from the biomolecular aspects to the clinical practice. Int J Biochem Cell Biol. 2011;43:1651‐1654. [DOI] [PubMed] [Google Scholar]
- 6. Iacobellis G, Mahabadi AA. Is epicardial fat attenuation a novel marker of coronary inflammation? Atherosclerosis. 2019;284:212‐213. [DOI] [PubMed] [Google Scholar]
- 7. Mahabadi AA, Balcer B, Dykun I, et al. Cardiac computed tomography‐derived epicardial fat volume and attenuation independently distinguish patients with and without myocardial infarction. PLoS One. 2017;12:e0183514. doi: 10.1371/journal.pone.0183514 [DOI] [PMC free article] [PubMed] [Google Scholar]
- 8. Malavazos AE, Goldberger JJ, Iacobellis G. Does epicardial fat contribute to COVID‐19 myocardial inflammation? Eur Heart J. 2020;41:2333. doi:10.1093/eurheartj/ehaa471 [DOI] [PMC free article] [PubMed] [Google Scholar]
- 9. Iacobellis G, Secchi F, Capitanio G, et al. Epicardial fat inflammation in severe COVID‐19. Obesity (Silver Spring). 2020;28:2260‐2262. [DOI] [PubMed] [Google Scholar]
- 10. Deng M, Qi Y, Deng L, et al. Obesity as a potential predictor of disease severity in young COVID‐19 patients: a retrospective study. Obesity (Silver Spring). 2020;28:1815‐1825. [DOI] [PMC free article] [PubMed] [Google Scholar]
- 11. Grodecki K, Lin A, Razipour A, et al. Epicardial adipose tissue is associated with extent of pneumonia and adverse outcomes in patients with COVID‐19. Metabolism. 2021;115:154436. doi: 10.1016/j.metabol.2020.154436 [DOI] [PMC free article] [PubMed] [Google Scholar]
- 12. Iacobellis G, Mohseni M, Bianco S, Banga PK. Liraglutide causes large and rapid epicardial fat reduction. Obesity (Silver Spring). 2017;25:311‐316. [DOI] [PubMed] [Google Scholar]
- 13. World Health Organization . COVID‐19 CLINICAL MANAGEMENT: LIVING GUIDANCE. WHO; 2021.
- 14. Wong HYF, Lam HYS, Fong A‐T, et al. Frequency and distribution of chest radiographic findings in patients positive for COVID‐19. Radiology. 2020;296:E72‐E78. [DOI] [PMC free article] [PubMed] [Google Scholar]
- 15. RECOVERY Collaborative Group , Horby P, Lim WS, et al. Dexamethasone in hospitalized patients with covid‐19. N Engl J Med. 2021;384:693‐704. [DOI] [PMC free article] [PubMed] [Google Scholar]
- 16. Cavalcanti AB, Zampieri FG, Rosa, RG et al. Hydroxychloroquine with or without azithromycin in mild‐to‐moderate Covid‐19. N Engl J Med. 2020;383:2041‐2052. [DOI] [PMC free article] [PubMed] [Google Scholar]
- 17. Goldman JD, Lye DCB, Hui DS, et al. GS‐US‐540‐5773 investigators. remdesivir for 5 or 10 days in patients with severe Covid‐19. N Engl J Med. 2020;383:1827‐1837. [DOI] [PMC free article] [PubMed] [Google Scholar]
- 18. Cao B, Wang Y, Wen D, et al. A trial of lopinavir‐ritonavir in adults hospitalized with severe covid‐19. N Engl J Med. 2020;382:1787‐1799. [DOI] [PMC free article] [PubMed] [Google Scholar]
- 19. Guaraldi G, Meschiari M, Cozzi‐Lepri A, et al. Tocilizumab in patients with severe COVID‐19: a retrospective cohort study. Lancet Rheumatol. 2020;2:e474‐e484. [DOI] [PMC free article] [PubMed] [Google Scholar]
- 20. Ramage L, Akyol M, Fletcher A, et al. Glucocorticoids acutely increase brown adipose tissue activity in humans, revealing species‐specific differences in UCP‐1 regulation. Cell Metab. 2016;24:130‐141. [DOI] [PMC free article] [PubMed] [Google Scholar]