

Abstract
Geographical variation in severe acute respiratory syndrome coronavirus 2 (SARS‐CoV‐2) spread requires seroprevalence studies based on local tests, but robust validation is needed. We summarize an evaluation of antibody tests used in a serological study of SARS‐CoV‐2 in Saint Petersburg, Russia. We validated three different antibody assays: chemiluminescent microparticle immunoassay (CMIA) Abbott Architect SARS‐CoV‐2 immunoglobulin G (IgG), enzyme linked immunosorbent assay (ELISA) CoronaPass total antibodies test, and ELISA SARS‐CoV‐2‐IgG‐EIA‐BEST. Clinical sensitivity was estimated with the SARS‐CoV‐2 polymerase chain reaction (PCR) test as the gold standard using manufacturer recommended cutoff. Specificity was estimated using prepandemic sera samples. The median time between positive PCR test results and antibody tests was 21 weeks. Measures of concordance were calculated against the microneutralization test (MNA).Sensitivity was equal to 91.1% (95% confidence intervbal [CI]: 78.8–97.5), 90% (95% CI: 76.4–96.4), and 63.1% (95% CI [50.2–74.7]) for ELISA Coronapass, ELISA VectorBest, and CMIA Abbott, respectively. Specificity was equal to 100% for all the tests. Comparison of receiver operating characteristics has shown lower AUC for CMIA Abbott. The cutoff SC/O ratio of 0.28 for CMIA Abbott resulted in a sensitivity of 80% at the same level of specificity. Less than 33% of the participants with positive antibody test results had neutralizing antibodies in titers 1:80 and above. Antibody assays results and MNA correlated moderately. This study encourages the use of local antibody tests and sets the reference for seroprevalence correction. Available tests' sensitivity allows detecting antibodies within the majority of PCR positive individuals. The Abbott assay sensitivity can be improved by incorporating a new cutoff. Manufacturers' test characteristics may introduce bias into the study results.
Keywords: COVID19, SARSCoV2, SARSCoV2 infection antibody testing, seroepidemiologic study
Highlights
-
1)
This report is the first diagnostic performance study of antibody assays used in the representative population‐based serological study of SARS‐CoV‐2 in St. Petersburg, Russia.
-
2)
The sensitivity for two local assays was equal to 91.1% (95%CI: 78.8‐97.5) and 89.1\% (95%CI: 76.4‐96.4), CMIA Abbott's sensitivity was equal to 63.1\% (95%CI 50.2‐74.7)), with 100% specificity for all the tests.
-
3)
Moving the S/CO ratio from Abbott assays from manufacturers recommended 1.4 to 0.28 improved sensitivity from 63% to 80%, without loss in specificity.
-
4)
Less than a third of samples positive for binding antibodies were also positive in the virus neutralization test (with 1:80 titer as a threshold) in the population‐based sample.
1. INTRODUCTION
Severe acute respiratory syndrome coronavirus 2 (SARS‐CoV‐2) seroprevalence studies have proved to be a valuable tool in the assessment of the COVID‐19 pandemic dynamics. 1 , 2 , 3 However, researchers have raised several concerns regarding the nonresponse bias, the nonrepresentative sampling, and the use of nonvalidated tests for SARS‐CoV‐2 antibodies detection. 4 The first two issues can be addressed by appropriate study design and population sampling strategies 5 , 6 The latter problem requires the assessment of sensitivity and specificity of antibody assays to guide the correction of serological study results. 7 , 8 , 9 , 10 , 11 Additional requirements for antibody tests are being lodged for longitudinal serologic studies, but manufacturers rarely report the evaluation of the longterm test performance, for example, decreased longterm sensitivity is an issue that could bias the evaluation of immune response durability. 12 , 13
An evident geographical variation in the spread of SARS‐CoV‐2 requires local seroprevalence studies. 14 The use of locally available tests from national manufacturers can be convenient but often comes at the expense of test performance. 3 Local tests require robust validation against the benchmark of already available antibody tests and microneutralization assays using sera samples from cases confirmed by polymerase chain reaction (PCR) and from healthy donors.
The longterm performance of antibody tests is key to understanding the antibody kinetics. Previous validation studies have shown significant changes in the sensitivity of certain antibody tests in the longer followup. 15 This report summarizes the validation of antibody tests used in a representative population‐based serological study of SARS‐CoV‐2 in St. Petersburg, Russia, a densely populated city with more than 5.3 million inhabitants making it the fourth largest city in Europe. 6 We aimed at establishing test specificity (Sp) and sensitivity (Se) to correct estimates obtained through populationbased seroprevalence study.
2. MATERIALS AND METHODS
Information about the corresponding seroprevalence study in St. Petersburg is available in the detailed report. 6 In brief, we obtained a representative population sample through phone by using randomdigit dialing. The study started in May 2020. The first report was publicly available in August 2020. This study is underway and includes three rounds of blood sample collection with more than 2500 participants. This manuscript represents the evaluation of the performance of SARS‐CoV‐2 antibody assays using independent samples of sera taken from PCR positive cases and prepandemic sera that are not related to the populationbased serological study. We also assess the degree of agreement between the assays and neutralization tests using samples acquired through populationbased study.
2.1. Antibody tests
We used three different antibody tests throughout the study: (1) chemiluminescent microparticle immunoassay Abbott Architect SARS‐CoV‐2 immunoglobulin class G (IgG) on the Abbott ARCHITECT i2000sr platform (Abbott Laboratories), detecting IgG antibodies to the nucleocapsid protein of SARS‐CoV‐2 with the signal/cutoff (S/CO) ratio of 1.4 for positivity (chemiluminescent microparticle immunoassay [CMIA] Abbot; www.fda.gov/media/137383/download); (2) enzymelinked immunosorbent assay CoronaPass total antibodies test (Genetico) based on the recombinant receptor binding domain of the spike protein of SARS‐CoV‐2 (Department of Microbiology, Icahn School of Medicine), detecting total antibodies with the S/CO ratio of 1.0 for positivity (ELISA Coronapass, pass. genetico. ru); (3) enzymelinked immunosorbent assay SARS‐CoV‐2‐IgG‐EIA‐BEST by VectorBest, Novosibirsk, Russia also detecting IgG antibodies to the spike protein of SARS‐CoV‐2 with the S/CO ratio of 1.1 for positivity. (ELISA VectorBest, vector‐best. ru/en/prod/index. php?SECTION_ID = 2724).
Test performance for CMIA Abbott is available from the manufacturer materials (Se = 100%, Sp = 99.6%). It was also evaluated in numerous independent studies. 9 , 16 , 17 , 18 ELISA Coronapass test manufacturer provides information on its official website (Se = 98.7%, Sp = 100%). ELISA VectorBest sensitivity and specificity is reported in one study published in Russian (Se = 100%, Sp = 99.8%). 19
We used CMIA Abbott and ELISA Coronapass for the first publication of a populationbased seroprevalence study in May June 2020. 6 The first round of the study analysis showed that the use of ELISA Coronapass results in a slightly higher seroprevalence estimation. This was the initial reason for the independent validation of the test performance.
For sensitivity assessment, we also used nucleocapsid proteinbased CMIA Elecsys Anti‐SARS‐CoV‐2, manufactured by Roche Diagnostics GmbH, Mannheim, Germany (CMIA Roche, S/CO ratio of 1.0 for positivity, Se = 99.5%, Sp = 99.8%; diagnostics. roche. com/ru/ru/products/params/elecsys‐anti‐sars‐cov‐2. html).
2.2. Samples for the sensitivity and specificity assessment
For the sensitivity assessment, we obtained 92 serum samples collected from the personnel of the “Scandinavia” clinic as part of routine antibody monitoring carried out in the clinic. Serum samples were obtained for individuals who reported positive PCR tests for SARS‐CoV‐2 RNA. The median time between a positive PCR test result and blood draw for antibody test was equal to 21 weeks (interquartile range: 19.9–22.5).
For the specificity assessment, prepandemic human sera samples were obtained from healthy blood donors collected by the Smorodintsev Research Institute of Influenza through routine influenza surveillance in different cities across Russia. Sera samples are collected twice a year to assess herd immunity against influenza A and B viruses. Written informed consent was obtained in all cases of blood donation and further sample preparation. We used 93 remnant sera samples from herd immunity studies that were kept frozen at 80°C.
2.3. Neutralization test
A neutralization test was performed for 365 positive samples for binding antibody samples (at least on one of three assays) and for 74 negative samples. TCID50 based microneutralization test (MNA) was used to detect and titrate neutralizing antibodies. 20 First, serum samples were heated for 30 min at 56°C to avoid complementlinked reduction of the viral activity. This was followed by the preparation of serial twofold dilutions starting from 1:10 in 60 uL volume (tested in triplicate) of each serum specimen in culture medium (Alpha MEM containing antibiotics and 2% heatinactivated fetal bovine serum). Each dilution was mixed at equal volume with the live SARSCoV2 virus (60 µl, containing 25 TCID50/50 µl) and incubated for 60 min at 37°C in plastic microplates. Then 100 μl of the mix was transferred into 96‐well microplates with monolayer Vero cells. The plates were incubated at 37°C in a 5% CO2 atmosphere. Readings were evaluated 5–6 days later and neutralization was recorded if 100% of the cells in the well were preserved (no visible plaques or cytopathic effect). Serum neutralizing titer was expressed as the inverse of the higher serum dilution that exhibited neutralizing activity. All experiments were performed in a BSL3 laboratory.
2.4. Statistical analyses
Clinical sensitivity was estimated with the SARS‐CoV‐2 PCR test as the gold standard for specificity in prepandemic sera samples. We used 46 PCR positive samples and 41 prepandemic serum samples to crossvalidate all three tests (crossvalidation sample). Paired samples were collected from the same individuals tested on all the assays and compared using statistical tests fit
for paired comparison. In the independent test validation (fullvalidation sample), different sets of nonpaired samples (60 PCR positive samples and 65 prepandemic samples for CMIA Abbott, 48 and 93 for ELISA VectorBest, 60 and 92 for ELISA Coronapass) were used. Nonpaired samples do not necessarily come from the same individuals and are not matched. The difference in the number of paired and nonpaired samples is due to technical difficulties, including lack of material, logistics, and labeling issues. Unfortunately, due to the corresponding complexities, it was impossible to use all three tests for processing all available samples. We report the validation study results based on the manufacturers' recommended S/CO ratios, except for CMIAAbbott, where we use both the S/CO ratio of 1.4 and a more sensitive S/CO ratio of 1.0. Compared with the neutralization test results, the percent agreement (positive, negative and overall), the concordance (Cohen's Kappa coefficient along with the prevalence index (Pindex), bias index (Bindex), and prevalence and biasadjusted kappa—PABAK), and Spearman correlation coefficients were calculated. 21
The estimates are given with the 95% confidence intervals (CI) where appropriate. R statistical software (v.4.0.2; R Founda tion for Statistical Computing) was used for data analysis and presentation. Exact binomial confidence limits were calculated for test sensitivity, specificity, and percent agreement (negative—NPA, positive—PPA, and overall—OPA) applying the epi. tests function from the epiR package. Receiver operating characteristic (ROC) curves were constructed, and the corresponding area under the curve (AUC) was calculated for three tests using the pROC package. CIs for AUCs were calculated with 2000 bootstrap repli cates. The bootstrap test was used to compare ROC curves: a test for paired curves was used in the crossvalidation sample and nonpaired in the fullvalidation sample. Confidence intervals were calculated for Spearman's correlation with the spearmanCI package.
To report CIs for concordance measures—bias, prevalence, and kappa—we used the bootstrap percentile method (the epi. kappa function from the epiR package). Formal criteria (eg., Landis and Koch) for Cohen's Kappa interpretation were not used.
2.5. Ethical considerations and study registration
The study was approved by the Research Planning Board of the European University at St. Petersburg (on May 20, 2020) and the Ethics Committee of the Clinic “Scandinavia” (on May 26, 2020). All research was performed in accordance with the relevant guidelines and regulations. Informed consent was obtained from all participants of the study. The study was registered with the following identifiers: Clinicaltrials. gov (NCT04406038, submitted on May 26, 2020, date of registration—May 28,2020) and ISRCTN registry (ISRCTN11060415, submitted on May 26, 2020, date of registration—May 28,2020). The amendment, which included a test validation study, was approved by the Ethics Committee of the Clinic “Scandinavia” on October 2, 2020. We used blood samples collected from the clinic “Scandinavia” staff as a part of the routine antibody monitoring for which the hospital obtained a separate informed consent. Additional verbal consent was obtained to use collected samples for the validation study. Personal information was not linked to serum samples in the validation study except for the date of positive PCR for SARS‐CoV‐2.
3. RESULTS
Based on crossvalidation results, the sensitivity was equal to 91.1% (95% CI: 78.8–97.5) for ELISA Coronapass and 89.1% (95% CI: 76.4–96.4) for ELISA VectorBest. It was not significantly different from the CMIA Roche—89.1% (95% CI: 76.4– 96.4). However, the sensitivity of CMIA Abbott was equal to 63.1% (95% CI: 50.2–74.7). It was slightly higher with a cutoff SC/O ratio of 1.0—70.7% (95% CI: 57.3–81.9). Specificity was equal to 100% for all the tests (see Table 1).
Table 1.
Sensitivity and specificity of tests based on crossvalidatation (paired serum samples)
| Test | N | Sensitivity, % (95% CI) | N | Specificity, % (95% CI) |
|---|---|---|---|---|
| CMIA Abbott 1.0 | 46 | 70.7 (57.3–81.9) | 41 | 100 (88.1–100) |
| CMIA Abbott 1.4 | 46 | 63.1 (50.2–74.7) | 41 | 100 (84.6–100) |
| CMIA Roche | 46 | 89.1 (76.4–96.4) | — | — |
| ELISA Coronapass | 46 | 91.1 (78.8–97.5) | 41 | 100 (91.6–100) |
| ELISA VectorBest | 46 | 89.1 (76.4–96.4) | 41 | 100 (91.4–100) |
Abbreviation: CI, confidence interval.
Using nonpaired samples in the validation of the tests did not dramatically change the sensitivity and point estimates but narrowed confidence intervals (see Table S1).
Although the comparison of ROCs for three tests has shown that AUC is lower for CMIAAbbott, the difference was not dramatic—0.96 (95% CI: 0.90–1.00) for ELISA Coronapass and 0.90 (95% CI: 0.82–0.97) for CMIA Abbott, the difference was only significant when paired samples were compared (see Table 2 and Table S2).
Table 2.
Area under the ROC (AUC) of tests based on crossvalidation (paired serum samples)
| Test | AUC (95% CI) | p value |
|---|---|---|
| ELISA Coronapass | 0.96 (0.90–1.00) | — |
| CMIA Abbott | 0.90 (0.82–0.97) | 0.041 |
| ELISA VectorBest | 0.96 (0.89–1.00) | 0.476 |
Abbreviations: CI, confidence interval; ROC, receiver operating characteristic.
The cutoff SC/O ratio of 0.28 for CMIAAbbott resulted in a sensitivity of 80% at the same full level of specificity. The other test thresholds were optimal based on the ROC analysis of crossvalidation and nonpaired samples (see Figure 1).
Figure 1.
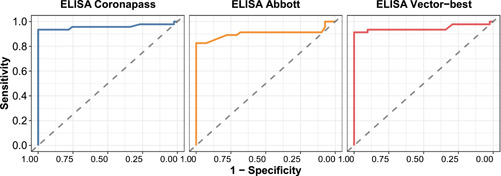
ROCs for three tests against PCR test results Inverse neutralising MNA titer. ELISA, enzyme‐linked immunosorbent assay; MNA, microneutralization test; PCR, polymerase chain reaction; ROC, receiver operating characteristic
In less than one‐third of the populationbased study participants with positive antibody total IgG test results, we detected neutralizing antibodies in titers 1:80 and above. NPA was between 28.0% (95% CI: 22.0–34.5) for CMIA Abbott (cutoff 1.4) and 20.8% (95% CI: 16.6–25.5) for ELISA Vectorbest. NPA between MNA with a cutoff at titers 1:20 was between 74.4% (95% CI: 68.0–80.2) for CMIA Abbott (cutoff 1.4) and 64.2% (95% CI: 58.9–69.3) for ELISA VectorBest (see Table 3).
Table 3.
Percent agreement between antibody tests and neutralizing antibody tests using two cutoffs (titers 1:20 and 1:80)
| Test | MNA100 cutoff | PPA (95% CI) | NPA (95% CI) | OPA (95% CI) |
|---|---|---|---|---|
| CMIA Abbott 1.0 | 20 | 76.5 (70.0–82.2) | 72.0 (65.8–77.6) | 74.0 (69.7–78.1) |
| CMIA Abbott 1.4 | 20 | 72.8 (66.5–78.5) | 74.4 (68.0–80.2) | 73.6 (69.2–77.6) |
| ELISA Coronapass | 20 | 91.1 (84.6–95.5) | 65.8 (60.3–71.0) | 72.9 (68.5–77.0) |
| ELISA VectorBest | 20 | 100 (96.3–100) | 64.2 (58.9–69.3) | 72.2 (67.8–76.4) |
| CMIA Abbott 1.0 | 80 | 95.5 (91.6–97.9) | 25.9 (20.5–32.0) | 57.6 (52.9–62.3) |
| CMIA Abbott 1.4 | 80 | 94.7 (91.0–97.3) | 28.0 (22.0–34.5) | 62.6 (57.9–67.2) |
| ELISA Coronapass | 80 | 96.7 (91.9–99.1) | 21.2 (16.8–26.1) | 42.4 (37.7–47.1) |
| ELISA VectorBest | 80 | 100 (96.3–100) | 20.8 (16.6–25.5) | 38.5 (33.9–43.2) |
Abbreviation: CI, confidence interval.
The measures of concordance are presented in Table S3. There was a moderate correlation between antibody assays results and MNA: 0.65 (95% CI: 0.59–0.71) for CMIA Abbott, 0.60 (95% CI: 0.54–0.67) for ELISA Coronapass, and 0.76 (95% CI: 0.72–0.81) for ELISA VectorBest (see Figure 2).
Figure 2.
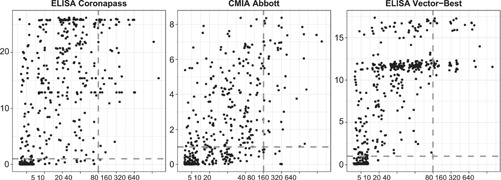
Correlation between antibody tests results and neutralization test. ELISA, enzyme‐linked immunosorbent assay
4. DISCUSSION
Our validation study encourages the use of local antibody tests for populationbased SARS‐CoV‐2 surveillance and sets the reference for the seroprevalence correction. However, it discourages the use of Abbott Architect SARS‐CoV‐2 IgG for population based seroprevalence SARSCoV2 surveillance. The decrease in test sensitivity (63% with a cutoff of 1.4) is likely to be related to the long period between infection and blood sampling compared to the manufacturer's validation studies (it was on average 21 weeks after the reported positive PCR test). Previous studies also found similar results for samples taken at a longer follow up. 13 , 15 These results may also explain the decline in antibody presence in longitudinal studies that may be incorrectly interpreted by the shortterm immune response to SARS‐CoV‐2. 22
Based on our validation study, the Abbott Architect SARSCoV2 IgG's sensitivity can be significantly improved by incorporating a new cutoff. Moving the S/CO ratio from 1.4 or 1.0 for positivity to 0.28 improved sensitivity from 63% or 71% to 80%, respectively, without loss in specificity. In another study 11 the optimized cutoff for Abbott CMIA was 0.91, but the mean cutoff in specificity cohorts ranged between 0.06 and 0.11 (below 0.28). The longer period between infection and blood draw in our study may explain the difference in the optimized cutoff.
Locally available ELISA tests and Roche assays are sensitive enough to detect antibodies in most individuals with previous positive PCR tests. Tests were negative for approximately 10% of participants with positive PCR, with any antibody tests. From the available data, it is impossible to conclude whether test results are falsenegative antibody, falsepositive PCR, or that infection did not result in the antibody response. Further studies are also needed to look into other mechanisms of the immune response to SARS‐CoV‐2. 23
The results for the assessment of concordance between binding and neutralizing antibodies tests should be interpreted with caution. Less than a third of samples positive for binding antibodies were also positive in the virus neutralization test (with the 1:80 titer as a threshold). However, this does not mean that they are susceptible to SARS‐CoV‐2 virus reinfections. Case reports about the second episode of COVID‐19 infection in the presence of neutralizing antibodies were also published. 24 The followup time plays an essential role in neutralization test results, but negative tests do not rule out other protection mechanisms. Recent studies showed that a positive antibody test is a powerful predictor of lowered risk of SARS‐CoV‐2 reinfection measures as a positive PCR test. 25 , 26
This finding has an important practical implication. Relying on test characteristics provided by manufacturers for correction of reported prevalence estimates introduces additional bias to the study. If the test reported prevalence is 5%, then with the test sensitivity of 65% and specificity of 100%, the true prevalence would be equal to approximately 8%. 27 If the crude prevalence based on the same test is 40%, then the true prevalence would be around 62%. The magnitude of bias in the population with a significant proportion of individuals with antibodies would limit the ability to detect the herd immunity threshold.
This study has several limitations. PCR test results that were chosen as a golden standard, were carried out in different laboratories. Although official test certificates that are registered in the national database were provided, false positive results cannot be ruled out. 28 The sample size for specificity assessment was relatively small, yet the corresponding specificity assessments are in line with the other studies that are based on the larger samples. But as mentioned above, PCR falsepositivity is likely to underestimate antibody test sensitivity in this study. Neutralization test results should be considered with caution as well. 29 Such tests can be considered as a surrogate marker of protection from reinfection, but this association needs to be explored in populationbased epidemiological studies. 15
In conclusion, this validation study provides a reference that can be used in further seroprevalence reports to correct the results based on test sensitivity and specificity. The Choice of the test for longitudinal surveillance is critical for making conclusions about the spread of SARS‐CoV‐2 and the durability of the immune response. Local tests should be rigorously evaluated for seroprevalence studies because the benefits of using appropriately validated tests are not only financial or related to matters of convenience. They may provide more accurate and unbiased assessments for the course of the pandemic.
CONFLICT OF INTERESTS
AB reports personal fees from MSD, Biocad, and AstraZeneca outside the submitted work.
AUTHOR CONTRIBUTIONS
Anton Barchuk, Daniil Shirokov, Lubov Barabanova, Daria Danilenko, and Dmitriy Skougarevskiy conceived the study. Anton Barchuk drafted the first version of the manuscript. Daria Danilenko and Varvara Tychkova performed Vector Best ELISA assays, Mariia Sergeeva and Lubov Barabanova performed the neutralization assays. Anton Barchuk, Dmitriy Skougarevskiy, Rustam Tursunzade, and Olga Dudkina did the analysis. All authors participated in the study design, contributed to the interpretation of data and to drafting sections of the manuscript. All authors read and approved the final manuscript.
Supporting information
Supporting information.
ACKNOWLEDGMENTS
The authors ould like to acknowledge personal support from Vitaly Nesis (Chief Executive Officer, Polymetal International, plc). We thank Alla Samoletova (European University at St. Petersburg) for administrative support and management of the study. The authors also thank Alyona Zheltukhina from Smorodintsev Research Institute of Influenza for excellent technical assistance. They would also like to thank the nurses, general practitioners, laboratory and administrative personnel of the Clinic “Scandinavia” and Smorodintsev Research Institute of Influenza. This study was funded by Polymetal International plc. The main funder had no role in the study design, data collection, analysis, interpretation, writing of the report or decision to submit the publication. The European University at St. Petersburg, clinic “Scandinavia” and Smorodintsev Research Institute of Influenza had access to the study data, and The European University at St. Petersburg had final responsibility for the decision to submit for publication. Part of this study performed at Smorodintsev Research Institute of Influenza was funded by the Russian Ministry of Science and Higher Education as part of the Worldclass Research Center program: Advanced Digital Technologies (contract No. 075152020904, dated 16.11.2020).
Barchuk A, Shirokov D, Sergeeva M, et al. Evaluation of the performance of SARS‐CoV‐2 antibody assays for a longitudinal populationbased study of COVID‐19 spread in St. Petersburg, Russia. J Med Virol. 2021;93:5846‐5852. 10.1002/jmv.27126
DATA AVAILABILITY STATEMENT
The data that support the findings of this study is openly available online at https://github.com/eusporg/spb_covid_ study20/tree/master/validation_of_covid_tests.
REFERENCES
- 1. Goudsmit J. The paramount importance of serological surveys of SARSCoV2 infection and immunity. Eur J Epidemiol. 2020:1. [DOI] [PMC free article] [PubMed] [Google Scholar]
- 2. Gudbjartsson DF, Norddahl GL, Melsted P, et al. Humoral immune response to SARSCoV2 in Iceland. N Engl J Med. 2020;383(18):1724‐1734. [DOI] [PMC free article] [PubMed] [Google Scholar]
- 3. Pollán M, Pérez‐Gómez B, Pastor‐Barriuso R, et al. Prevalence of SARSCoV2 in Spain (ENECOVID): a nationwide, populationbased seroepi demiological study. Lancet. 2020;396(10250):535‐544. [DOI] [PMC free article] [PubMed] [Google Scholar]
- 4. Bennett ST, Steyvers M. Estimating COVID19 antibody seroprevalence in Santa Clara County, California. A reanalysis of Bendavid et al. MedRxiv. 2020. [Google Scholar]
- 5. Mosha N, Aluko O, Todd J, Machekano R, Young T. Analytical methods used in estimating the prevalence of HIV/AIDS from demographic and crosssectional surveys with missing data: a systematic review. BMC Med Res Methodol. 2020;20(1):1‐10. [DOI] [PMC free article] [PubMed] [Google Scholar]
- 6. Barchuk A, Skougarevskiy D, Titaev K, et al. Seroprevalence of SARSCoV2 antibodies in Saint Petersburg, Russia: a populationbased study. MedRxiv. 2020. [Google Scholar]
- 7. Harritshøj LH, Gybel‐Brask M, Afzal S, et al. Comparison of sixteen serological SARSCoV2 immunoassays in sixteen clinical laboratories. J Clin Microbiol. 2021;59. [DOI] [PMC free article] [PubMed] [Google Scholar]
- 8. Eyre DW, Lumley SF, O'donnell D, et al. Stringent thresholds in SARSCoV2 IgG assays lead to underdetection of mild infections. BMC Infect Dis. 2021;21(1):1‐10. [DOI] [PMC free article] [PubMed] [Google Scholar]
- 9. GutiérrezCobos A, De Frutos SG, García DD, et al. Evaluation of diagnostic accuracy of 10 serological assays for detection of SARSCoV2 antibodies. Eur J Clin Microbiol Infect Dis. 2020:1‐7. [Google Scholar]
- 10. Weidner L, Gänsdorfer S, Unterweger S, et al. Quantification of SARSCoV2 antibodies with eight commercially available immunoassays. J Clin Virol. 2020;129:104540. [DOI] [PMC free article] [PubMed] [Google Scholar]
- 11. Wehrhahn MC, Brown SJ, Newcombe JP, et al. An evaluation of 4 commercial assays for the detection of SARSCoV2 antibodies in a predominantly mildly symptomatic low prevalence Australian population. J Clin Virol. 2021;138:104797. [DOI] [PMC free article] [PubMed] [Google Scholar]
- 12. Dittadi R, Afshar H, Carraro P. Two SARSCoV2 IgG immunoassays comparison and timecourse profile of antibodies response. Diagnosguttic Microbiol Infect Dis. 2021;99(4):115297. [DOI] [PMC free article] [PubMed] [Google Scholar]
- 13. Bal A, Trabaud MA, Fassier JB, Rabilloud M, Saker K, LangloisJacques C, et al. Six month antibody response to SARSCoV2 in healthcare workers assessed by virus neutralization and commercial assays. Clin Microbiol Infect. 2021;27:933‐935. [DOI] [PMC free article] [PubMed] [Google Scholar]
- 14. Rostami A, Sepidarkish M, Leeflang M, et al. SARSCoV2 seroprevalence worldwide: a systematic review and metaanalysis. Clin Microbiol Infect. 2020. [DOI] [PMC free article] [PubMed] [Google Scholar]
- 15. Muecksch F, Wise H, Batchelor B, et al. Longitudinal serological analysis and neutralizing antibody levels in coronavirus disease 2019 convalescent patients. J Infect Dis. 2020. [DOI] [PMC free article] [PubMed] [Google Scholar]
- 16. Chew KL, Tan SS, Saw S, et al. Clinical evaluation of serological IgG antibody response on the Abbott Architect for established SARSCoV2 infection. Clin Microbiol Infect. 2020;26(9):1256‐e9. [DOI] [PMC free article] [PubMed] [Google Scholar]
- 17. Batra R, Olivieri LG, Rubin D, et al. A comparative evaluation between the Abbott Panbio™ COVID19 IgG/IgM rapid test device and Abbott Architect™ SARS CoV2 IgG assay. J Clin Virol. 2020;132:104645. [DOI] [PMC free article] [PubMed] [Google Scholar]
- 18. Harley K, Gunsolus IL. Comparison of the clinical performances of the Abbott Alinity IgG, Abbott Architect IgM, and Roche Elecsys total SARSCoV2 antibody assays. J Clin Microbiol. 2020;59(1). [DOI] [PMC free article] [PubMed] [Google Scholar]
- 19. Kuvshinova I, Nekrasov B, Livitskaia N, Molodykh S, Rukavishnikov M. Sensitivity and specificity of JSC VectorBest assays for immunoglobulin of different classes to SARSCoV2 [Tchuvstvitel'nost' i specifichnost' naborov reagentov AO «VektorBest» dlja vyjavlenija immunoglobulinov raznyx klassov k SARSCoV2]. Spravochnik Zaveduyuschego KDL. 2020;(10):27‐32. [Google Scholar]
- 20. Manenti A, Maggetti M, Casa E, et al. Evaluation of SARSCoV2 neutralizing antibodies using a CPEbased colorimetric live virus microneutralization assay in human serum samples. J Med Virol. 2020;92(10):2096‐2104. [DOI] [PMC free article] [PubMed] [Google Scholar]
- 21. Byrt T, Bishop J, Carlin JB. Bias, prevalence and kappa. J Clin Epidemiol. 1993;46(5):423‐429. [DOI] [PubMed] [Google Scholar]
- 22. Stefanelli P, Bella A, Fedele G, et al. Longevity of seropositivity and neutralizing titers among SARSCoV2 infected individuals after 4 months from baseline: a populationbased study in the province of Trento. medRxiv. 2020. [Google Scholar]
- 23. Wheatley AK, Juno JA, Wang JJ, et al. Evolution of immune responses to SARSCoV2 in mildmoderate COVID19. Nat Commun. 2021;12(1):1‐11. [DOI] [PMC free article] [PubMed] [Google Scholar]
- 24. Zhang J, Ding N, Ren L, et al. COVID19 reinfection in the presence of neutralizing antibodies. Natl Sci Rev. 2021;8. [DOI] [PMC free article] [PubMed] [Google Scholar]
- 25. Lumley SF, O'donnell D, Stoesser NE, et al. Antibody status and incidence of SARSCoV2 infection in health care workers. N Engl J Med. 2021;384(6):533‐540. [DOI] [PMC free article] [PubMed] [Google Scholar]
- 26. Harvey RA, Rassen JA, Kabelac CA, et al. Association of SARSCoV2 seropositive antibody test with risk of future infection. JAMA Internal Med. 2021;181:672‐679. [DOI] [PMC free article] [PubMed] [Google Scholar]
- 27. Reiczigel J, Földi J, Ózsvári L. Exact confidence limits for prevalence of a disease with an imperfect diagnostic test. Epidemiol Infection. 2010;138(11):1674‐1678. [DOI] [PubMed] [Google Scholar]
- 28. Skittrall JP, Wilson M, Smielewska AA, et al. Specificity and positive predictive value of SARSCoV2 nucleic acid amplification testing in a lowprevalence setting. Clin Microbiol Infect. 2020;27:469. [DOI] [PMC free article] [PubMed] [Google Scholar]
- 29. Nie J, Li Q, Wu J, et al. Establishment and validation of a pseudovirus neutralization assay for SARSCoV2. Emerg Microbes Infect. 2020;9(1):680‐686. [DOI] [PMC free article] [PubMed] [Google Scholar]
Associated Data
This section collects any data citations, data availability statements, or supplementary materials included in this article.
Supplementary Materials
Supporting information.
Data Availability Statement
The data that support the findings of this study is openly available online at https://github.com/eusporg/spb_covid_ study20/tree/master/validation_of_covid_tests.