

Abstract
We sought to develop a brief Severe Acute Respiratory Syndrome Coronavirus 2‐related worry (CoV‐Wo) scale to understand COVID‐19‐related worry among adults in the United States. We also aimed to model key determinants of worry in the early stage of the COVID‐19 pandemic in the United States. A total of 806 participants completed an online survey in late March 2020. Exploratory and confirmatory factor analyses assessed scale structure. Factor analysis stratified by depression was used to assess measurement invariance. Linear regression models examined COVID‐19‐related worry determinants. The CoV‐Wo scale exhibited good reliability (α = 0.80) and a two‐factor structure: health (α = 0.83) and resources (α = 0.71). The full scale and both subscales were higher among participants who stopped working due to COVID‐19 and those with depression. Perception of quality medical care if infected with COVID‐19 was associated with reduced worry. The CoV‐Wo scale is a low burden assessment of COVID‐19‐related worry, that captures common worries in domains affected by COVID‐19 and can be used to develop psychosocial resources.
Keywords: community psychology, coronavirus, economic status, employment, food security, mental health, socioeconomic factors
1. INTRODUCTION
The Severe Acute Respiratory Syndrome Coronavirus 2 (SARS‐CoV‐2; COVID‐19) pandemic has had a profound global impact (Sohrabi et al., 2020). COVID‐19 is a novel disease caused by a betacoronavirus named SARS‐CoV‐2 that affects the lower respiratory tract (Sohrabi et al., 2020). As a respiratory virus, it is transmitted through close contact with infected individuals leading to case clusters within families and communities (Heymann & Shindo, 2020). The relatively slow onset of symptoms contributes to the spread of the infection, as many people who are infected are asymptomatic (Bai et al., 2020; Heymann & Shindo, 2020). Although the majority of infected people have mild to moderate symptoms, an estimated 16% of cases result in serious illness (Guan et al., 2020) with a suspected case fatality rate of approximately 2% though there is substantial variation among countries (Xu et al., 2020).
In 2020, the United States reported the highest number of cases globally, with over 13 million cases and 260 thousand fatalities (Centers for Disease Control and Prevention, 12/1/20.) Information about the spread and prevention continues to evolve, and extensive efforts are being taken worldwide to interrupt the transmission of COVID‐19. In the United States, policies have been implemented based on infection rates, resulting in school, work, restaurant, entertainment, and retail closures, and the prohibition of large social gatherings to encourage social distancing. Many Governors implemented Stay at Home orders, mandating residents to stay in their homes except to perform essential tasks. These voluntary and mandatory social distancing efforts have led to massive layoffs, termination of health insurance, and drops in household income. The infectiousness of COVID‐19, the surge in cases and associated death, evolving social distancing policies, and the implications of these policies to health and financial well‐being generated fear and anxiety. A better understanding of the psychological impact of the COVID‐19 outbreak and sources of concern among United States residents is needed to develop appropriate mental health interventions and ensure that COVID‐19 messaging addresses key concerns of the public and to prepare for future epidemics and disasters.
There is evidence that the COVID‐19 pandemic has impacted mental health (Jin et al., 2020; Wang et al., 2020). Much of the initial research came from China, the epicenter of the COVID‐19 pandemic (Heymann & Shindo, 2020). A study of the general public in China during the initial phases of the COVID‐19 outbreak found that 75% of respondents reported that they were worried about their family members contracting the virus, and 17% reported moderate to severe depressive symptoms (Wang et al., 2020).
A key set of cognitions associated with perceived threats to well‐being are worries. Events and factors that are perceived as uncontrollable tend to lead to much greater levels of worry (Dugas et al., 2004). Worry can negatively impact both physical and mental health (Borkovec et al., 1998; Kubzansky et al., 1997) as well as affect engagement in preventive behaviors (Renner & Reuter, 2012; Senay et al., 2013). Worries and concerns can range from under‐reacting to overreacting in ways that may impair physical functioning and health. Worry can lead to appropriate behaviors to address a potentially threatening or dangerous factor (Renner & Reuter, 2012). However, they can also reduce quality of life by impeding the ability to focus on important activities, lead to over‐reactions or negative coping such as substance use, or result in mental health problems such as depression and anxiety (Borkovec et al., 1998; Kieffer et al., 2006; Kubzansky et al., 1997).
COVID‐19 is likely associated with the exacerbation of several sources of worry. One source focuses on health concerns, specifically worrying about the health of self and others as well as transmitting the virus (Taylor et al., 2020). These worries may be particularly prevalent with the COVID‐19 outbreak due to the uncertainty of how the virus is transmitted. In addition to health concerns, COVID‐19 has generated uncertainty across economic domains (Taylor et al., 2020). The pandemic created financial uncertainties as large sectors of the economy were closed to mitigate the spread of the virus resulting in major financial impacts and high rates of job loss. A Pew Research Center study conducted from March 19th–24th found that 27% of respondents reported that they, or someone in their household, had to take a pay cut due to the COVID‐19 outbreak and 20% reported job loss (Krogstad et al., 2020). Additionally, within the context of job loss and financial uncertainty, many Americans do not have adequate health insurance or are unable to pay co‐pays. Regardless of health insurance status, the cost for treating COVID‐19 and follow‐up care can be prohibitive for many individuals (Levitt et al., 2020). Food security has also been impacted by COVID‐19 as individuals who are self‐isolating may not be able to go out to acquire food, and income loss can result in the inability to purchase an adequate amount or quality of food. A study conducted in Britain estimated that the number of adults who are food insecure has quadrupled as a result of COVID‐19 (Loopstra, 2020).
There are several groups that may be more prone to experience COVID‐19‐related worry. One group is those who are at elevated risk of severe cases of COVID‐19 infection, including individuals with specific preexisting conditions and older adults (Centers for Disease Control and Prevention, 2020b). Financial resources can also impact worry (Choi & DiNitto, 2018). Fewer financial resources can make it difficult to access quality medical care as well as COVID‐19 prevention materials such as face masks and cleaning supplies. Demographic characteristics such as age and race may also relate to heightened worry due to inequalities in job insecurity (Elvira & Zatzick, 2002; Wanberg et al., 1999). Worry may be higher among those with less access to social support resources. In the face of a traumatic event, such as the COVID‐19 pandemic, social support can lower worry cognitions (White et al., 1998).
The aims of the current study are to describe the development of the SARS‐CoV‐2 Worry (CoV‐Wo) scale and provide psychometric properties of the scale using an online sample of United States residents. This study also aims to assess whether there are variations in worry related to vulnerable groups (i.e., those who have more health risks, financial problems, or limited social support resources) during the early stages of the COVID‐19 outbreak in the United States.
2. METHODS
2.1. Study timing
We conducted a general population survey from March 24th to 27th, 2020. This study was conducted 2 weeks after the World Health Organization declared that COVID‐19 was a global pandemic on March 11th, 2020 (World Health Organization, 2020), and about a week after the US President announced social distancing guidelines on March 16th (White House, 2020). By March 24th, 15 states had statewide Stay at Home orders, and by March 26th, 21 states had implemented Stay at Home orders.
2.2. Study participants
Participants were recruited into an online study through Amazon Mechanical Turk (MTurk). MTurk is an online platform that can be used for subject recruitment (Berinsky et al., 2012). MTurk allows for the study of real‐time dynamics of large groups (Paolacci & Chandler, 2014). Study samples recruited through MTurk are not nationally representative but are often more representative than convenience‐sampling on several dimensions (Berinsky et al., 2012; Huff & Tingley, 2015). Previous research has supported the reliability of data from MTurk participants (Follmer et al., 2017). Study protocols were designed following MTurk's best practices (Chandler & Shapiro, 2016; Strickland & Stoops, 2019; Young & Young, 2019).
Participants were eligible for the study if they consented to be a part of the study and were: (1) an adult aged 18 years or above; (2) resided in the United States; (3) spoke and read English; and (4) had heard of the coronavirus or COVID‐19. Additionally, to enhance reliability, eligible participants had to pass attention and validity checks embedded into the survey (Rouse, 2015). In total, 806 participants were eligible and passed all attention checks. This study was approved by the Johns Hopkins Bloomberg School of Public Health Institutional Review Board. The median completion time was 13.4 min. Participants were compensated $2.50 for the completion of the full study survey, the equivalent of an $11.20 hourly wage.
2.3. Measures
2.3.1. COVID‐19 worry
The SARS‐CoV‐2 worry (Cov‐Wo) scale was developed as a short inventory to assess the content and degree of worry about the COVID‐19 pandemic (Table 1). The focus of this scale was on universal worry about COVID‐19 that would apply to all members of the general public.
Table 1.
SARS‐CoV‐2‐related worry (CoV‐Wo) scale item distribution
| Strongly disagree (1) | Disagree (2) | Neither (3) | Agree (4) | Strongly agree (5) | Average | |
|---|---|---|---|---|---|---|
| Q1. I am very worried about getting the coronavirus. | 6.20% | 21.71% | 17.37% | 40.45% | 14.27% | 3.35 |
| Q2. I am very worried about my family/friends getting the coronavirus. | 3.35% | 8.31% | 11.91% | 44.79% | 31.64% | 3.93 |
| Q3. I am very worried about giving someone else the coronavirus. | 6.45% | 16.50% | 16.63% | 34.74% | 25.68% | 3.57 |
| Q4. I am worried about money because of the coronavirus. | 8.44% | 20.22% | 14.39% | 32.13% | 24.81% | 3.45 |
| Q5. I am worried about having enough food because of the coronavirus. | 11.66% | 29.16% | 16.63% | 29.78% | 12.78% | 3.03 |
| Q6. I am worried about medical bills if I get sick from the coronavirus. | 14.64% | 21.22% | 11.91% | 31.39% | 20.84% | 3.23 |
Abbreviation: SARS‐CoV‐2, Severe Acute Respiratory Syndrome Coronavirus 2.
This article is being made freely available through PubMed Central as part of the COVID-19 public health emergency response. It can be used for unrestricted research re-use and analysis in any form or by any means with acknowledgement of the original source, for the duration of the public health emergency.
Items were developed based on health and economic domains affected by the COVID‐19 pandemic (Krogstad et al., 2020; Levitt et al., 2020; Loopstra, 2020). Health domains included personally contracting the virus, others contracting the virus, and spreading the virus to others. Economic domains included financial concerns and the effect of the virus on access to basic needs. Seven items were generated based on face validity to capture worry on these health and economic domains affected by COVID‐19. One item, “I am worried about loss of income if I get sick from the coronavirus,” was later eliminated due to a high correlation (r = .68) with “I am worried about money because of the coronavirus” resulting in a six‐item scale. Participants were instructed to rate how strongly they agreed with each worry question on a 5‐point Likert‐type scale: strongly disagree; disagree; neither agree nor disagree; agree; strongly agree (Table 1). Items were summed to create the 6‐item CoV‐Wo with a possible range of 6–30. Additionally, content validity/legitimization was assessed using qualitative findings (Onwuegbuzie & Johnson, 2006). In the same survey an open‐ended question asked all respondents, “What is your biggest worry about the coronavirus?” Two respondents did not respond to the question and were excluded. Data were analyzed using a thematic analytic approach which identifies patterns or themes across people (Braun & Clark, 2006). A codebook was developed based on reviewing a subset of interviews, and all responses were coded to assess participant‐identified domains of worry. This concurrent approach allowed us to assess if the quantitative measures of worry represented participant‐identified primary worries (Onwuegbuzie & Johnson, 2006). Two main themes appeared from these qualitative responses. The first was the worry about the health threat from COVID‐19, both becoming infected (21%) and transmitting the virus (10%). Worry was also frequently expressed about family and friends becoming infected (38%). The second major set of themes was the secondary impact of the pandemic on financial (25%), medical bills (3%) and extreme cases access to adequate supplies of food (4%). The qualitative findings identified primary domains of worry which aligned with CoV‐Wo items. A unique set of worries about children were also listed by parents in the qualitative findings (5%). However, as these did not generalize to the whole sample, we also developed a separate measure of worrying about children, which is not included in this report.
2.3.2. Demographics
Gender was assessed by the question, “Do you consider yourself male, female, transgender, or other?” Three participants self‐reported as transgender or other. Due to this small sample, these three participants were removed from analyses. Age was assessed as a continuous measure. Level of education compared individuals who had completed some college, associate's degree, technical degree, or above to those who had a high school education or below. Participants were asked to identify their race/ethnicity as White, non‐Hispanic Black, Hispanic, Asian, Mixed, or Other. Due to small sample sizes, Mixed and Other were combined into one category. To examine the impact of COVID‐19 related policy on worry, we assessed participants who resided in states that had enacted a Stay at Home before or on the day that they took the survey compared to respondents who did not live in states with Stay at Home Orders on the day they completed the survey.
2.3.3. Personal health
Four measures were used to assess personal health. First, participants self‐rated their health, and ratings of “excellent” or “good” were compared to “poor” or “fair.” Second, to assess personal risk of severe COVID‐19, participants were asked the question, “Do you have a respiratory condition? That is, a condition that affects your lungs, such as emphysema?” (Yes/No). Third, a question assessed if participants had comorbid health conditions, including diabetes, cancer, heart disease, or high blood pressure. Nineteen participants did not respond to this question and were coded as not having any of the conditions. Participants who reported any comorbid conditions were compared to those who did not report comorbidities. Fourth, the Center for Epidemiologic Studies Depression 10 item (CESD‐10) scale assessed depressive symptoms. Two respondents had a missing value for CESD‐10 items and were analyzed using average imputation (Zhang et al., 2012). The internal consistency reliability of the CESD‐10 was strong in the present sample (α = 0.90). Items were dichotomized at 10 or above to assess for the presence of significant depressive symptoms (Zhang et al., 2012).
2.3.4. Access to support
Access to financial, medical, and social support resources was examined using five distinct questions. Financial resources were measured by a question about total family income in the past year (less than $15K, $15K–$35 K,$35K–$60K, $60K–$90K, $90K, and over) and a question about employment cessation due to the coronavirus (Yes/No). Medical resources were assessed by a question about whether participants had health insurance coverage (Yes/No) and a question about the perception of medical care (“If I were to get sick from the coronavirus, I could get excellent medical care” where responses of “strongly agree” and “agree” were compared to “neither agree nor disagree,” “disagree,” and “strongly disagree”). Finally, social support was assessed with the question “If I were to get sick from the coronavirus, I could count on my neighbors to help me out” (responses of “strongly agree” and “agree” were compared to “neither agree nor disagree,” “disagree,” and “strongly disagree”).
2.4. Analysis
Each source of worry on the CoV‐Wo scale was assessed using descriptive statistics. Cronbach's alpha was calculated to estimate scale internal consistency. We used principal components and factor analysis to assess the factor structure of the CoV‐Wo scale. First, we randomly divided the total sample into two equal sized subsamples. We used the first subsample for the exploratory factor analysis (EFA) and then used the second subsample and total sample for the confirmatory factor analysis (CFA). For the EFA, we used the iterative principal‐factor method to estimate factor loadings due to the noncontinuous nature of our indicators. Factor loadings were rotated using a promax rotation, as we expected factors to have an oblique structure. We then estimated the CFA models based on the structure suggested by the EFA results. Then to assess measurement invariance by depression, we repeated the EFA stratified by depression. We then estimated two CFA models, one where the loadings were constrained to be equal between depression groups and one where the loadings were free to vary. Predictors of CoV‐Wo were then examined using bivariate and multivariable linear regression models. Multivariable models were constructed using backward stepwise selection to build parsimonious multivariable models with an inclusion criterion of p < 0.10. The first adjusted model (Model 1) did not include depression to assess predictors of COVID‐19‐related worry unique from depression. The second adjusted model (Model 2) included all predictors. Analyses were conducted using Stata 14 and Mplus 8 (StataCorp, 2015; Muthén & Muthén, 1998‐2017).
3. RESULTS
COVID‐19‐related worry, measured using the CoV‐Wo scale, revealed a mean score of 20.55 (SD: 5.13; range: 6–30). Depression, assessed with the CESD‐10, had a mean score of 10.49 (SD: 6.80), with 51% of respondents reporting significant depressive symptoms. The average age of participants was 38.17, and 55% were female (Table 2). None of the respondents had tested positive for COVID‐19, and three respondents were awaiting testing results. The majority were White (78%), had greater than high school education (88%), rated their health as excellent or good (80%), and currently had health insurance (82%). Participants represented 50 states, and 43% of respondents lived in states with Stay at Home Orders enacted when they completed the survey. Almost one fifth (19%) of respondents had stopped working because of COVID‐19. Participants at elevated risk of severe COVID‐19 infection included 9% of participants who reported they had a respiratory condition and 15% who reported a comorbid health condition. Approximately half of the participants had annual household incomes greater than 60K (44%) and agreed or strongly agreed that if they got COVID‐19 they would receive excellent medical care (43%) or that their neighbors would help them (32%).
Table 2.
Sample characteristics and models predicting CoV‐Wo scores (N = 806)
| Total n (%) | Model 0: Full worry scale | Model 1: Full worry scale | Model 2: Full worry scale | |
|---|---|---|---|---|
| Unadjusted coefficient | Adjusted coefficient; No CESD | Adjusted coefficient; CESD included | ||
| (95% CI) | (95% CI) | (95% CI) | ||
| Demographics | ||||
| Female gender | 447 (55.46) | 1.45 (0.74, 2.15) | 1.27 (0.59, 1.95) | 0.96 (0.31, 1.61) |
| Age (years; mean [SD]) | 38.17 ± 11.53 | −0.01 (−0.05, 0.02) | −0.03 (−0.06, 0.00) | −0.00 (−0.03, 0.02) |
| Race (ref: White) | 630 (78.16) | |||
| Non‐Hispanic Black | 59 (7.32) | −0.82 (−2.19, 0.55) | −1.31 (−2.60, −0.02) | −1.05 (−2.28, 0.18) |
| Hispanic | 30 (3.72) | 0.39 (−1.49, 2.28) | 0.14 (−1.62, 1.89) | 0.23 (−1.45, 1.91) |
| Asian | 64 (7.94) | −0.22 (−1.55, 1.10) | 0.06 (−1.30, 1.32) | −0.03 (−1.2, 1.18) |
| Mixed/other | 23 (2.85) | 1.47 (−0.66, 3.61) | 1.13 (−0.86, 3.11) | 0.92 (−0.98, 2.81) |
| Education (>high school) | 710 (88.09) | 0.66 (−0.44, 1.75) | 0.98 (−0.06, 2.01) | 0.64 (−0.36, 1.63) |
| Stay at home order | 343 (42.82) | 0.55 (−0.17, 1.26) | – | – |
| Personal health | ||||
| Depression (CESD ≥10) | 410 (50.87) | 3.90 (3.24, 4.56) | XXX | 3.05 (2.37, 3.72) |
| Excellent/good health | 642 (79.65) | −2.31 (−3.18, −1.45) | −1.72 (−2.58, −0.87) | −0.86 (−1.70, −0.02) |
| Respiratory issues | 76 (9.43) | 0.92 (−0.29, 2.13) | – | – |
| Comorbid conditions | 127 (15.76) | 1.22 (0.25, 2.19) | 0.99 (0.06, 1.92) | 0.86 (−0.02, 1.75) |
| Access to resources | ||||
| Income >$60K | 357 (44.29) | −1.31 (−2.02, −0.60) | −0.51 (−1.21, 0.19) | −0.63 (−1.29, 0.04) |
| Stopped working due to COVID‐19 | 115 (19.23) | 2.57 (1.68, 3.45) | 2.37 (1.52, 3.22) | 2.01 (1.20, 2.82) |
| Health insurance | 664 (82.38) | −1.17 (−2.09, −0.24) | – | – |
| Excellent medical care | 344 (42.68) | −2.62 (−3.32, −1.93) | −2.17 (−2.87, −1.47) | −1.71 (−2.37, −1.02) |
| Neighborhood support | 255 (31.64) | −1.14 (−1.9, −0.38) | – | – |
Note: Bold: p < .05; XXX: not included in model; –: excluded in backward stepwise selection.
Abbreviations: CESD, Center for Epidemiologic Studies Depression; CI, Confidence Interval.
This article is being made freely available through PubMed Central as part of the COVID-19 public health emergency response. It can be used for unrestricted research re-use and analysis in any form or by any means with acknowledgement of the original source, for the duration of the public health emergency.
3.1. Sources of COVID‐19‐related worry
Participants reported worry on all items of the CoV‐Wo scale. Table 1 displays responses to individual items and the distributions of participant responses. Respondents primary source of worry was families and friends getting the coronavirus (32% strongly agree; 45% agree) followed by giving someone else the coronavirus (26% strongly agree; 35% agree), money (25% strongly agree; 32% agree), getting the coronavirus (14% strongly agree; 40% agree), medical bills (21% strongly agree; 31% agree), and having enough food (13% strongly agree; 30% agree).
3.2. Psychometrics of CoV‐Wo scale
To test the reliability of the scale, the inter‐item consistency was examined. The inter‐item correlation structure found that items were moderately to strongly correlated with each other (r = 0.25–0.74; Table 3). The internal consistency reliability estimate based on Cronbach's alpha was good (α = 0.80). Principal component analysis and EFA with the random 50% subsample indicated that the CoV‐Wo scale had a two factor structure, where Questions 1–3 loaded onto the first factor and Questions 4–6 loaded onto the second with no substantial cross loadings (Appendix 1). The CFA models were similar for both the other subsample and the overall sample, so we only further report the full sample model (see Appendix 1 for full results). The full sample CFA (Figure 1) fit the data well (Root Mean Square Error Of Approximation = 0.078, Standardized Root Mean Square Residual = 0.036, CFI = 0.975, TFI = 0.954). The first factor was composed of COVID‐19‐related worries related to one's own health and the health of others (CoV‐Wo‐health). The second factor was characterized by worries about limited resources due to COVID‐19 (CoV‐Wo‐resources). To assess discriminant validity, we examined the structure of the CoV‐Wo scale stratified by depression. The principal components analysis and EFA models for both the depressed and nondepressed samples indicated the same structure of factors as in the overall sample (Appendix 2). The models were configurally and metrically invariant by depression groups (−2ΔLL = 4.95; p = 0.550), supporting the interpretation that COVID‐19 related worry is distinct from depression.
Table 3.
CoV‐Wo scale item correlations and internal consistency
| Polychoric correlationsa | Item‐rest correlations | Item‐test correlations | |||||
|---|---|---|---|---|---|---|---|
| Q1 | Q2 | Q3 | Q4 | Q5 | |||
| Q1. I am very worried about getting the coronavirus. | – | 0.62 | 0.75 | ||||
| Q2. I am very worried about my family/friends getting the coronavirus. | 0.71 | – | 0.60 | 0.72 | |||
| Q3. I am very worried about giving someone else the coronavirus. | 0.63 | 0.74 | – | 0.55 | 0.70 | ||
| Q4. I am worried about money because of the coronavirus. | 0.37 | 0.34 | 0.30 | – | 0.53 | 0.70 | |
| Q5. I am worried about having enough food because of the coronavirus. | 0.43 | 0.34 | 0.25 | 0.59 | – | 0.50 | 0.67 |
| Q6. I am worried about medical bills if I get sick from the coronavirus. | 0.34 | 0.33 | 0.36 | 0.52 | 0.43 | 0.49 | 0.68 |
| Overall scale Cronbach's alpha: 0.80 | |||||||
All polychoric correlations between items were significant at the p < 0.001 level based on χ 2 square tests except for the correlation between Q2 and Q5 where p = 0.014.
This article is being made freely available through PubMed Central as part of the COVID-19 public health emergency response. It can be used for unrestricted research re-use and analysis in any form or by any means with acknowledgement of the original source, for the duration of the public health emergency.
Figure 1.
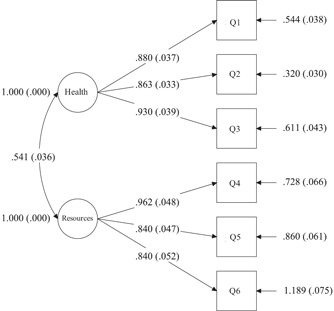
Factor structure of the CoV‐Wo scale
3.3. Predictors of COVID‐19 worry
Table 2 shows predictors of the full COVID‐19‐related worry scale (CoV‐Wo), and Table 4 examines predictors of the two CoV‐Wo subscales (CoV‐Wo‐health and CoV‐Wo‐resources). All multivariable models identified a heightened risk of COVID‐19 worry those who stopped working due to COVID‐19. Both the full CoV‐Wo scale and CoV‐Wo‐health subscale were significantly elevated among female participants and participants with comorbid conditions. In all CoV‐Wo models, perceptions of receiving quality medical care, was associated with lower CoV‐Wo scores. Significant predictors of CoV‐Wo in Model 1 remained significant after adjusting for depression (Model 2) except for race. In Model 1, non‐Hispanic Black participants had a lower likelihood of reporting COVID‐19‐related worry than White participants. However, this relationship did not remain significant after adjusting for depression (Model 2). In Models 3 and 4, which assessed the CoV‐Wo health subscale, Non‐Hispanic Black participants had significantly lower scores compared to White participants in both bivariate and adjusted modes. In all models, depression was strongly associated with COVID‐19‐related worry.
Table 4.
Models predicting CoV‐Wo health and resources subscales (N = 806)
| Model 3: Health subscale | Model 4: Health subscale | Model 5: Resources subscale | Model 6: Resources subscale | |
|---|---|---|---|---|
| Unadjusted coefficient (95% CI) | Adjusted coefficient (95% CI) | Unadjusted coefficient (95% CI) | Adjusted coefficient (95% CI) | |
| Demographics | ||||
| Female gender | 0.87 (0.47, 1.28) | 0.66 (0.26, 1.06) | 0.58 (0.14, 1.01) | 0.32 (−0.07, 0.71) |
| Age (years; mean [SD]) | −0.00 (−0.02, 0.01) | −0.00 (−0.02, 0.01) | −0.01 (−0.03, 0.01) | 0.00 (−0.01, 0.02) |
| Race (ref: White) | ||||
| Non‐Hispanic Black | −0.98 (−1.76, −0.19) | −0.94 (−1.70, −0.18) | 0.15 (−0.68, 0.99) | −0.13 (−0.87, 0.62) |
| Hispanic | −0.21 (−1.28, 0.87) | −0.20 (−1.23, 0.82) | 0.61 (−0.54, 1.75) | 0.36 (−0.65, 1.37) |
| Asian | 0.01 (−0.74, 0.77) | 0.07 (−0.67, 0.80) | −0.24 (−1.04, 0.56) | −0.13 (−0.86, 0.59) |
| Mixed/other | 0.57 (−0.65, 1.79) | 0.42 (−0.74, 1.58) | 0.90 (−0.40, 2.20) | 0.36 (−0.79, 1.50) |
| Education (>high school) | 0.45 (−0.17, 1.08) | 0.29 (−0.32, 0.90) | 0.20 (−0.46, 0.87) | 0.39 (−0.21, 1.00) |
| Stay at home order | 0.44 (0.03, 0.86) | – | 0.10 (−0.33, 0.54) | – |
| Personal health | ||||
| Depression (CESD ≥10) | 1.67 (1.28, 2.06) | 1.38 (0.98‐1.78) | 2.23 (1.82, 2.63) | 1.80 (1.41, 2.20) |
| Excellent/good health | −0.89 (−1.39, −0.39) | – | −1.42 (−1.95, −0.90) | – |
| Respiratory issues | 0.77 (0.07, 1.46) | 0.63 (−0.04‐1.29) | 0.16 (−0.58, 0.89) | – |
| Comorbid conditions | 0.68 (0.12, 1.23) | 0.57 (0.03, 1.11) | 0.54 (−0.05, 1.13) | – |
| Access to resources | ||||
| Income >$60K | −0.05 (−0.46, 0.36) | 0.06 (−0.34, 0.47) | −1.26 (−1.68, −0.83) | −0.80 (−1.20, −0.40) |
| Stopped working due to COVID‐19 | 0.79 (0.28, 1.30) | 0.58 (0.09, 1.07) | 1.78 (1.24, 2.31) | 1.31 (0.82, 1.80) |
| Health insurance | 0.34 (−0.19, 0.88) | 0.46 (−0.08‐1.00) | −1.51 (−2.07, −0.95) | −0.80 (−1.32, −0.25) |
| Excellent medical care | −0.81 (−1.21, −0.40) | −0.62 (−1.04, −0.21) | −1.82 (−2.23, −1.40) | −1.12 (−1.53, −0.71) |
| Neighborhood support | −0.11 (−0.55, −0.32) | – | −1.03 (−1.48, −0.57) | – |
Note: Bold: p < .05; –: excluded in backward stepwise selection.
Abbreviation: CI, confidence interval.
This article is being made freely available through PubMed Central as part of the COVID-19 public health emergency response. It can be used for unrestricted research re-use and analysis in any form or by any means with acknowledgement of the original source, for the duration of the public health emergency.
4. DISCUSSION
The CoV‐Wo scale was designed to assess the content and extent of COVID‐19‐related worry. We found that the 6‐item CoV‐Wo scale is both reliable and valid. Study findings identified high levels of worry about COVID‐19 among United States residents during the initial phases of the outbreak in the United States. As the COVID‐19 pandemic has profoundly affected the health and socioeconomic resources of individuals and families, it is vital to understand their concerns and to provide psychosocial resources. The short CoV‐Wo scale can be used for national samples and vulnerable populations to identify key sources of worry related to the coronavirus using a low burden assessment tool. As each of the items measured unique, albeit correlated domains, the scale is also useful for detecting specific areas of worry, and two sub‐scales were identified that indicated COVID‐19‐related health and resources worries. It is likely that these domains are also critical for other epidemics and disasters, and hence the scale could be modified to such situations.
During the initial phases of the COVID‐19 outbreak in the United States, the present study found that the majority of respondents reported worry on all item measures. The highest rated concern was that others would contract the virus followed by the concern that they would spread the virus to others. Predictors of high CoV‐Wo scores were being female, having co‐morbid health conditions, and having poor self‐rated health. These results are aligned with Wang and colleagues' study of correlates of psychological response during the initial stages of the COVID‐19 epidemic among the general population in China (Wang et al., 2020). Additionally, this study found that being currently employed and the perceived availability of quality of medical care were associated with lower worries.
As the pandemic continues and new variants emerge, worry may continue to rise due to uncertainty around infection risk and economic concerns. The finding that worry is higher among some groups is noteworthy as it may result in health disparities in COVID‐19‐related morbidity and mortality. These disparities have a number of practice implications. One is that, to address the confluence of psychological and social stress created by the COVID‐19 pandemic, it is essential to utilize the principles of integrated care. Trauma‐informed integrated care unites physical and mental health services, families, and communities while also integrating knowledge of the impact of trauma on all aspects of care (Dayton et al., 2016). Integrated social psychological interventions can be implemented using internet technology. As modeled in a West China Hospital, physicians, psychiatrists, psychologists, and social workers can carry out psychological interventions for patients and their families using internet technology (Zhang et al., 2020). Another implication is that natural supporters, such as peer educators and family members, can also provide a critical psychosocial support during the COVID‐19 outbreak. Social network members serving as peer supporters can target hard to reach populations and are well situated to respond to immediate concerns. Additionally, the peer supporter role can provide a prosocial identity that may positively impact mental health (Latkin, 1998). Healthcare models utilizing the principles of integrated care, telemedicine, and natural supporters not only respond to the psychosocial needs of residents during the COVID‐19 pandemic but should be a part of the United States healthcare system, which is often understaffed and not responsive to social needs (Alley et al., 2016; Golden, 1991).
This study is not without limitations. This online sample is not representative, which may affect the generalizability of the findings. In general, samples recruited through MTurk tend to be younger and more educated than national representative study (Berinsky et al., 2012; Huff & Tingley, 2015; Paolacci & Chandler, 2014). Among MTurk samples in the United States, participants who are Black and Hispanic are underrepresented (Berinsky et al., 2012). MTurk samples are similar to nationally stratified surveys in the percentage of respondents employed in a specific sector and rural‐urban residence (Huff & Tingley, 2015). To enhance validity, this study followed best practices guidelines for using crowdsourcing data collection and included validity checks in the survey. Additionally, the cross‐sectional nature of the study design does not allow us to make causal inferences. Longitudinal research should assess the role of worry in predicting engagement in COVID‐19 prevention behaviors and engagement in medical care. Additionally, the relationship between the COVID‐19‐related worry and depression should be further explored. This study found that the CESD‐10 and CoV‐Wo scales measure different constructs. However, depression was strongly associated with COVID‐19‐related worry suggesting that people with preexisting depression may be more susceptive to COVID‐19‐related worry or that high levels of worry may lead to depression. Study findings may also be impacted by social desirability bias and acquiescence bias as there are no contradictory items included in the scale. The CoV‐Wo scale was designed to assess general sources of worry and may not capture all sources of concern. Qualitative research can be used to illuminate sources of worry that are unique to certain populations. Other sources of worry may include worrying about being unable to engage in prevention behaviors or worry about the economic effects of COVID‐19. An example of a population‐specific domain of worry that warrants further exploration is parental worries or high‐risk groups such as senior or essential workers. As this is the first study using the CoV‐Wo scale, additional research is needed to understand the extent of worry as well as predictors of worry in other national and community samples.
5. CONCLUSION
This study has identified that a brief six‐item CoV‐Wo scale is a reliable and valid measure of COVID‐19‐related worry among a general sample of US residents. As the short and long‐term consequences of COVID‐19 continue to be experienced, it is imperative that national and local governments and organizations are able to tailor interventions to high‐risk groups to address both the cause of worries and their mental health consequences. The low burden CoV‐Wo scale can help identify groups in need of psychosocial interventions as well as trends in distress caused by COVID‐19.
CONFLICT OF INTERESTS
The authors declare that there are no conflict of interests.
PEER REVIEW
The peer review history for this article is available at https://publons.com/publon/10.1002/jcop.22577
ACKNOWLEDGMENTS
The authors are grateful to the people who participated in this study and provided an understanding of the impact of COVID‐19 on well‐being during the initial phases of the outbreak in the United States. as well as for NIH support (DA040488).
APPENDIX 1. FACTOR ANALYSIS PROCEDURE AND RESULTS
Exploratory factor analysis with random subsample:
First, we randomly selected one half of the sample to use in the exploratory factor analysis. We conducted a principal components analysis and associated parallel analysis with the CoV‐Wo scale items. The results of these suggested that a two‐factor solution is likely the most appropriate.
We then conducted the exploratory factor analysis for two factors using the iterated principal‐factor method, as the maximum likelihood method is only appropriate when items are measured continuously.  We used promax rotation as we expected the factors to have an oblique structure (i.e, be correlated).
  The results of this analysis suggested that Questions 1–3 loaded onto the first factor while Questions 4–6 loaded on to the second and that there were no large cross loadings. We then used this factor structure for the following confirmatory factor analyses.
Confirmatory factor analysis with the other subsample:
The first confirmatory factor analysis (CFA) was conducted using the other half of the sample that was not used in the exploratory factor analysis (EFA). Based on the following model fit information, we determined that this CFA model fit reasonably well.  Confirmatory factor analysis with full sample:
Next, we repeated the CFA with the entire sample. Again, the model fit was reasonable.  The results of the two CFA models were not meaningfully different.
APPENDIX 2. FACTOR ANALYSIS RESULTS STRATIFIED BY DEPRESSION
Stratified EFA procedures are the first step in assessing configural invariance for factor analysis. We use this process to determine if the structure of the factors and the item loadings generally follow the same pattern.
EFA for nondepressed sample:


EFA for depressed sample:
 Based on these EFAs, the factor structure of the scale appears to be the same as in both depression groups as it is in the overall sample.
Confirmatory factor analysis by depression:
This step was done to assess metric invariance in the models. We ran two models stratified by depression. In the first, we constrained both groups to have the same loadings. In the second, we let the loadings vary freely between groups. Then we tested to see if the unconstrained model if better than the constrained model via a likelihood ratio test. The constrained model had a loglikelihood of −7015.521 and the unconstrained model had a loglikelihood of −7013.044 (df = 6).
The constrained model fits worse than the unconstrained model, suggesting that there is no metric measurement variance by depression.
Tests for scalar invariance failed due to too many model modifications, which is a common problem with scalar invariance testing (Asparouhov & Muthén, 2014).
Nonetheless, we can conclude that the factor model is configurally and metrically invariant by depression based on these results.
Dayton, L. , Schneider, K. , Strickland, J. , & Latkin, C. (2021). Determinants of worry using the SARS‐CoV‐19 worry (CoV‐Wo) scale among United States residents. J Community Psychol, 49, 1487–1504. 10.1002/jcop.22577
DATA AVAILABILITY STATEMENT
The data that support the findings of this study are available from the corresponding author upon reasonable request. Data collection is ongoing and available upon request.
REFERENCES
- Alley, D. , Asomugha, C. , Conway, P. , & Sanghavi, D. (2016). Accountable health communities—Addressing social needs through medicare and medicaid. The New England Journal of Medicine, 374(1), 8–11. [DOI] [PubMed] [Google Scholar]
- Asparouhov, T. , & Muthén, B. (2014). Multiple‐group factor analysis alignment. Structural Equation Modeling: A Multidisciplinary Journal, 21(4), 495–508. [Google Scholar]
- Bai, Y. , Yao, L. , Wei, T. , Tian, F. , Jin, D.‐Y. , Chen, L. , & Wang, M. (2020). Research Letter: Presumed asymptomatic transmission of COVID‐19. JAMA—Journal of the American Medical Association, E1–e2. 10.1056/nejmoa2001316 [DOI] [PMC free article] [PubMed]
- Berinsky, A. J. , Huber, G. A. , & Lenz, G. S. (2012). Evaluating online labor markets for experimental research: Amazon.com's mechanical turk. Political Analysis, 20(3), 351–368. 10.1093/pan/mpr057 [DOI] [Google Scholar]
- Borkovec, T. D. , Ray, W. J. , & Stöber, J. (1998). Worry: A cognitive phenomenon intimately linked to affective, physiological, and interpersonal behavioral processes. Cognitive Therapy and Research, 22(6), 561–576. 10.1023/A [DOI] [Google Scholar]
- Braun, V. , & Clarke, V. (2006). Using thematic analysis in psychology. Qualitative Research in Psychology, 3(2), 77–101. 10.1191/1478088706qp063oa [DOI] [Google Scholar]
- Centers for Disease Control and Prevention . (2020a). Cases of Coronavirus Disease (COVID‐19) in the U.S. Retrieved April 22, 2020, from https://www.cdc.gov/coronavirus/2019-ncov/cases-updates/cases-in-us.html
- Centers for Disease Control and Prevention . (2020b). People Who Are at Higher Risk for Severe Illness. Retrieved from https://www.cdc.gov/coronavirus/2019-ncov/need-extra-precautions/people-at-higher-risk.html
- Chandler, J. , & Shapiro, D. (2016). Conducting clinical research using crowdsourced convenience samples. Annual Review of Clinical Psychology, 12(1), 53–81. 10.1146/annurev-clinpsy-021815-093623 [DOI] [PubMed] [Google Scholar]
- Choi, N. G. , & DiNitto, D. M. (2018). Correlates of worry about health care costs among older adults. Journal of Applied Gerontology, 37(6), 763–782. 10.1177/0733464816650803 [DOI] [PubMed] [Google Scholar]
- Dayton, L. , Agosti, J. , Bernard-Pearl, D. , Earls, M. , Farinholt, K. , Groves, B. M. , Rains, M. , Sarvet, B. , Wilcox, H. C. , & Wissow, L. S. (2016). Integrating mental and physical health services using a socio‐emotional trauma lens. Current Problems in Pediatric and Adolescent Health Care, 46(12), 391–401. 10.1016/j.cppeds.2016.11.004 [DOI] [PubMed] [Google Scholar]
- Dugas, M. J. , Schwartz, A. , & Francis, K. (2004). Intolerance of uncertainty, worry, and depression. Cognitive Therapy and Research, 28(6), 835–842. 10.1007/s10608-004-0669-0 [DOI] [Google Scholar]
- Elvira, M. M. , & Zatzick, C. D. (2002). Who's displaced first? The role of race in layoff decisions. Industrial Relations, 41(2), 329–361. 10.1111/1468-232X.00248 [DOI] [Google Scholar]
- Follmer, D. , Sperline, R. , & Suen, H. (2017). The role of MTurk in education research: Advantages, issues, and future directions. Educational Researcher, 46(6), 329–334. [Google Scholar]
- Golden, G. K. (1991). Volunteer counselors: An innovative, economic response to mental health service gaps. Social Work (United States), 36(3), 230–232. 10.1093/sw/36.3.230 [DOI] [PubMed] [Google Scholar]
- Guan, W. , Ni, Z. , Hu, Y. , Liang, W. , Ou, C. , He, J. , & Zhong, N. (2020). Clinical Characteristics of coronavirus disease 2019 in China. New England Journal of Medicine, 382, 1708–1720. 10.1056/nejmoa2002032 [DOI] [PMC free article] [PubMed] [Google Scholar]
- Heymann, D. L. , & Shindo, N. (2020). COVID‐19: What is next for public health? The Lancet, 395, 542–545. 10.1016/S0140-6736(20)30374-3 [DOI] [PMC free article] [PubMed] [Google Scholar]
- Huff, C. , & Tingley, D. (2015). “Who are these people?” Evaluating the demographic characteristics and political preferences of MTurk survey respondents. Research and Politics, 2(3), 205316801560464. 10.1177/2053168015604648 [DOI] [Google Scholar]
- Jin, Z. , Zhao, K. , Xia, Y. , Chen, R. , Yu, H. , Tamunang Tamutana, T. , & Baess, P. (2020). Psychological responses to the Coronavirus Disease (COVID‐19) outbreak.
- Kieffer, K. M. , Cronin, C. , & Gawet, D. L. (2006). Test and study worry and emotionality in the prediction of college students' reasons for drinking: An exploratory investigation. Journal of Alcohol and Drug Education, 50(1), 57–81. [Google Scholar]
- Krogstad, J. , Gonzalez‐Barrera, A. , & Noe‐Bustamante, L. (2020). U.S. Latinos among hardest hit by pay cuts, job losses due to coronavirus. Retrieved from https://www.pewresearch.org/fact-tank/2020/04/03/u-s-latinos-among-hardest-hit-by-pay-cuts-job-losses-due-to-coronavirus/
- Kubzansky, L. D. , Kawachi, I. , Spiro, A. , Weiss, S. T. , Vokonas, P. S. , & Sparrow, D. (1997). Is worrying bad for your heart? A prospective study of worry and coronary heart disease in the normative aging study. Circulation, 95, 818–824. [DOI] [PubMed] [Google Scholar]
- Latkin, C. (1998). Outreach in Natural Settings: The use of peer leaders for HIV prevention among injecting drug users' networks. Public Health Reports, 113(suppl 1), 151–159. [PMC free article] [PubMed] [Google Scholar]
- Levitt, L. , Schwartz, K. , & Lopez, E. (2020). Estimated Cost of Treating the Uninsured Hospitalized with COVID‐19. Retrieved from https://www.kff.org/uninsured/issue-brief/estimated-cost-of-treating-the-uninsured-hospitalized-with-covid-19/
- Loopstra, R. (2020). Vulnerability to food insecurity since the COVID‐19 lockdown: Preliminary Report. Retrieved from https://foodfoundation.org.uk/wp-content/uploads/2020/04/Report_COVID19FoodInsecurity-final.pdf
- Muthén, L. K. , & Muthén, B. O. (1998‐2017). Mplus User's Guide. Muthén & Muthén
- Onwuegbuzie, A. J. , & Johnson, B. B. (2006). The validity issue in mixed research. Research in the Schools, 13(1), 48–63. [Google Scholar]
- Paolacci, G. , & Chandler, J. (2014). Inside the Turk: Understanding mechanical turk as a participant pool. Current Directions in Psychological Science, 23(3), 184–188. 10.1177/0963721414531598 [DOI] [Google Scholar]
- Renner, B. , & Reuter, T. (2012). Predicting vaccination using numerical and affective risk perceptions: The case of A/H1N1 influenza. Vaccine, 30(49), 7019–7026. 10.1016/j.vaccine.2012.09.064 [DOI] [PubMed] [Google Scholar]
- Rouse, S. V. (2015). A reliability analysis of Mechanical Turk data. Computers in Human Behavior, 43, 304–307. 10.1016/j.chb.2014.11.004 [DOI] [Google Scholar]
- Senay, I. , Hensley‐Alford, S. , & Kaphingst, K. A. (2013). Judging risk for multiple diseases: The role of disease worry. Journal of Health Psychology, 18(4), 554–560. 10.1177/1359105312437263 [DOI] [PMC free article] [PubMed] [Google Scholar]
- Sohrabi, C. , Alsafi, Z. , O'Neill, N. , Khan, M. , Kerwan, A. , Al‐Jabir, A. , Iosifidis, C. , & Agha, R. (2020). World Health Organization declares global emergency: A review of the 2019 novel coronavirus (COVID‐19). International Journal of Surgery, 76(February), 71–76. 10.1016/j.ijsu.2020.02.034 [DOI] [PMC free article] [PubMed] [Google Scholar]
- StataCorp . (2015). Stata Statistical Software: Release 14. College Station. StataCorp LP. [Google Scholar]
- Strickland, J. C. , & Stoops, W. W. (2019). The use of crowdsourcing in addiction science research: Amazon Mechanical Turk. Experimental and Clinical Psychopharmacology, 27(1), 1–18. [DOI] [PubMed] [Google Scholar]
- Taylor, S. , Landry, C. A. , Paluszek, M. M. , Fergus, T. A. , McKay, D. , & Asmundson, G. (2020). Development and initial validation of the COVID Stress Scales. Journal of Anxiety Disorders, 72(102232). 10.1016/j.janxdis.2020.102232 [DOI] [PMC free article] [PubMed] [Google Scholar]
- Wanberg, C. , Kanfer, R. , Hamann, D. , & Zhang, Z. (1999). Age and Reemployment success after job loss: An integrative model and meta‐analysis. Psychological Bulletin (Manuscript), 142(4), 400–426. [DOI] [PubMed] [Google Scholar]
- Wang, C. , Pan, R. , Wan, X. , Tan, Y. , Xu, L. , Ho, C. S. , & Ho, R. C. (2020). Immediate psychological responses and associated factors during the initial stage of the 2019 coronavirus disease (COVID‐19) epidemic among the general population in China. International Journal of Environmental Research And Public Health, 17(5), 1729. 10.3390/ijerph17051729 [DOI] [PMC free article] [PubMed] [Google Scholar]
- White House . (2020). 15 Days to Slow the Spread. Retrieved from https://www.whitehouse.gov/articles/15-days-slow-spread/
- White, K. , Bruce, S. , Farrell, A. , & Kliewer, W. (1998). Impact of exposure to community violence on anxiety: A longitudinal study of family social support as a protective factor for urban children. Journal of Child and Family Studies, 7(2), 187–204. 10.1023/A [DOI] [Google Scholar]
- World Health Organization . (2020). WHO Director‐General's opening remarks at the media briefing on COVID‐19 − 11 March 2020. Retrieved from https://www.who.int/dg/speeches/detail/who-director-general-s-opening-remarks-at-the-media-briefing-on-covid-19---11-march-2020
- Xu, Z. , Shi, L. , Wang, Y. , Zhang, J. , Huang, L. , Zhang, C. , & Wang, F. S. (2020). Pathological findings of COVID‐19 associated with acute respiratory distress syndrome. The Lancet Respiratory Medicine, 2600(20), 19–21. 10.1016/S2213-2600(20)30076-X [DOI] [PMC free article] [PubMed] [Google Scholar]
- Young, J. , & Young, K. (2019). Don't get lost in the crowd: Best practices for using Amazon's mechanical turk in behavioral research. Journal of the Midwest Association for Information Systems, 2019(2), 7–34. 10.17705/3jmwa.000050 [DOI] [Google Scholar]
- Zhang, J. , Wu, W. , Zhao, X. , & Zhang, W. (2020). Recommended psychological crisis intervention response to the 2019 novel coronavirus pneumonia outbreak in China: A model of West China Hospital. Precision Clinical Medicine, 3(1), 3–8. 10.1093/pcmedi/pbaa006 [DOI] [PMC free article] [PubMed] [Google Scholar]
- Zhang, W. , O'Brien, N. , Forrest, J. I. , Salters, K. A. , Patterson, T. L. , Montaner, J. S. G. , & Lima, V. D. (2012). Validating a shortened depression scale (10 item CES‐D) among HIV‐Positive people in British Columbia, Canada. PLoS One, 7(7), 1–5. 10.1371/journal.pone.0040793 [DOI] [PMC free article] [PubMed] [Google Scholar]
Associated Data
This section collects any data citations, data availability statements, or supplementary materials included in this article.
Data Availability Statement
The data that support the findings of this study are available from the corresponding author upon reasonable request. Data collection is ongoing and available upon request.