Abstract
Reef fishes are a treasured part of marine biodiversity, and also provide needed protein for many millions of people. Although most reef fishes might survive projected increases in ocean temperatures, corals are less tolerant. A few fish species strictly depend on corals for food and shelter, suggesting that coral extinctions could lead to some secondary fish extinctions. However, secondary extinctions could extend far beyond those few coral-dependent species. Furthermore, it is yet unknown how such fish declines might vary around the world. Current coral mass mortalities led us to ask how fish communities would respond to coral loss within and across oceans. We mapped 6964 coral-reef-fish species and 119 coral genera, and then regressed reef-fish species richness against coral generic richness at the 1° scale (after controlling for biogeographic factors that drive species diversification). Consistent with small-scale studies, statistical extrapolations suggested that local fish richness across the globe would be around half its current value in a hypothetical world without coral, leading to more areas with low or intermediate fish species richness and fewer fish diversity hotspots.
Keywords: bleaching, co-extinctions, ocean warming, structural equation modelling
1. Introduction
Under some carbon emissions scenarios, 99% of the world's coral reefs are predicted to undergo repeated, severe bleaching events within this century [1], which begs the question: how might fish communities respond to an ocean without corals globally? On the one hand, rock reefs can support diverse fish assemblages in the tropics [2]. On the other hand, it is well documented by empirical studies that coral mortality can reduce reef-fish diversity and biomass beyond the few coral-reef fishes that strictly depend on living corals for food and/or shelter [3–6]. For instance, small-scale empirical studies [4,7] and meta-analyses [8–10] find fish diversity declines by more than a half without corals. This implies corals provide many direct and indirect ecological benefits at the patch-reef scale, such as contributing structural complexity and hence generating habitat for fish and other reef organisms [11,12]. Assuming that these reef-scale dependencies on corals scale up to regions and oceans, global reef-fish diversity might decline substantially in the future. Unfortunately, data on how fish depend on corals do not yet exist at the scale needed to quantify (and map) such declines globally.
We conducted a thought experiment where we asked how many coral-dependent reef-fish species would be lost and how many reef fishes would remain at a location after removing all coral species. Although this extreme prediction might not reflect the future, it helps us bracket how fish might respond to a worst-case scenario. We first mapped fish and coral diversity across the globe. We then mapped the moderate proportion of fishes known to depend directly on corals. Next, we statistically projected the intercept of the fish diversity–coral diversity association without considering natural history as a factor. As predicted by many previous studies, both approaches suggested fish richness would decline with coral loss. But the statistical projection had a stronger effect, perhaps because it accounted for indirect effects and aspects of natural history not available across species from the literature [3]. Specifically, in a well-fit model that accounted for multiple drivers and covariates, eliminating coral had direct and indirect impacts on regional fish diversity that were consistent with empirical results from patch reefs, suggesting that species richness would decline by half, phylogenetic diversity decline by one-third and functional diversity decline by one-quarter.
2. Results and discussion
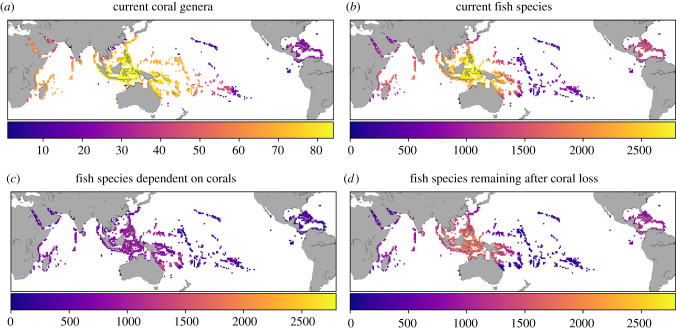
We mapped coral generic richness and reef-fish species richness in each 1° × 1° cell across the world's coral reefs (for a total of 1708 cells, figure 1a,b). We then estimated the extent to which reef-fish richness depended on corals using two independent approaches: (i) limited natural history information about coral dependency available for all species [13–16]; and (ii) a statistical model that regressed fish species richness (without considering natural history) on coral generic richness.
Figure 1.
Current global distribution of coral richness, tropical fish richness, projected fish richness dependent on corals and projected fish richness remaining in a world without corals. (a) Current global distribution of coral genera richness. (b) Current global distribution of tropical fish species richness, Fc. (c) Projected tropical fish species dependent on coral, computed as cd × Fc, where cd is the degree of fish dependency on corals inferred from our statistical model; (d) projected global distribution of tropical fish richness in a coral-less world, computed as Fc − (cd × Fc). (Online version in colour.)
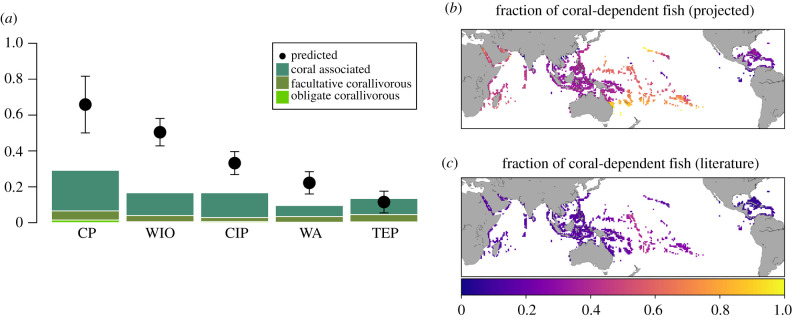
In the natural history dependency dataset, obligate coral feeders were rare (0.1% per site, figure 2a), but facultative coral feeders (4%) and fish species that use corals for shelter and/or reproduction (13%) were not (figure 2a). Combined, these natural history traits suggest 17.6% (±0.07% s.d.) of fishes were directly vulnerable to coral loss, which is less than predicted from empirical studies and meta-analyses [4,7–10]. This inconsistency could be due to gaps in the available species-specific information on ecological associations, including behaviour, recruitment and indirect links between fish and corals [3].
Figure 2.
Natural history-based and statistically projected coral dependency by biogeographic region. (a) Stacked bars represent the fraction of coral-dependent fish species based on the literature across biogeographic regions, as in [17] (CP, central Pacific; WIO, western Indian Ocean; CIP, central Indo-Pacific; WA, western Atlantic; TEP, tropical eastern Pacific). Different colours correspond to obligate corallivory, facultative corallivory and coral-associated fishes. Points represent mean ± s.d. of coral-dependent fish estimated by our statistical projection. Maps report the global distribution of coral dependency according to the statistical projection (at 1° × 1° resolution) (b), and coral dependency based on the literature (c; sum of obligate and facultative corallivores, and coral-associated fish). See electronic supplementary material, figures S11 and S12 for a more detailed version of b and c. (Online version in colour.)
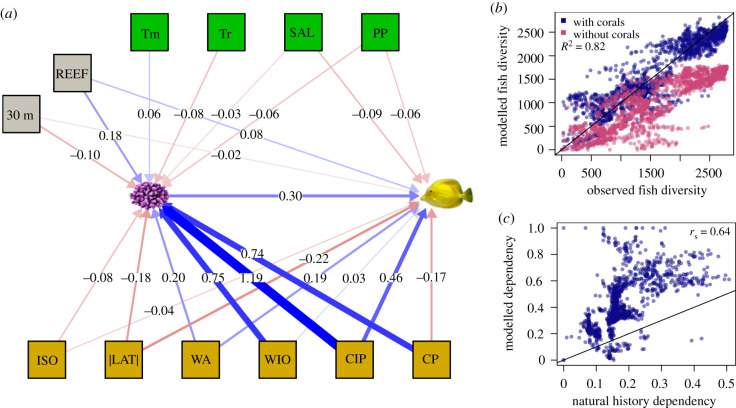
The correlation between fish-species richness and coral generic richness (r = 0.65, p < 0.0001; electronic supplementary material, figure S1), which is consistent with reef-scale observations that fish richness increases with coral diversity [18], provides circumstantial support to these ideas. However, at the global scale, this correlation could be due to at least four non-mutually exclusive hypotheses: (i) coral and fish species have shared radiations based on gene flow, region age and isolation, (ii) coral and fish independently follow the latitudinal diversity gradient, (iii) fish and coral diversity increase with a cell's reef habitat area and/or (iv) fish diversity depends on coral diversity. Here, we focused on the fourth hypothesis, by attempting to isolate how coral richness affects fish richness from environmental factors (water temperature, salinity, pH, primary productivity, depth suitable to reef-building corals), isolation (measured a fraction of land within 5° latitude/longitude), fraction of coral cover and large-scale biogeographic factors (regions). We tested several possible statistical models with and without latent variables, spatial hierarchies and interaction terms. We examined fit statistics for each model and, because all models were consistent in their main results, we present the one with the best compromise between fit (χ2, AIC, RMSEA and goodness of fit; electronic supplementary material, table S1 and figures S2–S10) and ecological meaning (figure 3a; electronic supplementary material, table S1). This simple model (without quadratic terms, latent variables or interactions) supported a link from coral diversity to fish diversity (R2 = 0.82, p < 0.0001; n = 1708, figure 3b; see electronic supplementary material, table S2) that was robust to spatial autocorrelation among sites (see Methods).
Figure 3.
Global fish diversity model. (a) Fitted structural equation model used in the analyses (other models gave similar fish–coral coefficients). Numbers report the standardized coefficients (lines: blue = positive, magenta = negative, thickness = magnitude). The best model included no latent variables. The coral and fish icons indicate, respectively, coral genera diversity and fish species diversity. Tm, mean surface temperature; Tr, annual surface temperature range; SAL, surface salinity; PP, primary productivity; REEF, reef fraction (fraction of reef habitat per 1° × 1° reef cell); 30 m, fraction of reef cell with depth ≤ 30 m; ISO, isolation; |LAT|, absolute latitude; WA, western Atlantic; WIO, western Indian Ocean; CIP, central Indo-Pacific; CP, central Pacific. (b) Observed versus model predicted fish diversity in a world with (blue dots) and without corals (magenta dots). The R2 value indicates the goodness of fit between observed and predicted fish diversity (in a world with corals). (c) Comparison between the fish dependency predicted by our model in each reef locality (as in figure 2b) and the corresponding fish dependency value estimated from natural history traits reported in the literature (as in figure 2c). rs is the Spearman's rank correlation coefficient. Solid lines in b and c are lines of equality. (Online version in colour.)
We used this model to predict site-level fish species richness with and without corals. A fish community's vulnerability to coral loss varied geographically, being highest in the central Pacific, intermediate in the western Indian, central Indo-Pacific, and tropical eastern Pacific, and moderate in the western Atlantic (figure 2a,c), with dependency being higher in regions where available natural history information suggests more fish species feed on or live in close association with coral (Spearman's ρ = 0.64, p < 0.0001; figure 3c). However, the statistical model predicted twice as many fish species depended on corals than expected based on natural history alone (cf. points versus bars in figure 2a). On average, 41% ± 18% (s.d.) of fish species appeared to depend on corals being present, with dependency computed for each locality as 1 minus predicted fish diversity without corals divided by predicted diversity with corals (figures 2a and 3c).
Considering fish phylogenetic and functional entity diversity gives a more comprehensive view of how coral loss might affect fish communities. On average, local phylogenetic diversity declined by 32 ± 21% (figure 4a), which was in line with the expected decline in phylogenetic diversity for a similar magnitude decline in species richness (31 ± 16%; electronic supplementary material figure S13a). The number of fish functional entities per reef locality declined by 23 ± 21% (figure 4b), which was a little less dramatic than the expected (random) decline in functional entities (28% ± 16%; electronic supplementary material figure S13b).
Figure 4.
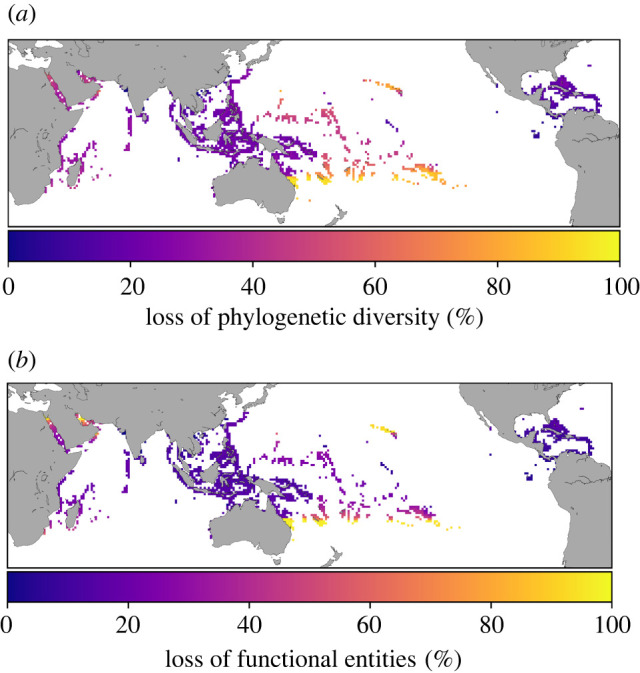
Association between reef loss and loss of fish richness, phylogenetic diversity and functional entities, as predicted by the SEM models (electronic supplementary material, figures S15 and S16), at 1° × 1° resolution. (Online version in colour.)
Total global-scale coral loss is a simple, but pessimistic thought experiment, so we also considered how partial reductions in coral diversity were associated with fish diversity. We set coral diversity to zero one reef site at a time, with the order of selected sites being either random or aimed at minimizing or maximizing fish loss, and then plotted the proportional decline in fish taxonomic, phylogenetic and functional entity diversity (as well as their expected decline if species were removed at random) (figure 5). Regardless of the order of site selection, coral loss had the strongest effect on species richness, followed by phylogenetic diversity and number of functional entities. Declines in fish diversity facets were rapid even when we removed sites in the order that best protected fish richness. This suggests that the rate of fish diversity loss might be less sensitive than expected to where corals decline first.
Figure 5.
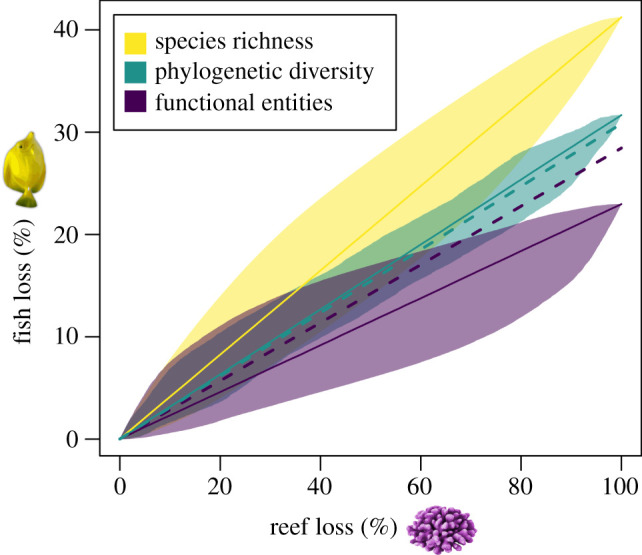
Statistical projections of global % decline in fish species richness (yellow), phylogenetic diversity (green) and functional entities (purple) for increasing levels of reef loss (solid line = mean, shaded area range between most and least robust assumptions). The dashed lines represent the expected % decline in fish phylogenetic diversity and functional entities if fish species were removed at random. (Online version in colour.)
Although losing all coral genera amounts to losing all coral, the same does not apply to partial coral loss. The extent that partial coral loss will affect fish communities likely depends more on changes in coral cover than coral generic diversity. Furthermore, our study treats all coral species the same, but coral species vary in their sensitivity to bleaching and in their importance to fishes [19,20], adding uncertainty to how fish diversity will respond to gradual coral bleaching. Although tackling this problem would require analysing finer-scale data than exists on the global scale, theoretical studies indicate that species evolve to depend on historically persistent resources [21], and that unprecedented environmental changes like global warming can lead to greater than expected rates of secondary extinctions [22]. Fish should fare worse if common corals go extinct first.
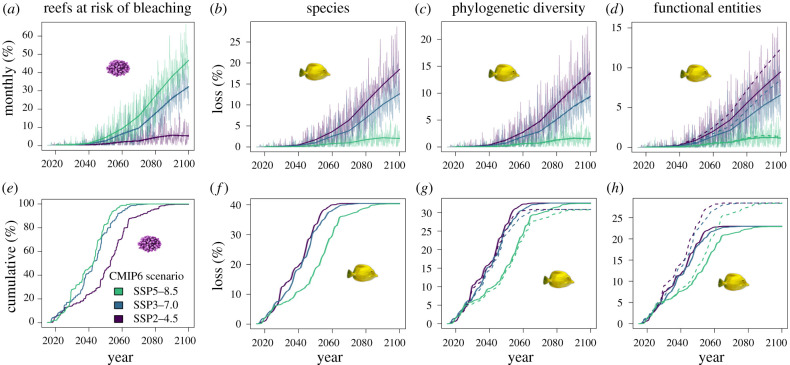
Some coral reefs are more sensitive to warming than others, and this could affect global changes to fish communities over time. In addition, future temperature projections vary widely. Therefore, we projected reef-fish diversity loss under three ocean temperature projections (SSP2, SSP3 and SSP5, from the most conservative to the most pessimistic, assuming that total annual carbon emission will reach, respectively, 10, 83 and 126 Gt by 2100 [23]; this translates into an increase of yearly mean water surface temperature averaged across all reef localities of 0.91, 1.91, and 2.4°C in the period 2095–2100 compared to 2015–2020). For each month from 2020 to 2100, we assumed substantial bleaching would occur at sites where the projected temperature was 2°C warmer than the mean temperature of the warmest month in the period 2015–2020. Bleaching increased steadily in all projections (figure 6a), with more than 60% of cells expected to bleach at least once by 2060, and all cells bleaching by 2090, even under the most conservative climatic projection (SSP2–4.5) (figure 6e).
Figure 6.
Climate-based projections (for three future CMIP6 climatic scenarios, see Methods) of global loss of reef-fish species richness, phylogenetic diversity and functional entities following coral loss. (a) Fraction of reef localities expected to bleach each month from 2020 to 2100 (dark line is the decadal mean). (e) Fraction of reef localities worldwide expected to have been exposed to at least one bleaching event. (b–d) Predicted loss of fish diversity facets assuming rapid recovery of coral and fish communities after bleaching (high resilience) (dark line is the decadal mean). (f–h) Predicted loss of fish diversity facets assuming no recovery of fish and coral communities (low resilience). The dashed lines in (c,d,g,h) indicate the average percentage decline in fish phylogenetic diversity and functional entities obtained by removing an equivalent number of fish species at random across 100 replicates (figure 3). (Online version in colour.)
Various environmental and ecological factors might alter the mean rate at which fish respond to reductions in coral cover (e.g. [24–26]). Although bleached coral provides reef habitat until reefs erode [27,28], we made the simplifying assumption that bleached reefs had no coral habitat. Because there is not enough information to accurately parametrize the rates at which fish and coral recover from bleaching at each cell on the globe, we considered two extreme options for coral and fish recovery: instantaneous (figure 6b–d), or never (figure 6f–h). Combining high and low warming rates with high and low recovery rates helped us bound fish diversity declines between two scenarios. In the most optimistic scenario (little warming and rapid coral and fish recovery after bleaching), reefs were greater than 95% intact and local fish diversity declined very little (1%) by 2060. In the least optimistic scenario (rapid warming and no coral and fish recovery after bleaching), reefs were greater than 95% gone and local fish diversity declined 40% by 2060. The simulated rate that reef-fish diversity declined was, therefore, highly sensitive to future climate projections and recovery assumptions.
As before, losses in fish phylogenetic and functional entity diversity were buffered by redundancy at the species level (33% and 23%, respectively, under the least resilient assumption). Although the modelled loss of phylogenetic diversity was as expected, the modelled loss of functional entities was less than expected, especially under the least resilient assumption of no coral and fish recovery, suggesting coral loss will impact some functional entities more than others.
Even after accounting for shared environmental and geographical correlations, data pooled at the 1° × 1° scale cannot demonstrate cause–effect relationships between coral and fish diversity. Nor can the association between present-day coral diversity and present-day fish diversity (which may or may not be at equilibrium), tell us how fish diversity will respond to future coral diversity. However, the projected halving of fish diversity in response to complete coral loss found from experiments and reef-level observations [4,7] scales up from small field experiments, to reef transects, to global reef-fish communities, suggesting that a hypothetical world without corals would lack many fish species that do not depend directly on corals (figure 1d; electronic supplementary material, figure S14). Species losses following warming and coral mortality would likely extend to reef invertebrates as well [29], and fish loss could feed back to coral loss due to algal overgrowth and increased coral predators. On a positive note, because the hypothesized link between fish and coral diversity is more than twice that described as dependent on corals in the literature, conserving and restoring diverse coral communities could have broad benefits for marine biodiversity beyond a few obligate corallivorous fishes, so long as carbon emissions change little.
3. Material and methods
We obtained occurrence data for 7408 tropical marine fish species from both OBIS (http://www.iobis.org) and GBIF (https://www.gbif.org/), and used taxonomical and biogeographic information from FishBase to correct species nomenclature and exclude incorrect records. We used α-hulls [30] to draw species ranges from occurrences, which we then mapped (together with 119 coral genera ranges obtained merging coral species maps from IUCN, www.iucnredlist.org) across all reef localities worldwide (http://data.unep-wcmc.org/datasets/1) at a resolution of 1° × 1° latitude/longitude (figure 1a,b). We excluded 1° × 1° cells where there were no coral genera and/or fewer than 10 fish species and/or no reef habitat in depths less than 30 m, being left with a total of 1708 cells. We validated the obtained fish distribution data with an independent dataset, GASPAR [31], obtaining a median TSS of 0.47, with a median sensitivity of 0.67, and a median specificity of 0.94, indicating that our mapped ranges were sufficiently conservative and rarely generated false presences. We chose to focus on coral genera instead of coral species so as not to overestimate local species richness derived from the use of broad distributional ranges. With this, we are taking the conservative assumption that the coral dependency/specialization of fish does not go up to the species level (i.e. we are assuming, for example, that a fish that eats Acropora can consume all the species within the genera).
As a reference for the dependency of fish on corals, we obtained information about the coral dependency of 6315 species by combining literature sources [13–16], identifying three different types of dependency: obligate corallivory, facultative corallivory and generic association to reef habitat (for example, use of coral for shelter and/or recruitment). We combined such literature on fish dependency and fish distribution into a global map of coral-dependent fish based on natural history.
We independently projected fish coral dependency using associations between fish richness and coral (genera) revealed by structural equation modelling. We explored several different model structures for describing fish diversity while accounting for major environmental and biogeographic factors that affect fish and coral diversity, namely mean surface water temperature; temperature annual range; salinity; pH; primary productivity; fraction of 1° × 1° cell area within 0–30 m; fraction of cell area intersecting reef habitat (according to http://data.unep-wcmc.org/datasets/1); isolation (total land area surrounding a reef locality within a radius of 5° latitude/longitude); marine biogeographic region of belonging [17]; absolute latitude. The environmental data (surface temperature, salinity, pH and total chlorophyll as a proxy for productivity) were obtained from [32]. Reef area and shallow habitat area helped account for expected species–area relationships that drive diversity. We explored models with and without latent variables and with and without nonlinear responses (in particular, we tested alternative models where the environmental variables were either or not included as quadratic terms). Model selection began with a complex network of putative drivers for coral and fishes as well as hypothesized drivers of drivers (e.g. latitude affects temperature and temperature and latitude affects diversity). We selected the final model based on fit indices (χ2/d.f. ratio, p-value, cfi, tli, aic, bic, rmsea, srmr and goodness of fit between observed and modelled diversity) and model complexity (preferring simple models) and ecological realism. We provide all the code and data ensuring full replicability of the analyses at https://github.com/giovannistrona/fish_coral. In addition, we provide schematic of 20 alternative models in electronic supplementary material, figures S2–S10.
Semivariograms for fish diversity versus independent variables and coral diversity versus independent variables showed spatial autocorrelation, which can affect p-values used to assess statistical significance. However, a linear spatial correction did not affect the significance of the coefficients and produced a model consistent with the non-spatial corrected one, with coral diversity remaining a major driver of fish diversity (electronic supplementary material, table S1).
We used the model to quantify fish coral dependency, which we computed for each cell as cd = (Fp – F0)/Fp, where Fp is the fish richness estimated by the model (based on current coral diversity), and F0 is the fish diversity predicted by the model when coral richness is set to zero. In addition, we computed the hypothetical expected loss of fish diversity in a coral-less world as cd × Fc, and the expected remaining fish diversity as Fc − (cd × Fc).
We plotted expected fish diversity (in total species and proportion of species) as a function of expanding coral loss in space. We modelled fish diversity loss as a continuous function of coral loss by progressively increasing the number of grid cells affected by mass mortality from none to all reef cells. To account for sensitivity to the order in which reef localities lose coral diversity, we generated different curves where coral mortality was imposed at (i) random; (ii) from the largest to the lowest fraction of coral-dependent fishes (least robust assumption); (iii) from the lowest to the largest fraction of coral-dependent fishes (most robust assumption).
We then plotted how fish diversity (in total species and proportion of species) might respond to warming temperatures over time (2020 to 2100). We referred to the Coupled Model Intercomparison Project Phase 6 (CMIP6) global circulation model for surface water temperature, using three different climate projections—SSP2–4.5, SSP3–7.0 and SSP5–8.5 (with SSP2–4.5 and SSP5 8.5 being approximately equivalent to updated versions of CMIP5 projection RCP4.5 and RCP8.5, and SSP3–7.0 being a new intermediate projection). In particular, we used the NCAR CESM2 WACCM model output [33], that we downloaded at a resolution of 1 × 1° grid from esgf node.llnl.gov/search/cmip6. We connected coral loss to temperature by predicting mass mortality due to bleaching in a reef cell whenever the predicted local monthly temperature was 2°C warmer than the mean temperature of the warmest (not the current) month in a reference period (2015–2020). This was more conservative than the 1.0°C of anomaly as a threshold for heat stress leading to coral bleaching used by NOAA as a criterion to identify bleaching hot spots, following ([34], see https://coralreefwatch.noaa.gov/satellite/methodology/methodology.php). Our most resilient scenario allowed fish and coral diversity to recover after bleaching, whereas our least resilient scenario allowed no recovery after the first mass bleaching event. Given the variability in thermal tolerance among different coral species and populations, and corals' potential for acclimation and the adaptive acquisition of climate resistance [35], the reality is likely somewhere in between.
We used this same analytical framework to explore the effect of coral loss on fish phylogenetic and functional diversity. To quantify fish phylogenetic diversity in each reef locality (i.e. 1° × 1° cell), we first extracted a subtree including all bony fish species in our dataset from a complete fish phylogeny obtained using the R package fishtree [36], and then we computed phylogenetic diversity as PD according to [37] for each set of species in a target locality using the R package PhyloMeasures [38].
In addition, for each locality, we also counted the number of unique functional entities, using the same approach (and data) from [39]. We associated each species in our dataset with six categorical functional traits, namely size class (7.1–15, 15.1–30, 30.1–50, 50.1–80 and greater than 80 cm); mobility (sedentary, mobile within a reef, mobile between reefs); period of activity (diurnal, nocturnal, both); schooling (solitary, pairing, 3–20 individuals, 20–50 individuals, greater than 50 individuals); vertical position in the water column (benthic, bentho-pelagic, pelagic); diet (herbivorous–detritivorous, macroalgal herbivorous, invertivorous targeting sessile invertebrates, invertivorous targeting mobile invertebrates, planktivorous, piscivorous, omnivorous). We then identified each realized combination of different traits as an individual functional entity, and we finally counted the number of unique functional entities in each locality.
We tested the same SEM designs used to model fish species richness, replacing the variable corresponding to the number of fish species with either the local measure of phylogenetic diversity or the number of functional entities. As both variables scale nonlinearly (specifically, logarithmically) with fish species richness, we transformed them in the model as xa, with a = 1.7 for phylogenetic diversity and a = 3 for functional entities (which ensured the best linearization, with an R2 of 0.999 for phylogenetic diversity versus fish species richness, and of 0.971 for functional entities versus fish species richness). We back-transformed the statistical predictions to interpret them in the original scale.
As for fish species richness, we chose models for phylogenetic and functional entity diversity showing the best compromise between fit, simplicity and ecological realism (see electronic supplementary material, figures S15–S17 and tables S3 and S4). The models were similarly used to project the expected loss of phylogenetic and functional entity diversity when local coral diversity was reduced to zero, for the same set of scenarios applied to fish richness. To assess whether some higher-order taxa or functional entities were more sensitive to coral loss than others, we computed the expected loss of phylogenetic and functional diversity if fish species had declined at random. At each reef locality, we generated 100 depleted fish assemblages by randomly removing the projected number of lost species from the full local assemblage. We then computed the average phylogenetic and functional entity diversity for each randomly depleted local fish assemblage.
Supplementary Material
Acknowledgements
We thank Jordan M. Casey and Claudio Castellano for commenting on the first version of this paper.
Data accessibility
We provide all the code and data ensuring full replicability of the analyses at https://github.com/giovannistrona/fish_coral.
Authors' contributions
G.S.: conceptualization, data curation, formal analysis, investigation, methodology, resources, software, visualization, writing—original draft, writing—review and editing; K.D.L.: conceptualization, formal analysis, investigation, methodology, supervision, validation, writing—original draft, writing—review and editing; R.A.: conceptualization, methodology, writing—review and editing; S.F.: conceptualization, methodology, validation, writing—original draft, writing—review and editing; P.S.A.B.: conceptualization, methodology, writing—original draft, writing—review and editing; F.G.: conceptualization, writing—review and editing; S.M.: conceptualization, writing—review and editing; D.S.: conceptualization, writing—review and editing; P.G.: conceptualization, writing—review and editing; S.P.: conceptualization, resources, supervision, writing—review and editing; V.P.: conceptualization, data curation, formal analysis, funding acquisition, methodology, resources, software, writing—original draft, writing—review and editing. All authors gave final approval for publication and agreed to be held accountable for the work performed therein.
Competing interests
We declare we have no competing interests.
Funding
The study was partly funded by the Exploratory Project EUReefs of the European Commission, Joint Research Centre. V.P. was supported by the Institut Universitaire de France (IUF), the BNP Paribas Foundation (Reef Services Project) and the French National Agency for Scientific Research (ANR; REEFLUX Project; ANR 17 CE32 0006). K.D.L. was supported by the USGS Emerging Disease research programme. This research is also the product of the SCORE-REEF group funded by the Centre de Synthèse et d'Analyse sur la Biodiversité (CESAB) of the Foundation pour la Recherche sur la Biodiversité (FRB) and the Agence Nationale de la Biodiversité (AFB).
Disclaimer
The findings and conclusions in this article are those of the author(s) and do not represent the views or the official position of the European Commission. Any use of trade, product or firm names in this publication is for descriptive purposes only and does not imply endorsement by the US Government.
References
- 1.van Hooidonk R, Maynard J, Tamelander J, Gove J, Ahmadia G, Raymundo L, Williams G, Heron SF, Planes S. 2016. Local-scale projections of coral reef futures and implications of the Paris Agreement. Sci. Rep. 6, 39666. ( 10.1038/srep39666) [DOI] [PMC free article] [PubMed] [Google Scholar]
- 2.Ferreira CE, Goncçalves JE, Coutinho R. 2001. Community structure of fishes and habitat complexity on a tropical rocky shore. Environ. Biol. Fish. 61, 353-369. ( 10.1023/A:1011609617330) [DOI] [Google Scholar]
- 3.Jones GP, McCormick MI, Srinivasan M, Eagle JV. 2004. Coral decline threatens fish biodiversity in marine reserves. Proc. Natl Acad. Sci. USA 101, 8251-8253. ( 10.1073/pnas.0401277101) [DOI] [PMC free article] [PubMed] [Google Scholar]
- 4.Glynn PW. 2006. Fish utilization of simulated coral reef frameworks versus eroded rubble substrates off Panamá, eastern Pacific. Proc. 10th Int. Coral. Reef. Symp. 1, 250-256. [Google Scholar]
- 5.Duffy JE, Lefcheck JS, Stuart-Smith RD, Navarrete SA, Edgar GJ. 2016. Biodiversity enhances reef fish biomass and resistance to climate change. Proc. Natl Acad. Sci. USA 113, 6230-6235. ( 10.1073/pnas.1524465113) [DOI] [PMC free article] [PubMed] [Google Scholar]
- 6.Robinson JP, Wilson SK, Jennings S, Graham NA. 2019. Thermal stress induces persistently altered coral reef fish assemblages. Glob. Change Biol. 25, 2739-2750. ( 10.1111/gcb.14704) [DOI] [PubMed] [Google Scholar]
- 7.Komyakova V, Munday PL, Jones GP. 2013. Relative importance of coral cover, habitat complexity and diversity in determining the structure of reef fish communities. PLoS ONE 8, e83178. ( 10.1371/journal.pone.0083178) [DOI] [PMC free article] [PubMed] [Google Scholar]
- 8.Wilson SK, Graham NA, Pratchett MS, Jones GP, Polunin NV. 2006. Multiple disturbances and the global degradation of coral reefs: are reef fishes at risk or resilient? Glob. Change Biol. 12, 2220-2234. ( 10.1111/j.1365-2486.2006.01252.x) [DOI] [Google Scholar]
- 9.Pratchett MS, Hoey AS, Wilson SK, Messmer V, Graham NAJ. 2011. Changes in biodiversity and functioning of reef fish assemblages following coral bleaching and coral loss. Diversity 3, 424-452. ( 10.3390/d3030424) [DOI] [Google Scholar]
- 10.Pratchett MS, Thompson CA, Hoey AS, Cowman PF, Wilson SK. 2018. Effects of coral bleaching and coral loss on the structure and function of reef fish assemblages. In Coral bleaching (eds van Oppen MJH, Lough JM), pp. 265-293. Cham, Switzerland: Springer. [Google Scholar]
- 11.Graham NAJ, Nash KL. 2013. The importance of structural complexity in coral reef ecosystems. Coral Reefs 32, 315-326. ( 10.1007/s00338-012-0984-y) [DOI] [Google Scholar]
- 12.Darling ES, Graham NA, Januchowski-Hartley FA, Nash KL, Pratchett MS, Wilson SK. 2017. Relationships between structural complexity, coral traits, and reef fish assemblages. Coral Reefs 36, 561-575. ( 10.1007/s00338-017-1539-z) [DOI] [Google Scholar]
- 13.Cole AJ, Pratchett MS, Jones GP. 2008. Diversity and functional importance of coral-feeding fishes on tropical coral reefs. Fish Fish. 9, 286-307. ( 10.1111/j.1467-2979.2008.00290.x) [DOI] [Google Scholar]
- 14.Graham NAJ, et al. 2011. Extinction vulnerability of coral reef fishes. Ecol. Lett. 14, 341-348. ( 10.1111/j.1461-0248.2011.01592.x) [DOI] [PMC free article] [PubMed] [Google Scholar]
- 15.Nash KL, Graham NA, Bellwood DR. 2013. Fish foraging patterns, vulnerability to fishing, and implications for the management of ecosystem function across scales. Ecol. Appl. 23, 1632-1644. ( 10.1890/12-2031.1) [DOI] [PubMed] [Google Scholar]
- 16.Coker DJ, Wilson SK, Pratchett MS. 2014. Importance of live coral habitat for reef fishes. Rev. Fish Biol. Fish. 24, 89-126. ( 10.1007/s11160-013-9319-5) [DOI] [Google Scholar]
- 17.Spalding MD, et al. 2007. Marine ecoregions of the world: a bioregionalization of coastal and shelf areas. BioScience 57, 573-583. ( 10.1641/B570707) [DOI] [Google Scholar]
- 18.Holbrook SJ, Schmitt RJ, Messmer V, Brooks AJ, Srinivasan M, Munday PL, Jones GP. 2015. Reef fishes in biodiversity hotspots are at greatest risk from loss of coral species. PLoS ONE 10, e0124054. ( 10.1371/journal.pone.0124054) [DOI] [PMC free article] [PubMed] [Google Scholar]
- 19.Messmer V, Jones GP, Munday PL, Holbrook SJ, Schmitt RJ, Brooks AJ. 2011. Habitat biodiversity as a determinant of fish community structure on coral reefs. Ecology 92, 2285-2298. ( 10.1890/11-0037.1) [DOI] [PubMed] [Google Scholar]
- 20.Bellwood DR, Goatley CH, Bellwood O. 2017. The evolution of fishes and corals on reefs: form, function and interdependence. Biol. Rev. 92, 878-901. ( 10.1111/brv.12259) [DOI] [PubMed] [Google Scholar]
- 21.Strona G, Lafferty KD. 2016. Environmental change makes robust ecological networks fragile. Nat. Commun. 7, 1-7. ( 10.1038/ncomms12462) [DOI] [PMC free article] [PubMed] [Google Scholar]
- 22.Strona G, Bradshaw CJ. 2018. Co-extinctions annihilate planetary life during extreme environmental change. Sci. Rep. 8, 1-12. ( 10.1038/s41598-018-35068-1) [DOI] [PMC free article] [PubMed] [Google Scholar]
- 23.O'Neill BC, et al. 2016. The scenario model intercomparison project (ScenarioMIP) for CMIP6. Geosci. Model Dev. 9, 3461-3482. ( 10.5194/gmd-9-3461-2016) [DOI] [PMC free article] [PubMed] [Google Scholar]
- 24.Garpe KC, Yahya SA, Lindahl U, Öhman MC. 2006. Long-term effects of the 1998 coral bleaching event on reef fish assemblages. Mar. Ecol. Prog. Ser. 315, 237-247. ( 10.3354/meps315237) [DOI] [Google Scholar]
- 25.Wilson SK, Dolman AM, Cheal AJ, Emslie MJ, Pratchett MS, Sweatman HPA. 2009. Maintenance of fish diversity on disturbed coral reefs. Coral Reefs 28, 3-14. ( 10.1007/s00338-008-0431-2) [DOI] [Google Scholar]
- 26.Magel JM, Dimoff SA, Baum JK. 2020. Direct and indirect effects of climate change-amplified pulse heat stress events on coral reef fish communities. Ecol. Appl. 30, e02124. ( 10.1002/eap.2124) [DOI] [PubMed] [Google Scholar]
- 27.Graham NA, Wilson SK, Jennings S, Polunin NV, Bijoux JP, Robinson J. 2006. Dynamic fragility of oceanic coral reef ecosystems. Proc. Natl Acad. Sci. USA 103, 8425-8429. ( 10.1073/pnas.0600693103) [DOI] [PMC free article] [PubMed] [Google Scholar]
- 28.Graham NA. 2014. Habitat complexity: coral structural loss leads to fisheries declines. Curr. Biol. 24, R359-R361. ( 10.1016/j.cub.2014.03.069) [DOI] [PubMed] [Google Scholar]
- 29.Glynn PW. 2011. In tandem reef coral and cryptic metazoan declines and extinctions. Bull. Mar. Sci. 87, 767-794. ( 10.5343/bms.2010.1025) [DOI] [Google Scholar]
- 30.García-Roselló E, et al. 2015. Can we derive macroecological patterns from primary Global Biodiversity Information Facility data? Global Ecol. Biogeogr. 24, 335-347. ( 10.1111/geb.12260) [DOI] [Google Scholar]
- 31.Parravicini V, et al. 2013. Global patterns and predictors of tropical reef fish species richness. Ecography 36, 1254-1262. ( 10.1111/j.1600-0587.2013.00291.x) [DOI] [Google Scholar]
- 32.Assis J, Tyberghein L, Bosh S, Verbruggen H, Serrão EA, De Clerck O. 2017. Bio-ORACLE v2.0: extending marine data layers for bioclimatic modelling. Global Ecol. Biogeogr. 27, 277-284. ( 10.1111/geb.12693) [DOI] [Google Scholar]
- 33.Danabasoglu G. 2019. NCAR CESM2-WACCM model output prepared for CMIP6 ScenarioMIP. Version 20200616. Earth System Grid Federation. See 10.22033/ESGF/CMIP6.10026. [DOI]
- 34.Glynn PW, D'Croz L. 1990. Experimental evidence for high temperature stress as the cause of El Nino coincident coral mortality. Coral Reefs 8, 181-191. ( 10.1007/BF00265009) [DOI] [Google Scholar]
- 35.Palumbi SR, Barshis DJ, Traylor-Knowles N, Bay RA. 2014. Mechanisms of reef coral resistance to future climate change. Science 344, 895-898. ( 10.1126/science.1251336) [DOI] [PubMed] [Google Scholar]
- 36.Chang J, Rabosky DL, Smith SA, Alfaro ME. 2019. An R package and online resource for macroevolutionary studies using the ray-finned fish tree of life. Methods Ecol. Evol. 10, 1118-1124. ( 10.1111/2041-210X.13182) [DOI] [Google Scholar]
- 37.Faith DP. 1992. Conservation evaluation and phylogenetic diversity. Biol. Conserv. 61, 1-10. ( 10.1016/0006-3207(92)91201-3) [DOI] [Google Scholar]
- 38.Tsirogiannis C, Sandel B. 2015. PhyloMeasures: a package for computing phylogenetic biodiversity measures and their statistical moments. Ecography 39, 709-714. ( 10.1111/ecog.01814) [DOI] [Google Scholar]
- 39.Mouillot D, et al. 2014. Functional over-redundancy and high functional vulnerability in global fish faunas on tropical reefs. Proc. Natl Acad. Sci. USA 111, 13 757-13 762. ( 10.1073/pnas.1317625111) [DOI] [PMC free article] [PubMed] [Google Scholar]
Associated Data
This section collects any data citations, data availability statements, or supplementary materials included in this article.
Supplementary Materials
Data Availability Statement
We provide all the code and data ensuring full replicability of the analyses at https://github.com/giovannistrona/fish_coral.


