

Abstract
Microalgae-based products have gained growing interest leading to an increase in large-scale cultivation. However, the high energy associated with microalgae harvesting becomes one of the bottlenecks. This study evaluated an energy-efficient microalga harvesting via ultra-low-pressure membrane (ULPM) filtration (<20 kPa) in combination with aeration. ULPM offered various benefits especially in terms of reducing the energy consumption due to it operated under low transmembrane pressure (TMP). High TMP often associated with high pumping energy hence would increase the amount of energy consumed. In addition, membrane with high TMP would severely affect by membrane compaction. Results showed that membrane compaction leads to up to 66 % clean water permeability loss when increasing the TMP from 2.5 to 19 kPa. The Chlorella vulgaris broth permeabilities decreased from 1660 and 1250 to 296 and 251 L/m2hrbar for corresponding TMPs for system with and without aeration, respectively. However, it was found that membrane fouling was more vulnerable at low TMP due to poor foulant scouring from a low crossflow velocity in which up to 56 % of permeability losses were observed. Membrane fouling is the biggest drawback of membrane system as it would reduce the membrane performance. In this study, aeration was introduced as membrane fouling control to scour-off the foulant from membrane surface and pores. In terms of energy consumption, it was observed that the specific energy consumption for the ULPM were very low of up to 4.4 × 10⁻³ kWh/m3. Overall, combination of low TMP with aeration offers lowest energy input.
Keywords: Membrane fouling, Low pressure membrane system, Microalgae filtration, Aeration, Energy consumption
Membrane fouling; Low pressure membrane system; Microalgae filtration; Aeration; Energy consumption.
1. Introduction
Microalgae-based products such as food, feed and nutraceutical supplements, cosmetics and even biofuels have gained growing interest leading to an increase in large-scale cultivation of microalgal biomass (Barkia et al., 2019; Spolaore et al., 2006). However, widespread production of microalgae-based products has been limited by the lack of an efficient microalgae harvesting technique, mainly due to the small size of microalgae cells with culture density very close to water, low concentration of the cultures requiring high amounts water to be removed leading to high energy input and processing costs (Bilad et al., 2014a; Liao et al., 2018). Conventional methods for microalgal harvesting including centrifugation, gravity sedimentation, flotation screening, and flocculation face several critical limitations. They are either energy-intensive (centrifugation), time-consuming (gravity sedimentation), or toxic to microalgal biomass (chemical coagulation/flocculation), which hinder their sustainable application (Barros et al., 2015; Singh and Patidar, 2018).
Membrane-based filtration has emerged as a promising alternative technology for microalgae harvesting (Bilad et al., 2014a; Lau et al., 2020). It utilizes minimum chemicals only for occasional cleaning thus preventing the end-product contamination, works at room temperature which preserves some active compounds in the microalgae biomass (i.e., avoid protein denaturation), and when applied in continuous process allows for reuse of excess nutrient and culture medium reuse lowering the investment and energy demands (Bilad et al., 2014b; Zhang et al., 2010). These advantages turn membrane-based microalgae biomass harvesting attractive for processing of all range of microalgae-based products (low- and high-value products).
The major challenge for microalgae harvesting by membrane process is membrane fouling, which causes a significant flux reduction and more importantly inflating the energy consumption (Lau et al., 2020; Razak et al., 2020). The microalgae cells and their extracellular organic matter (EOM) can form a cake layer on the membrane surface which increase the filtration resistance overtime leading to permeability loss (Discart et al., 2014; Liao et al., 2018). In addition, cross flow velocity, typically applied to scour-off foulant, also induces the release of EOM that could worsen the membrane fouling (Frappart et al., 2011; Zhang et al., 2019). Therefore, an effective membrane fouling control that offers more sustained performance under low energy input was thus required and was addressed in this study via application of ultra-low pressure membrane (ULPM) filtration system in combination with aeration (air bubbling). ULPM is an attractive filtration system due to it offers low energy consumption, however ULPM as a standalone system without installation would severely affect by membrane fouling. This is due to insufficient force from ULPM to scour-off the foulant from membrane surface and pores. Hence, membrane fouling control method need to be employed to overcome this issue. In this study, air bubbling was used as membrane fouling control to improve the performance of ULPM filtration system.
Air bubbling is one of standard methods for membrane fouling control and has been well reported for membrane fouling control microalgae filtration (Eliseus et al., 2017; Eliseus and Bilad, 2017) as well as for ultrafiltration surface water or pretreatment seawater containing microalgae for desalination using reverse osmosis. Aeration helps to remove the foulant by inducing local mixing of turbulence flow and the travelling bubble atop the membrane surface also induce drag and lift forces that helps to scour off the foulant but at the same time acts as energy consuming factor. Eliseus et al. (2017) attributed 88 % of foulant removed by air bubbling, while only 10% of foulant removed by exploiting crossflow velocity in absence of bubbling. The effectiveness of aeration as membrane fouling control for microalgae filtration is more effective at higher aeration rates which also associates with higher aeration energy (Böhm et al., 2012; Eliseus et al., 2017; Eliseus and Bilad, 2017). By considering efficacy of aeration in membrane fouling control as well as the energy input associate with it, systematic assessment on the overall application of aeration is thus required.
Based on the applied transmembrane pressure (TMP), pressure driven system can be classified into high-pressure membrane (HPM) and low-pressure membrane (LPM). Classically, LPM operates under low TMP in range of 1–2 bar, meanwhile HPM operated at higher TMP (>2 bar) (Huang et al., 2009). Recently, ULPM filtration system has also been introduced for filtration under TMP of <0.2 bar. The ULPM system has gain popularity due to its potential in lowering the specific energy consumption because of the operation can simply be driven simply by gravity via the hydrostatic pressure (Pronk et al., 2019). In addition, ULPM is considered highly attractive because it offers less impact to environment, easy automation, low energy consumption and high efficiency in removing pathogen, organic matter and turbidity (Gamage and Chellam, 2011; Lai et al., 2015). It was recently reported that under ULPM via a gravity driven filtration, green algae had insignificant effects and the presence of algal cells mostly contributed to reversible fouling (Truttmann et al., 2020). In a crossflow membrane filtration system, high feed pressure couples with high volumetric velocity which is associated with high pumping energy. It prompts the application of ULPM system that potentially reduce the energy input. In addition, operation under ULPM leads to lower fluxes that hinders the foulant build-up dragged by the high permeate flow.
In this study, we exploit the role of crossflow velocity (represented by the TMP) and aeration rate in enhancing hydraulic performance as well as the consequences on the energy consumption for Chlorella vulgaris filtration. The tests were done using a home-made flat sheet polyvinylidene difluoride (PVDF) membrane prepared via the phase inversion process. After preparation, the membrane was characterized in terms of surface morphology, pore size distribution, thickness, porosity and contact angle before being evaluated in crossflow membrane filtration setup. Subsequently, the effects of applied pressure on membrane compaction was evaluated since it was found in the preliminary study that the clean water permeability was strongly affected by the applied pressure. Finally, the effects of applied pressure and aeration rates on hydraulic performance and energy consumption were evaluated.
2. Material and methods
2.1. Microalgae feed
The method for cultivating Chlorella vulgaris medium used as the feed for filtration was adapted from an earlier study (Dasan et al., 2020). A 5 L of tap water without sterilization were inoculated with 10 mL of Chlorella vulgaris seed. The photobioreactor (PBR) was operated semi-batch wise. The organic nutrients were supplied in a form of concentrated stock solution fed at the beginning of the cultivation. The PBR was continuously illuminated with light intensity of 4440–5180 Lux to supply the energy and was aerated to supply the inorganic carbon. The Chlorella vulgaris was harvested after two weeks of cultivation when the batch cultivation reached the stationary phase with biomass concentration of 1 g/L.
2.2. Membrane fabrication and characterization
The membrane sheet was fabricated from a dope solution containing 15 wt% of PVDF (molecular weight of 300 kDa, Sigma-Aldrich, St. Louis, MO, USA) as the polymer, 84 wt% of dimethylacetamide (DMAC) (Sigma-Aldrich, St. Louis, MO, USA) as the solvent, and additives of 0.5 wt% of lithium chloride (LiCl, Sigma-Aldrich, St. Louis, MO, USA) and 0.5 wt% of polyethylene glycol (PEG, Sigma-Aldrich, St. Louis, MO, USA). The membrane was prepared via immersion precipitation method by using demineralized water as the non-solvent. The mixture of components in the dope solution was stirred at 600 rpm using magnetic stirrer at temperature 60 °C for overnight to allow complete dissolution. The solution was casted on top of non-woven support using a doctor blade with a gap of 0.22 mm. The cast film was then immersed in a bath containing demineralized water immediately after casting. The membrane was stored wet until usage.
The synthesized membrane sample was characterized in terms of surface morphology, surface cross section, pore size distribution, thickness, porosity and contact angle using scanning electron microscopy (SEM, Quanta-250, FEI, Thermo Fisher, Hillsboro, OR, USA), capillary flow porometer (CFP, Porous Materials, Inc., Ithaca, NY, USA), goniometer, capillary flow porometer, digital micrometer (Mitutoyo, Kawasaki, Japan), gravimetrically measured using dry–wet method and goniometer (OCA 20, Data Physics, Filderstadt, Germany).
2.3. Crossflow filtration
The membrane filtration performance was evaluated using in crossflow filtration (CFF) system as illustrated in Figure 1. The same setup was also used to evaluate the clean water permeability using pure water as the feed. The membrane sheet with an effective area of 22.4 cm2 was assembled into the filtration cell. The membrane filtration performances were evaluated to investigate two parameters: transmembrane pressure and aeration. The transmembrane pressure was varied at 2.5, 5.0, 7.5, 0.1, 12.5, 0.15, 17.5 and 19.0 kPa, corresponding to the linear liquid velocities of 0.18, 0.30, 0.69, 0.85, 0.90, 1.03, 1.04 and 1.22 cm/s, and the aeration was evaluated under aerated and without. Each filtration test was done at least twice to ensure the reproducibility of the results and presented as average ±standard deviation. The trans-membrane pressure was adjusted by changing the rotation speed of the feed peristaltic pump. It is worth noting that in this study the TMP was altered by changing the crossflow velocity, due to set-up limitation. Higher crossflow velocities were required for filtration at higher ΔPs. Therefore, an independent study on the effect of TMP under constant crossflow velocity and vice versa could not be done. For the filtration system with aeration, the aeration was provided by flowing air using the additional flow channel of the pump resulting equal volumetric flow rate of the air and the liquid (Figure 2). Such approach was taken due to the difficulty in controlling aeration rate when supplied from an independent stream.
Figure 1.

Illustration of the crossflow filtration setup operated under full-recycle system. The trans membrane pressure and the aeration rate (when required) were adjusted by changing the rotation speed of the peristaltic pump.
Figure 2.
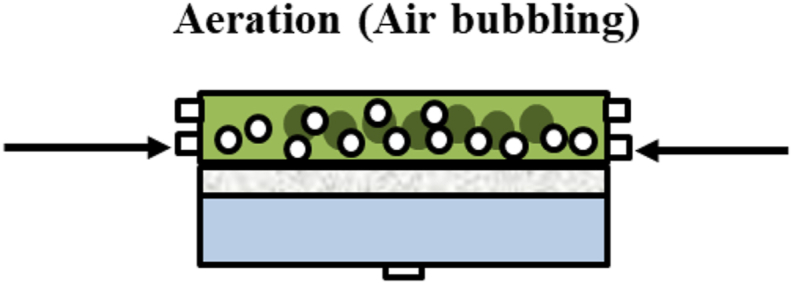
Illustration of the crossflow filtration setup showing the two-phase flow of liquid and gas from the supplied aeration.
Each filtration was run for 120 min, but the permeation data were collected every 20 min. It was observed that after 120 min of filtration, the permeability reached the quasi steady state value with minor changes when the filtration was further extended. After each test, membrane cleaning was performed by wiping gently the membrane surface with soft sponge and flushing with tap water which restore the permeability >90 % of the original value, otherwise by soaking membrane in 0.08 % of sodium hypochlorite solution for 2 hours. After each filtration test performed in this study, the permeability of the membrane could be restored >95 % of the pristine value as such the fouling history in form of irreversible fouling from earlier filtrations could be removed and thus did not affect the subsequent filtration test. Only one membrane coupon was used for all filtration test to avoid discrepancy due variation in the pristine membrane sample as suggested elsewhere (Bilad et al., 2011).
The permeate volume data were used to calculate the flux and permeability. After volume measurement, the permeate was returned to the feed to maintain constant feed condition, only small portion of permeate was collected for rejection test. The flux (), permeability () and biomass rejection (,%) were calculated using Eqs. (1), (2), and (3), respectively.
| (Eq.1) |
| (Eq.2) |
| (Eq.3) |
where is volume of permeate (L), membrane area (m2), filtration time (h), (or TMP) trans-membrane pressure (bar), concentration of microalgae biomass in the feed (g/L) and concentration of microalgae biomass in the permeate (g/L). The biomass concentration was measured using the gravimetry method.
2.4. Energy consumption estimation
To estimate the energy consumption of a full-scale filtration system, a hypothetical full-scale module was projected and some of operational parameters were taken from the ones applied in the filtration tests. For the non-aerated system, the energy consumption was fully attributed to the energy for feed pumping. However, for aerated system, additional aeration energy was included.
The full-scale module was assumed to be arranged vertically with effective panel width and height of 1.0 m and 2.0 m, respectively. The gap between two adjacent panels creating the channel for the feed flow was set to be 2 × 10⁻³ m. The crossflow velocity and the transmembrane pressure were set the same as the ones applied in the experiments. Based on the available information, the friction loss along the module was also included in the estimation. The feed pumping power (PF, kW) and specific feed pumping energy (, kWh/m3) for the liquid flow filtration were estimated using Eqs. (4) and (5), respectively.
| (Eq.4) |
| (Eq.5) |
where is volumetric velocity of the feed across the flow channel (m3/s), density of the feed (assumed to be 1,000 kg/m3), trans-membrane pressure (Pa), cross flow velocity across the flow channel (m/s), friction coefficient (J/kg), pump energy efficiency (was set at 80%) and volumetric flow rate of the permeate (m3/h) that can be calculated from the data of permeability, TMP and effective membrane area within the flow channel (2 sides x width x length of the panel = 4 m2).
The aeration energy (, kWh/m3) was estimated according to a method proposed elsewhere (Verrecht et al., 2008) and provided in Eq. (6). Based on the hypothetical full-scale module, the flow channel area of (gap ×width) = m2 existed in between the two panels where the feed liquid and air flow. Due to this configuration, the air could flow over membrane area of = (2 sides ×width × length) = 4.0 m2along the flow channel. The air bubble cross flow velocity (, m/s) was set the same as the one applied in the experiment. The pressure of the air entering the liquid flow stream (, Pa) was set 10 % higher than the applied liquid pressure. The filtration flux () was set according to the one obtained in the experiment. Other parameters including temperature (T), blower efficiency () and the distance of aerator nozzle from the surface of liquid (y), aerator constant ( were assumed to be 298 K, 80%, 2.0 m and ~1.4, respectively. This method does not represent the total energy consumption. The total specific energy consumption (, in kWh/m3) was then the sum of specific pumping and aeration energy as shown in Eq. (7).
| (Eq.6) |
| (Eq.7) |
3. Results and discussion
3.1. Membrane properties
Figure 3 shows SEM images and the pore size distribution of PVDF membrane applied for filtration of the Chlorella vulgaris broth. The SEM images show a typical asymmetric membrane prepared from the non-solvent. The PVDF membrane has a smooth surface with homogeneous surface pore distribution. The pore size distribution data in Figure 3C show that the minimum, maximum and mean pore size of the membrane are 0.06, 0.27 and 0.14 μm, suggesting that the PVDF membrane falls under microfiltration type. All the filtration tests show complete rejection of microalgal biomass as such the effect of pressure and aeration on the rejection results are not shown and not discussed thoroughly. The complete rejections obtained are expected since the membrane pore size is a way smaller that the size of the Chlorella vulgaris cells (cell sizes of ~2–10 μm). Similar complete rejection has also been reported for other microfiltration membranes for C. vulgaris medium filtration (Eliseus et al., 2017; Razak et al., 2020). Apart from the morphology and pore size characteristics, the membrane has a total thickness (including the nonwoven), porosity and contact angle of 210 μm, 76 % and 82°. Overall, it can be deduced from the characterization results that the applied membrane is suitable for Chlorella vulgaris harvesting. The energy saving associated with a low applied pressure with or without aeration are thus evaluated in the subsequent sections.
Figure 3.

SEM images of (A) surface and (B) cross-section, as well as the pore size distribution of the polyvinylidene fluoride membrane used for the filtration of the C. vulgaris medium.
3.2. Membrane compaction and membrane fouling
3.2.1. Effect of membrane compaction on clean water permeability
Figure 4 shows the effect of pressure on the clean water permeability and flux. Both flux and permeability are presented to show the severe impact of the applied TMP on the membrane compaction phenomenon. The significant decrease of permeability at higher TMP demonstrates the prominence of membrane compaction. Membrane compaction refers to physical compression of the membrane itself due to the applied TMP (Blazheska, 2016). The permeability decreases significantly from 2,770 L/m2hrbar under TMP of 2.5 kPa to about 376 L/m2hrbar under a TMP of 19 kPa. As reported by Bert (1969), these phenomenon is directly associated with the state hydration of membrane as the water is being forced out when the pressures is increased. This statement is supported by Lawson et al. (1995) that the pressure applied to the membrane system results in low membrane permeability causing by the compaction of membrane, mostly occurs for the pressure driven membrane applications. According to Stade et al. (2013), a decrease in permeability as function of TMP is a direct indication of membrane compaction.
Figure 4.

Steady-state permeability (left y-axis) and flux (right y-axis) as function of transmembrane pressure for the pure water permeability tests.
The finding on the permeability shown in Figure 4 suggest the importance of the applied TMP on permeability, particularly when considering the prominence effect of membrane compaction. The findings open possibility for operation of microalgae filtration under very low TMP without suffering significant loss on the filtration flux. As shown in Figure 4, membrane compaction results in significant drop of permeability at higher TMP but only corresponds to small increment of the flux from 60 L/m2hr at pressure of 2.5 kPa–75 L/m2hr at pressure of 19.0 kPa. The important effect of membrane compaction in affecting hydraulic performance was also reported recently for filtration of laundry wastewater (Bilad et al., 2020). Based on their findings, they claimed that the application of detergent wastewater filtration able to be operated under very low TMP (driven by only hydrostatic pressure) to avoid the membrane compaction phenomenon. They also suggested that system at lower TMP was found to have lesser fouling formation with less compressed fouling layer. Hence, would be beneficial for enhancing the membrane permeability. Also, lowering TMP able to reduce the total energy consumption as it often associated with applied TMP.
As shown from Figure 4, compaction leads to >80 % permeability loss. Mukherjee et al. (2016) in their study also found that the permeability decreases are more severed at higher TMP due to increment of concentration polarization which caused by more solutes convected near the surface of the membrane. The finding suggests the need for a custom-made membrane with good resistance from compaction under a very low applied pressure. When membrane is exposed to high TMP, it may lower the convection rate of permeate due to a decrease in overall membrane porosity (Nitto, 2001). Moreover, membrane compaction may also decrease the pore size or deform the pore geometry (Stade et al., 2013). As stated by Stade et al. (2013), this phenomenon is common for polymeric membranes for HPM systems, but less so in the ULPM filtration system. Polymeric membranes are highly porous and tend to experience larger stress distribution compared to less porous materials elevating the likelihood for compaction phenomenon. As higher pressure is applied, the macro void become smaller as the cavities within the membrane matrix have low mechanical stability.
3.2.2. Combined effect of membrane compaction and membrane fouling
Figure 5 shows that the trend of permeability for Chlorella vulgaris broth filtration as function of filtration time similar to the filtration of clean water. The decrease in permeability of clean water is attributed to the membrane compaction, while the decrease in permeability for Chlorella vulgaris broth filtration is attributed to both membrane compaction and membrane fouling. The difference between the clean water and Chlorella vulgaris broth can be assigned as the effect of membrane fouling, by assuming that the compaction is solely affected by the TMP and not by the feed. To separate the effect of membrane fouling and membrane compaction, the clean water permeability at each testing pressure was measured. The membrane fouling can then be calculated as the gap between the permeability of clean water versus the Chlorella vulgaris medium.
Figure 5.

Permeability profile as function of filtration time for the pure water and the microalgae (Chlorella vulgaris broth) filtrations under transmembrane pressures of 2.5 kPa and 19 kPa.
Figure 5 shows that the membrane fouling rate is higher at low TMP as shown by comparing the relative difference between clean water and Chlorella vulgaris broth permeabilities. The difference in permeability between clean water and microalgae caused by fouling is more prominence under TMP of 2.5 kPa compared to 19 kPa. The percentage difference in permeability at the end of the filtration between clean water and microalgae at TMP of 2.5 kPa and 19 kPa are 55 % and 34 %, respectively. The average of percentage difference of permeabilities over the full filtration for TMP of 2.5 kPa is around 56 % while, for TMP of 19 kPa is around 34 %. The finding suggests the dual roles of TMP in the crossflow filtration. At higher TMP, high crossflow velocity leads to a better membrane fouling control due to sweeping of foulant build-up by the feed flow. The sweeping impact is better at high crossflow velocity than the lower ones. A study also mentioned the fouling takes place due to hydrophobic interaction between membrane surface and the foulants where the foulants blocked the membrane pores caused membrane surface damaged as well as affecting the overall membrane performance (Sri Abirami Saraswathi et al., 2020). Nevertheless, it is not clear if increments in the permeability is accompanied by lower specific energy consumption. The tread-off between pressure, permeability and specific energy consumption comes to the fore when considering the membrane compaction phenomenon.
3.3. Effect of transmembrane pressure and aeration on hydraulic performance
3.3.1. Effect of transmembrane pressure
Figure 6 shows that higher TMP substantially reduces the permeability but to lesser degree increases the filtration flux. The highest permeability is achieved at the lowest TMP for both systems with and without aeration, corresponding to 1,911 and 1,250 L/m2hrbar, respectively. However, highest flux is showed at the highest TMP of 19 kPa with values of 47.8 and 31.2 L/m2hr for system with and without aeration, respectively. This finding is in accord with findings of Rios et al. (2011) in which permeability was negatively affected by the TMP, but increases the flux. High flux associates with lower required membrane area (i.e., membrane investment cost), while high TMP governed by high crossflow velocity associates well with the specific energy consumption (i.e., operational cost associated with pumping energy).
Figure 6.

The steady-state permeability (left y-axis) and flux (right y-axis) for the aerated and the non-aerated systems for Chlorella vulgaris broth filtrations.
When considering the energy cost, the finding suggests a filtration system operated under low TMP. However, the low crossflow velocity associated with low TMP leads to severe membrane fouling. As mentioned in Section 3.2, membrane fouling would inflate the maintenance, operation and energy cost, as also reported elsewhere (Gao et al., 2011). Due to the high fouling at low crossflow velocity, different approaches have been used as membrane fouling control techniques, but the one used in this study is the air bubbles generation (aeration). In the context of implementing membrane fouling control, the method must also comply with the requirement of low-energy input. The energy input for membrane fouling control must be smaller than the energy for permeate pumping to achieve certain system throughput.
Figure 6 shows the permeability and flux as a function of TMP measured for two different systems: without and with aeration. It is noticeable that the trend of permeability showed for both systems showed decrement as TMP increases, however the trend of flux showed increment as TMP increases for both systems. Results in Figure 6 suggest the importance of TMP selection, as it acts as the filtration driving force. At low crossflow velocity coupled with a low TMP, membrane is expected to have high tendency for fouling with lower flux (Rios et al., 2011; Zheng et al., 2018) while at high TMP, membrane able to enhance the flux by promoting its driving force hence, reduce fouling tendency (Zhang and Ding, 2015) in expense of high mechanical pumping energy (Cheryan and Kuo, 1984). As reported by Rinaldoni et al. (2009), losses in mechanical energy should be minimized in order to achieve highest possible efficiency for membrane filtration performance. The energy losses usually incorporated with electricity, pumps, membrane, valves as well as the system design (Méthot-Hains et al., 2016). Hence, selecting the most suitable TMP for membrane system is necessary to achieve highest possible membrane performance efficiency.
3.3.2. Effect of aeration
Figure 6 shows that the membrane system with aeration shows better performance in both permeability and flux under all TMPs (2.5, 5.0, 7.5, 10, 12.5, 15.0, 17.5 and 19.0 kPa). In terms of permeability, the highest value is shown for the lowest TMP of 2.5 kPa with value of 1,911 L/m2hrbar, which is 35 % higher than the system without aeration. Aeration is one of standard method to control membrane fouling, especially for the application of membrane bioreactor. It alleviates foulant by scouring off the foulant.
Figure 6 also shows that membrane system with aeration offers the highest flux at the highest TMP of 19 kPa, with a value of 48 L/m2hr. However, but the highest percentage difference between aerated and non-aerated system in terms of flux showed at the lowest TMP of 2.5 kPa with a value of 34.6 %. Overall, membrane in aerated system overtook non-aerated system under all TMP applied but the highest impact is shown at lowest TMP for both the permeability and the flux. The findings support the claim on the positive role of aeration in improving performance of low TMP membrane system by reducing the tendency of fouling formation. The findings on the flux and the permeability imply that it is desirable to apply low TMP and aeration even when the flux is lesser compared to high TMP. However, it is known that aeration may lead to additional energy consumption which affected the operational cost. Also, lower flux necessitates larger membrane filtration area requiring detailed energy consumption assessment.
3.4. Energy consumption assessment
Figure 7 shows that for both system with and without aeration, the energy consumption gradually increases at higher TMPs and aeration rates. The energy consumption was estimated to select the highest membrane performance efficiency with low energy consumption, a critical parameters in the microalgae harvesting process (Molina Grima et al., 2003). The microalgae biomass contributed to the main cost for the production of microalgae-based products (Norsker et al., 2011; Ruiz et al., 2016), in which 20–30 % of the total production costs are from harvesting stage (Brennan and Owende, 2010; Rawat et al., 2011; Uduman et al., 2010).
Figure 7.

Estimated of energy consumption as function of trans-membrane pressure for Chlorella vulgaris broth filtration.
As shown in Figure 7, both aerated and non-aerated systems showed increment in energy consumption at higher TMP. However, the aerated system consumed more energy compared to non-aerated system and this is due to the additional energy used for the aeration which were installed to control the membrane fouling formation in the system. It is found out that for aerated system, the energy consumption increased from 0.2 × 10⁻³ to 4.4 × 10⁻³ kWh/m3, while for the non-aerated system, the energy consumption increased from 0.1 × 10⁻³ to 3.0 × 10⁻³ kWh/m3 as the TMP increased from 2.5 to 19 kPa. It is worth noting that for the setup used in this study, the aeration rate also increased at higher TMP, which make the aeration energy higher at higher TMP. In all cases, the energy consumption of the non-aerated system always lower than the one with aeration implying that the fouling control promote by aeration was more energy intensive that the use of crossflow velocity exerted by higher TMP.
Based on the results obtained in this study, the energy consumption for membrane either in aerated or non-aerated system reported in this study are considered to be lower compared to reports in the literatures. Submerged microfiltration using magnetically induced membrane vibration offered energy consumption of 0.20 and 0.22 kWh/m3 for the filtration of Phaeodactylum tricornutum and Chlorella vulgaris, respectively (Bilad et al., 2013). A slightly higher energy consumption of 0.25 kWh/m3 was reported for an aerated system. It is worth noting that the low specific energy consumption reported in this study can be attributed to different estimation method. We also exclude further concentration step via a more energy-intensive centrifugation often adopted in the referred reports. Baerdemaeker et al. (2013) reported that when coupled with centrifugation, the full harvesting of biomass required higher energy consumption. In another study, Bilad et al. (2012) stated that for the application of submerged filtration, the energy consumption can be reduced to 0.40 kWh/m3. Bhave et al. (2012) estimated an energy consumption in a range of 0.3–0.7 kWh/m3 when hollow fiber and tubular membrane were used for microalgae harvesting.
When comparing the energy consumption of membrane filtration (also coupled with centrifugation) for microalgae filtration, the literature reports show a promisingly low energy compared to other processes. Uduman et al. (2010) found out that the typical energy consumption for other microalgae harvesting methods are: centrifugation, 8 kWh/m3; sedimentation, 0.1 kWh/m3; vibrating screen filter, 0.4 kWh/m3; chamber filter pressure, 0.88 kWh/m3; crossflow filtration, 2.06 kWh/m3; electrocoagulation; 0.8 to 1.5 kWh/m3; flocculation and dissolved air floatation, 10 to 20 kWh/m3. Cheryan (1998) mentioned the energy consumption for common microalgae harvesting process are: centrifugation, 8 kWh/m3; floatation, 10 to 20 kWh/m3; and filtration using depth media, 1 kWh/m3. Note that detailed analysis is required to strictly compare the values since the estimation of energy consumption from different reports typically adopt different assumptions.
The trade-off between operational (i.e., energy input) and capital expenditure (i.e., membrane investment cost) can be evaluated by comparing flux data in Figure 6 and specific energy consumption in Figure 7. Thanks to the aeration, operation under TMP of 2.5 kPa offers a filtration flux of 40.4 L/m2hr, slightly higher that an operation under TMP of 15 kPa with a flux of 40.4 L/m2hr. Aerated system under TMP 2.5 kPa requires energy input of as low as 0.27 Wh/m3, even much lower (almost one tenth) than an operation without aeration under a TMP of 15 kPa with energy input of 2.45 Wh/m3. Similar combination can be drawn from the data in Figures 6 and 7, demonstrating the efficacy of Chlorella vulgaris harvesting under low TMP with aeration to offer advantage in both opex and capex.
4. Conclusions
This study demonstrates the effectiveness of ULPM to lower energy input for Chlorella vulgaris broth filtration. High TMP substantially affected membrane compaction hence permeability loss. The Chlorella vulgaris broth permeabilities decrease from 1660 and 1250 to 296 and 251 L/m2hrbar for increasing TMPs from 2.5 to 19 kPa. Low TMP lowers compaction but vulnerable from membrane fouling. By considering the impact of TMP and aeration, combining low TMP and aeration can offer very low energy input of up to 4.4 × 10⁻³ kWh/m3. This study provides a new approach for an energy-saving and fouling-free membrane filtration for microalgae harvesting. Aeration is an approach used to control the fouling formation on membrane surface and pores by generating hydrodynamic condition that consists of drag force and lift force which able to scour-off the foulant from the membrane. It is worth noting that aeration able to improve the performance of membrane even though installation of aeration would increases the amount of energy consumption. Also, based on the energy consumption estimation in this study, the energy consumption for aerated system considered as low compared to the reported literatures.
Declarations
Author contribution statement
Wan Nur Aisyah Wan Osman: Performed the experiments; Analyzed and interpreted the data; Wrote the paper.
Normi Izati Mat Nawi: Performed the experiments; Wrote the paper.
Shafirah Samsuri & Muhammad Roil Bilad: Conceived and designed the experiments; Wrote the paper.
Asim Laeeq Khan: Analyzed and interpreted the data; Wrote the paper.
Hunaepi Hunaepi: Analyzed and interpreted the data.
Juhana Jaafar & Man Kee Lam: Contributed reagents, materials, analysis tools or data; Wrote the paper.
Funding statement
This work was supported by PETRONAS via YUTP445 FRG (Cost Centre: 015LC0-079).
Data availability statement
Data included in article/supp. material/referenced in article.
Declaration of interests statement
The authors declare no conflict of interest.
Additional information
No additional information is available for this paper.
References
- Baerdemaeker T.D., Lemmens B., Dotremont C., Fret J., Roef L., Goiris K., Diels L. Benchmark study on algae harvesting with backwashable submerged flat panel membranes. Bioresour. Technol. 2013;129:582–591. doi: 10.1016/j.biortech.2012.10.153. [DOI] [PubMed] [Google Scholar]
- Barkia I., Saari N., Manning S.R. Microalgae for high-value products towards human health and nutrition. Mar. Drugs. 2019;17:304. doi: 10.3390/md17050304. [DOI] [PMC free article] [PubMed] [Google Scholar]
- Barros A.I., Gonçalves A.L., Simões M., Pires J.C.M. Harvesting techniques applied to microalgae: a review. Renew. Sustain. Energy Rev. 2015;41:1489–1500. [Google Scholar]
- Bert J.L. Membrane compaction: a theoretical and experimental explanation. J. Polym. Sci. B Polym. Lett. 1969;7:685–691. [Google Scholar]
- Bhave R., Kuritz T., Powell L., Adcock D. Membrane-based energy efficient dewatering of microalgae in biofuels production and recovery of value added Co-products. Environ. Sci. Technol. 2012;46:5599–5606. doi: 10.1021/es204107d. [DOI] [PubMed] [Google Scholar]
- Bilad M.R., Arafat H.A., Vankelecom I.F.J. Membrane technology in microalgae cultivation and harvesting: a review. Biotechnol. Adv. 2014;32:1283–1300. doi: 10.1016/j.biotechadv.2014.07.008. [DOI] [PubMed] [Google Scholar]
- Bilad M.R., Declerck P., Piasecka A., Vanysacker L., Yan X., Vankelecom I.F.J. Development and validation of a high-throughput membrane bioreactor (HT-MBR) J. Membr. Sci. 2011;379:146–153. [Google Scholar]
- Bilad M.R., Discart V., Vandamme D., Foubert I., Muylaert K., Vankelecom I.F.J. Coupled cultivation and pre-harvesting of microalgae in a membrane photobioreactor (MPBR) Bioresour. Technol. 2014;155:410–417. doi: 10.1016/j.biortech.2013.05.026. [DOI] [PubMed] [Google Scholar]
- Bilad M.R., Discart V., Vandamme D., Foubert I., Muylaert K., Vankelecom I.F.J. Harvesting microalgal biomass using a magnetically induced membrane vibration (MMV) system: filtration performance and energy consumption. Bioresour. Technol. 2013;138:329–338. doi: 10.1016/j.biortech.2013.03.175. [DOI] [PubMed] [Google Scholar]
- Bilad M.R., Mat Nawi N.I., Subramaniam D.D., Shamsuddin N., Khan A.L., Jaafar J., Nandiyanto A.B.D. Low-pressure submerged membrane filtration for potential reuse of detergent and water from laundry wastewater. J. Water Process Eng. 2020;36:101264. [Google Scholar]
- Bilad M.R., Vandamme D., Foubert I., Muylaert K., Vankelecom I.F.J. Harvesting microalgal biomass using submerged microfiltration membranes. Bioresour. Technol. 2012;111:343–352. doi: 10.1016/j.biortech.2012.02.009. [DOI] [PubMed] [Google Scholar]
- Blazheska J. 2016. Insight in the Thin-Film Polyamide Membrane Structure after Compaction Doctoral Thesis 118. [Google Scholar]
- Böhm L., Drews A., Prieske H., Bérubé P.R., Kraume M. The importance of fluid dynamics for MBR fouling mitigation. Bioresour. Technol. 2012;122:50–61. doi: 10.1016/j.biortech.2012.05.069. [DOI] [PubMed] [Google Scholar]
- Brennan L., Owende P. Biofuels from microalgae—a review of technologies for production, processing, and extractions of biofuels and co-products. Renew. Sustain. Energy Rev. 2010;14:557–577. [Google Scholar]
- Cheryan M. Technomic Pub. Co; Lancaster, Pa: 1998. Ultrafiltration and Microfiltration Handbook. [Google Scholar]
- Cheryan M., Kuo K.P. Hollow fibers and spiral wound modules for ultrafiltration of whey: energy consumption and performance. J. Dairy Sci. 1984;67:1406–1413. [Google Scholar]
- Dasan Y.K., Lam M.K., Yusup S., Lim J.W., Show P.L., Tan I.S., Lee K.T. Cultivation of Chlorella vulgaris using sequential-flow bubble column photobioreactor: a stress-inducing strategy for lipid accumulation and carbon dioxide fixation. J. CO2 Util. 2020;41:101226. [Google Scholar]
- Discart V., Bilad M.R., Marbelia L., Vankelecom I.F.J. Impact of changes in broth composition on Chlorella vulgaris cultivation in a membrane photobioreactor (MPBR) with permeate recycle. Bioresour. Technol. 2014;152:321–328. doi: 10.1016/j.biortech.2013.11.019. [DOI] [PubMed] [Google Scholar]
- Eliseus A., Bilad M.R. Presented at the the 2nd International Conference on Applied Science and Technology 2017 (ICAST’17), Kedah, Malaysia. 2017. Improving membrane fouling control by maximizing the impact of air bubbles shear in a submerged plate-and-frame membrane module. [Google Scholar]
- Eliseus A., Bilad M.R., Nordin N.A.H.M., Putra Z.A., Wirzal M.D.H. Tilted membrane panel: a new module concept to maximize the impact of air bubbles for membrane fouling control in microalgae harvesting. Bioresour. Technol. 2017;241:661–668. doi: 10.1016/j.biortech.2017.05.175. [DOI] [PubMed] [Google Scholar]
- Frappart M., Massé A., Jaffrin M.Y., Pruvost J., Jaouen P. Influence of hydrodynamics in tangential and dynamic ultrafiltration systems for microalgae separation. Desalination. 2011;265:279–283. [Google Scholar]
- Gamage N.P., Chellam S. Aluminum electrocoagulation pretreatment reduces fouling during surface water microfiltration. J. Membr. Sci. 2011;379:97–105. [Google Scholar]
- Gao W., Liang H., Ma J., Han M., Chen Z., Han Z., Li G. Membrane fouling control in ultrafiltration technology for drinking water production: a review. Desalination. 2011;272:1–8. [Google Scholar]
- Huang H., Schwab K., Jacangelo J.G. Pretreatment for low pressure membranes in water treatment: a review. Environ. Sci. Technol. 2009;43:3011–3019. doi: 10.1021/es802473r. [DOI] [PubMed] [Google Scholar]
- Lai C.-H., Chou Y.-C., Yeh H.-H. Assessing the interaction effects of coagulation pretreatment and membrane material on UF fouling control using HPSEC combined with peak-fitting. J. Membr. Sci. 2015;474:207–214. [Google Scholar]
- Lau A.K.S., Bilad M.R., Nordin N.A.H.M., Faungnawakij K., Narkkun T., Wang D.K., Mahlia T.M.I., Jaafar J. Effect of membrane properties on tilted panel performance of microalgae biomass filtration for biofuel feedstock. Renew. Sustain. Energy Rev. 2020;120:109666. [Google Scholar]
- Lawson K.W., Hall M.S., Lloyd D.R. Compaction of microporous membranes used in membrane distillation. I. Effect on gas permeability. J. Membr. Sci. 1995;101:99–108. [Google Scholar]
- Liao Y., Bokhary A., Maleki E., Liao B. A review of membrane fouling and its control in algal-related membrane processes. Bioresour. Technol. 2018;264:343–358. doi: 10.1016/j.biortech.2018.06.102. [DOI] [PubMed] [Google Scholar]
- Méthot-Hains S., Benoit S., Bouchard C., Doyen A., Bazinet L., Pouliot Y. Effect of transmembrane pressure control on energy efficiency during skim milk concentration by ultrafiltration at 10 and 50°C. J. Dairy Sci. 2016;99:8655–8664. doi: 10.3168/jds.2016-11504. [DOI] [PubMed] [Google Scholar]
- Molina Grima E., Belarbi E.-H., Acién Fernández F.G., Robles Medina A., Chisti Y. Recovery of microalgal biomass and metabolites: process options and economics. Biotechnol. Adv. 2003;20:491–515. doi: 10.1016/s0734-9750(02)00050-2. [DOI] [PubMed] [Google Scholar]
- Mukherjee R., Mondal M., Sinha A., Sarkar S., De S. Application of nanofiltration membrane for treatment of chloride rich steel plant effluent. J. Environ. Chem. Eng. 2016;4:1–9. [Google Scholar]
- Nitto D. 2001. Design Parameters Affecting Performance 5. [Google Scholar]
- Norsker N.-H., Barbosa M.J., Vermuë M.H., Wijffels R.H. Microalgal production — a close look at the economics. Biotechnol. Adv. 2011;29:24–27. doi: 10.1016/j.biotechadv.2010.08.005. [DOI] [PubMed] [Google Scholar]
- Pronk W., Ding A., Morgenroth E., Derlon N., Desmond P., Burkhardt M., Wu B., Fane A.G. Gravity-driven membrane filtration for water and wastewater treatment: a review. Water Res. 2019;149:553–565. doi: 10.1016/j.watres.2018.11.062. [DOI] [PubMed] [Google Scholar]
- Rawat I., Ranjith Kumar R., Mutanda T., Bux F. Dual role of microalgae: phycoremediation of domestic wastewater and biomass production for sustainable biofuels production. Appl. Energy. 2011;88:3411–3424. [Google Scholar]
- Razak N.N.A.N., Rahmawati R., Bilad M.R., Pratiwi A.E., Elma M., Nawi N.I.M., Jaafar J., Lam M.K. Finned spacer for enhancing the impact of air bubbles for membrane fouling control in Chlorella vulgaris filtration. Bioresour. Technol. Rep. 2020;11:100429. [Google Scholar]
- Rinaldoni A.N., Tarazaga C.C., Campderrós M.E., Padilla A.P. Assessing performance of skim milk ultrafiltration by using technical parameters. J. Food Eng. 2009;92:226–232. [Google Scholar]
- Rios S.D., Clavero E., Salvadó J., Farriol X., Torras C. Dynamic microfiltration in microalgae harvesting for biodiesel production. Ind. Eng. Chem. Res. 2011;50:2455–2460. [Google Scholar]
- Ruiz J., Olivieri G., de Vree J., Bosma R., Willems P., Reith J.H., Eppink M.H.M., Kleinegris D.M.M., Wijffels R.H., Barbosa M.J. Towards industrial products from microalgae. Energy Environ. Sci. 2016;9:3036–3043. [Google Scholar]
- Singh G., Patidar S.K. Microalgae harvesting techniques: a review. J. Environ. Manag. 2018;217:499–508. doi: 10.1016/j.jenvman.2018.04.010. [DOI] [PubMed] [Google Scholar]
- Spolaore P., Joannis-Cassan C., Duran E., Isambert A. Commercial applications of microalgae. J. Biosci. Bioeng. 2006;101:87–96. doi: 10.1263/jbb.101.87. [DOI] [PubMed] [Google Scholar]
- Sri Abirami Saraswathi M.S., Rana D., Kaleekkal N.J., Divya K., Nagendran A. Investigating the efficacy of PVDF membranes customized with sulfonated graphene oxide nanosheets for enhanced permeability and antifouling. J. Environ. Chem. Eng. 2020;8:104426. [Google Scholar]
- Stade S., Kallioinen M., Mikkola A., Tuuva T., Mänttäri M. Reversible and irreversible compaction of ultrafiltration membranes. Separ. Purif. Technol. 2013;118:127–134. [Google Scholar]
- Truttmann L., Su Y., Lee S., Burkhardt M., Brynjólfsson S., Chong T.H., Wu B. Gravity-driven membrane (GDM) filtration of algae-polluted surface water. J. Water Process Eng. 2020;36:101257. [Google Scholar]
- Uduman N., Qi Y., Danquah M.K., Forde G.M., Hoadley A. Dewatering of microalgal cultures: a major bottleneck to algae-based fuels. J. Renew. Sustain. Energy. 2010;2 [Google Scholar]
- Verrecht B., Judd S., Guglielmi G., Brepols C., Mulder J.W. An aeration energy model for an immersed membrane bioreactor. Water Res. 2008;42:4761–4770. doi: 10.1016/j.watres.2008.09.013. [DOI] [PubMed] [Google Scholar]
- Zhang S., Gao Y., Liu Q., Ye J., Hu Q., Zhang X. Harvesting of Isochrysis zhanjiangensis using ultrafiltration: changes in the contribution ratios of cells and algogenic organic matter to membrane fouling under different cross-flow velocities. Algal Res. 2019;41:101567. [Google Scholar]
- Zhang W., Ding L. Investigation of membrane fouling mechanisms using blocking models in the case of shear-enhanced ultrafiltration. Separ. Purif. Technol. 2015;141:160–169. [Google Scholar]
- Zhang X., Hu Q., Sommerfeld M., Puruhito E., Chen Y. Harvesting algal biomass for biofuels using ultrafiltration membranes. Bioresour. Technol. 2010;101:5297–5304. doi: 10.1016/j.biortech.2010.02.007. [DOI] [PubMed] [Google Scholar]
- Zheng Y., Zhang W., Tang B., Ding J., Zheng Y., Zhang Z. Membrane fouling mechanism of biofilm-membrane bioreactor (BF-MBR): pore blocking model and membrane cleaning. Bioresour. Technol. 2018;250:398–405. doi: 10.1016/j.biortech.2017.11.036. [DOI] [PubMed] [Google Scholar]
Associated Data
This section collects any data citations, data availability statements, or supplementary materials included in this article.
Data Availability Statement
Data included in article/supp. material/referenced in article.