

Abstract
Background and Aims
Cholangiocarcinoma (CCA) is a very aggressive cancer showing the presence of high cancer stem cells (CSCs). Doublecortin‐like kinase1 (DCLK1) has been demonstrated as a CSC marker in different gastroenterological solid tumors. Our aim was to evaluate in vitro the expression and the biological function of DCLK1 in intrahepatic CCA (iCCA) and perihilar CCA (pCCA).
Approach and Results
Specimens surgically resected of human CCA were enzymatically digested, submitted to immunosorting for specific CSC markers (LGR5 [leucine‐rich repeat‐containing G protein‐coupled receptor], CD [clusters of differentiation] 90, EpCAM [epithelial cell adhesion molecule], CD133, and CD13), and primary cell cultures were prepared. DCLK1 expression was analyzed in CCA cell cultures by real‐time quantitative PCR, western blot, and immunofluorescence. Functional studies have been performed by evaluating the effects of selective DCLK1 inhibitor (LRRK2‐IN‐1) on cell proliferation (MTS [3‐(4,5‐dimethylthiazol‐2‐yl)‐5‐(3‐carboxymethoxyphenyl)‐2‐(4‐sulfophenyl)‐2H‐tetrazolium] assay, cell population doubling time), apoptosis, and colony formation capacity. DCLK1 was investigated in situ by immunohistochemistry and real‐time quantitative PCR. DCLK1 serum concentration was analyzed by enzyme‐linked immunosorbent assay. We describe DCLK1 in CCA with an increased gene and protein DCLK1 expression in pCCALGR5+ and in iCCACD133+ cells compared with unsorted cells. LRRK2‐IN‐1 showed an anti‐proliferative effect in a dose‐dependent manner. LRRK2‐IN‐1 markedly impaired cell proliferation, induced apoptosis, and decreased colony formation capacity and colony size in both iCCA and pCCA compared with the untreated cells. In situ analysis confirmed that DCLK1 is present only in tumors, and not in healthy tissue. Interestingly, DCLK1 was detected in the human serum samples of patients with iCCA (high), pCCA (high), HCC (low), and cirrhosis (low), but it was almost undetectable in healthy controls.
Conclusions
DCLK1 characterizes a specific CSC subpopulation of iCCACD133+ and pCCALGR5+, and its inhibition exerts anti‐neoplastic effects in primary CCA cell cultures. Human DCLK1 serum might represent a serum biomarker for the early CCA diagnosis.
Abbreviations
- CCA
cholangiocarcinoma
- CD
clusters of differentiation
- CSC
cancer stem cell
- dCCA
distal CCA
- DCLK1
doublecortin‐like kinase 1
- ELISA
enzyme‐linked immunosorbent assay
- EpCAM
epithelial cell adhesion molecule
- HepD
healthy hepatic bile ducts at hilum region
- HCC
hepatocellular carcinoma
- iBEC
intrahepatic biliary epithelial cell
- IBD
interlobular bile duct
- IC50
half maximal inhibitory concentration
- iCCA
intrahepatic CCA
- LGR5
leucine‐rich repeat‐containing G protein‐coupled receptor 5
- MTS
3‐(4,5‐dimethylthiazol‐2‐yl)‐5‐(3‐carboxymethoxyphenyl)‐2‐(4‐sulfophenyl)‐2H‐tetrazolium
- pBEC
perihilar biliary epithelial cell
- pCCA
perihilar CCA
- PD
population doubling
- PSC
primary sclerosing cholangitis
- SQ
semiquantitative
- WB
western blot
Cholangiocarcinoma (CCA) is a heterogeneous group of neoplasms of the bile ducts.( 1 ) CCA is a tumor that has an increasing incidence throughout the world, showing high mortality due to its aggressiveness, late diagnosis, metastasization, and immunoregulation capacity.( 1 , 2 ) The CCA is topographically classified into intrahepatic CCA (iCCA), perihilar CCA (pCCA), and distal CCA (dCCA).( 3 )
It has been demonstrated that there are pathological and molecular differences between iCCA and pCCA/dCCA.( 3 , 4 , 5 , 6 , 7 , 8 )
Our research team has previously shown that CCA is rich of cancer stem cells (CSCs),( 9 ) which are associated with a high rate of recurrence and chemotherapy resistance. Recently, several research groups have focused their attention on CSCs. CSCs exhibit many stem cell–like characteristics, and CSCs recapitulate the origin of tumor heterogeneity after metastasis.( 10 ) CSCs have been subjected to extensive analysis and as therapeutic targets.( 10 )
Doublecortin‐like kinase 1 (DCLK1) is a protein associated with microtubules in cytoplasm, which catalyzes their polymerization.( 11 ) DCLK1 has been found in CSCs of gastrointestinal tract tumors such as colon,( 12 ) pancreas,( 13 ) and hepatocarcinoma.( 11 ) Despite these discoveries, the role of DCLK1 in the tumors and its interaction with other proteins is largely unknown.
Nakanishi et al.( 14 ) exploited the lineage tracking method, showing that DCLK1 can mark tumor stem cells in the intestine. In addition, Westphalen et al.( 15 ) described the relationship between DCLK1+ cells and the beginning of colon cancer. Whorton et al.( 16 ) also showed that DCLK1 regulates pluripotency and angiogenesis in pancreatic cancer through a microRNA‐dependent mechanism.
According to recent papers by Bailey et al.,( 17 ) pancreatic neoplasms expressing DCLK1 contain morphologically and functionally distinct subpopulations such as CSCs. Ito et al.( 18 ) identified DCLK1 as a protein that is predominantly expressed in invasive and metastatic human pancreatic CSCs.
Currently, the presence of DCLK1 in CCA and its possible functional role in this tumor is unknown. In this study we investigated the DCLK1 expression in pCCA and iCCA subpopulations (EpCAM+ [epithelial cell adhesion molecule], LGR5+ [leucine‐rich repeat‐containing G protein‐coupled receptor 5], CD [clusters of differentiation] 90+, CD13+, and CD133+ tumor cell subset).
Materials and Methods
Human CCA Primary Cell Cultures and Tissue Sourcing
Samples of CCA and peritumoral noncancerous liver were obtained from patients presenting a single lesion, which were submitted to curative surgical resection at the “Paride Stefanini” Department of General Surgery and Organ Transplantation, Sapienza University of Rome, Rome, Italy; or at the Surgery, Hepatobiliary Unit, Catholic University of the Sacred Heart School of Medicine, Rome, Italy; or at the Hepatobiliary and Surgery Unit, Regina Elena National Cancer Institute, Rome, Italy. Primary cell cultures were prepared by mechanical and enzymatic dissociation of specimens of human iCCA and pCCA samples. Primary cell cultures were prepared by mechanical and enzymatic dissociation of specimens of human iCCA and pCCA samples.
As described in previous papers,( 9 , 19 ) pCCA and iCCA were selected and cultured in H69 medium and used for experiments over 30 passages from isolation.
Physiologic Human Primary Cell Cultures and Tissue Sourcing
Human biliary tree tissues from the hilum region were used as the physiologic control (HepD) of pCCA tissues, whereas peripheral intrahepatic bile ducts from liver parenchyma were used as the physiologic control (healthy liver parenchyma) of iCCA tissues. EpCAM‐positive biliary epithelial cells isolated from liver parenchyma (iBECs) and EpCAM‐positive biliary epithelial cells isolated from the hilum region, perihilar (pBECs), were used as the physiological controls of iCCA and pCCA, respectively. Perihilar biliary tree tissues and pBECs were obtained from organ donors from the “Paride Stefanini” Department of General Surgery and Organ Transplantation, Sapienza University of Rome, Rome, Italy. Informed consent to use tissues for research purposes was acquired from our transplant program. Peripheral intrahepatic bile ducts and iBECs were isolated from human fetuses (16‐22‐week gestational age), which were obtained by elective pregnancy termination from the Department of Gynecology (Sapienza, University of Rome, Italy). Informed consent was acquired from the mother before abortion. The pBECs and iBEC primary cells were cultured in Kubota’s Medium as described previously by our laboratory.( 20 , 21 , 22 )
Ethical Approval
All described experiments were approved by the Ethics Committee of the Policlinico Umberto I, Sapienza University Hospital, and all the procedures were in accordance with Good Manufacturing Practice. No donor organs were obtained from executed prisoners or other institutionalized individuals.
Immortalized Cell Cultures
The HT29 human cell line is a commercial cell line that is isolated from Caucasian colon adenocarcinoma grade II. It was used as the internal control for each experiment and cultured in H69 medium. The H69 cell line, a cholangiocyte cell line, is a commercial immortal nonmalignant cell line that was isolated from BEC and cultured in H69 medium.
Other materials and methods are described in the Supporting Information.
Results
Expression In Vitro
Subpopulations of CSCs were immune‐sorted from pCCA or iCCA and investigated by real‐time quantitative PCR and western blot (WB) to analyze the presence of DCLK1.
In the pCCA, the DCLK1 expression was evaluated by real‐time quantitative PCR. The highest DCLK1 gene expression was found in the pCCALGR5+ subpopulation (1.15*10−5 ± 3.23*10−6; n = 6; P < 0.01), whose mRNA levels were significantly higher than DCLK1 mRNA levels in unsorted pCCA cells (1.35*10−7 ± 1.76*10−8) (Fig. 1A). Moreover, other subpopulations showed significantly enhanced DCLK1 gene expression such as pCCACD90+ (4.99*10−6 ± 9.08*10−7; n = 6; P < 0.01), pCCAEpCAM+ (4.87*10−7 ± 7.09*10−8; n = 6; P < 0.001), and pCCACD13+ (3.98*10−6 ± 9.23*10−7; n = 6; P < 0.01) with respect to unsorted pCCA cells (Fig. 1A). Instead, the pCCACD133+ subpopulation did not show significantly different DCLK1 mRNA levels as compared with unsorted pCCA (n = 6). Similar results were observed in the protein analysis by WB. In all populations, a 82‐kDa band was observed, corresponding to the most studied isoform from previous studies.( 23 ) Figure 1A shows the expression of DCLK1 protein in the pCCA subpopulation compared with unsorted pCCA cells. The pCCALGR5+ (1.41 ± 0.2; n = 6; P < 0.01), pCCACD90+ (0.68 ± 0.07; n = 6; P < 0.05), pCCA133+ (0.74 ± 0.07; n = 6; P < 0.01), pCCAEpCAM+ (1.15 ± 0.19; n = 6; P < 0.01;), and pCCACD13+ (1.3 ± 0.03; n = 6; P < 0.01) expressed higher protein levels compared with the unsorted control (0.45 ± 0.14; n = 6). In pCCA, the higher genetic and protein expression of DCLK1 results in a LGR5+ subpopulation.
FIG. 1.
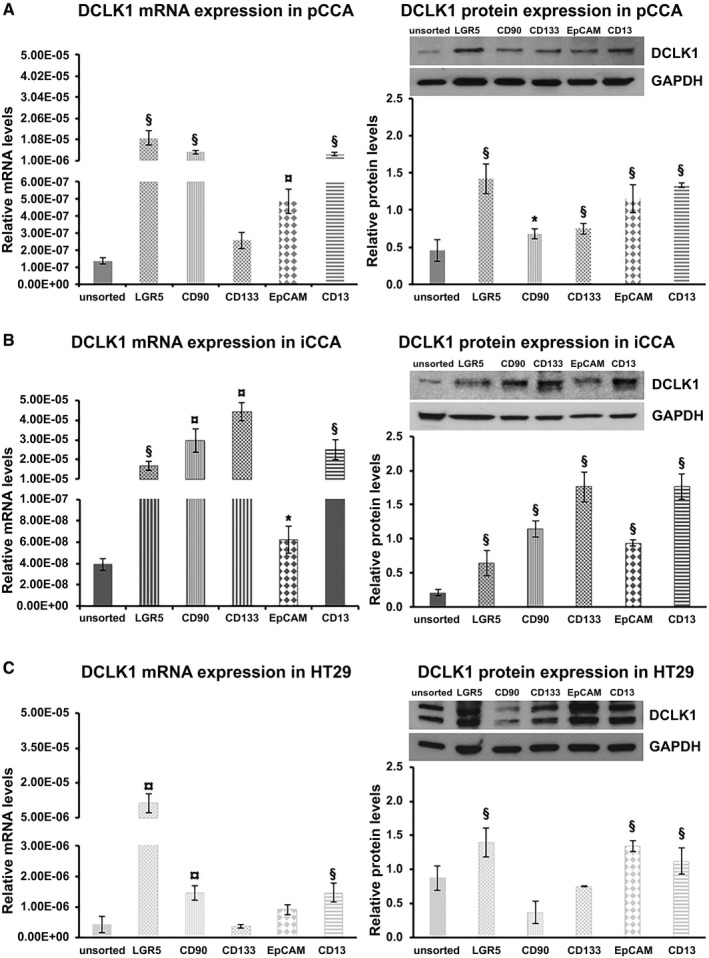
DCLK1 expression in the subpopulation of pCCA‐CSC and iCCA‐CSC primary cell culture. Relative DCLK1 mRNA level expression analysis by real‐time quantitative PCR (left) and DCLK1 relative protein‐expression analysis by WB (right) of pCCA (A), iCCA (B), and HT29 (C) whole and subpopulation. Data expressed as mean ± SD of n = 6 experiments (*P < 0.05 versus unsorted cells; § P < 0.01 versus unsorted cells; ¤ P < 0.001 versus unsorted cells). Abbreviation: GAPDH, glyceraldehyde 3‐phosphate dehydrogenase.
Notably, pBECs used as physiologic control of pCCA did not express DCLK1 by real‐time quantitative PCR and WB analysis (data not shown).
In the iCCA, the DCLK1 expression in all sorted subpopulations (LGR5+ [1.69*10−5 ± 2.22*10−6; n = 6; P < 0.01], CD90+ [2.95*10−5 ± 6.03*10−6; n = 6; P < 0.001], CD133+ [4.44*10−5 ± 4.61*10−6; n = 6; P < 0.001], EpCAM+ [6.24*10−8 ± 1.25*10−8; n = 6; P < 0.05], or CD13+ [2.51*10−5 ± 5.06*10−6; n = 6; P < 0.01]) was significantly higher than unsorted iCCA cells (3.93*10−08 ± 5.46*10−09; n = 6) (Fig. 1B). In accordance with genic expression, DCLK1 protein expression was significantly higher in the sorted iCCA subpopulations like LGR5+ (0.64 ± 0.18; n = 6; P < 0.01), CD90+ (1.14 ± 0.13; n = 6; P < 0.01), CD133+ (1.77 ± 0.22; n = 6; P < 0.01), EpCAM+ (0.93 ± 0.05; n = 6; P < 0.01), and CD13+ (1.74 ± 0.19; n = 6; P < 0.01) compared with the unsorted iCCA (0.2 ± 0.05; n = 6) (Fig. 1B). In iCCA, the higher genetic and protein expression of DCLK1 results in CD133+ and CD13+ subpopulations. Interestingly, iBECs used as the physiologic control of iCCA did not express DCLK1 by real‐time quantitative PCR and WB analysis (data not shown).
In HT29 cells, used as positive control, the genetic expression of DCLK1 was increased in LGR5+ (1.14*10−5 ± 4.03*10−6; n = 6; P < 0.001), CD90+ (1.45*10−6 ± 2.29*10−7; n = 6; P < 0.01), and CD13+ cells (1.45*10−6 ± 3.09*10−7; n = 6; P < 0.01) compared with the unsorted HT29 cells (4.02*10−7 ± 2.74*10−7; n = 6) (Fig. 1C). Moreover, the CD133+ (3.49*10−7 ± 6.41*10−8; n = 6; P > 0.05) and EpCAM+ (9.13*10−7 ± 1.66*10−7; n = 6; P > 0.05) subpopulations did not show a significative difference with respect to unsorted HT29 cells (Fig. 1C).
The DCLK1 protein expression was higher in the HT29LGR5+ (1.39 ± 0.21; n = 6; P < 0.01), HT29EpCAM+ (1.33 ± 0.15; n = 6; P < 0.01), and HT2913+ (1.11 ± 0.19; n = 6; P < 0.05) subpopulations compared with the unsorted HT29 population (0.87 ± 0.17; n = 6) (Fig. 1C). Instead, the HT2990+ and HT29133+ tumor cell subset did not show a significant difference with respect to the unsorted HT29 cells.
Localization of DCLK1 in Primary CCA Cell Cultures
Next, we investigated the localization of DCLK1 protein in the unsorted population and in pCCALGR5+, iCCACD133+, or HT29LGR5+ sorted tumor cells, which have shown the highest DCLK1 mRNA and protein expression.
DCLK1 was localized in the pCCA and iCCA primary cell line by immunofluorescence (Fig. 2). DCLK1 was observed in cytoplasmatic localization in all unsorted and sorted analyzed populations (Fig. 2), as previously shown in other tumors.( 12 , 24 ) DCLK1 was not detected in iBECs and in pBECs (Fig. 2), confirming the gene expression and WB results that we previously presented.
FIG. 2.
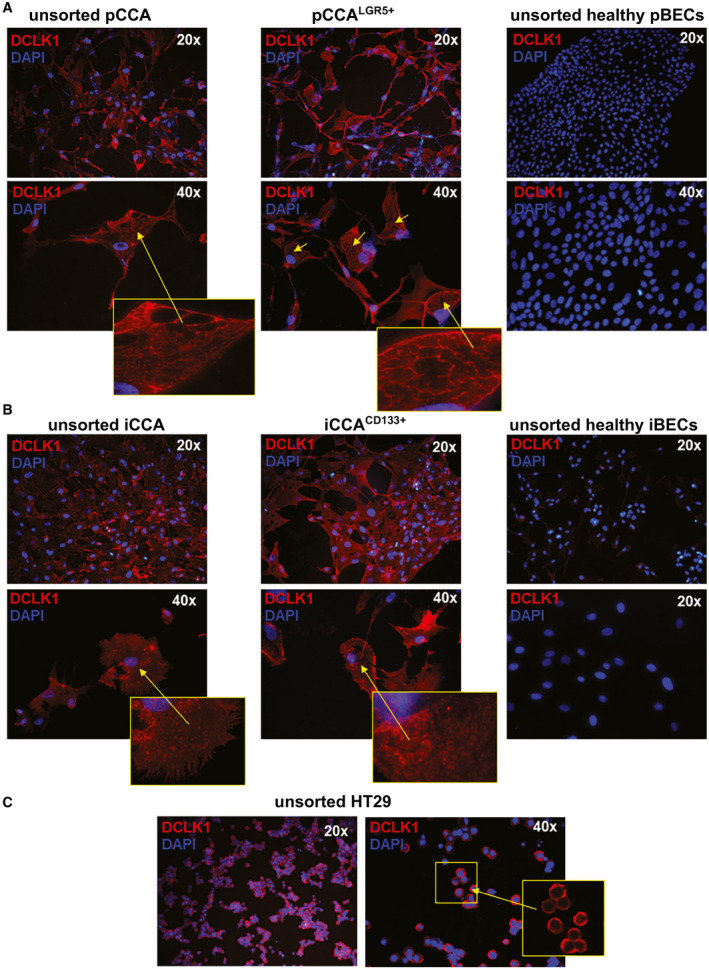
DCLK1 localization in subpopulation of pCCA‐CSC and iCCA‐CSC primary cell culture. (A) Cytoplasmic localization of DCLK1 (red) in LGR5+ sorted and unsorted pCCA; nuclei are stained with DAPI (blue). No difference between pCCALGR5+ and unsorted pCCA cells were observed. No DCLK1+ observed in unsorted healthy perihilar biliary duct (pBD) cells. (B) Cytoplasmic localization of DCLK1 (red) in iCCACD133+ and in unsorted iCCA; nuclei are stained with DAPI (blue). No difference between iCCACD133+ and unsorted iCCA cells were observed. DCLK1+ cells were not observed in unsorted healthy IBD cells. (C) Cytoplasmic localization of DCLK1 (red) in unsorted HT29 (positive control); nuclei are stained with DAPI (blue). Abbreviation: DAPI, 4´,6‐diamidino‐2‐phenylindole.
HT29 unsorted cells showed a localization of cytoplasmic DCLK1 as already described in the literature.( 12 )
Effects of DCLK1 Inhibition on Viability of Primary Human Cell Cultures
Based on previous data, we performed experiments to investigate the effects of DCLK1 inhibition on primary human unsorted and sorted cell cultures.
By MTS (3‐[4,5‐dimethylthiazol‐2‐yl]‐5‐[3‐carboxymethoxyphenyl]‐2‐[4‐sulfophenyl]‐2H‐tetrazolium) assay, we evaluated the half maximal inhibitory concentration (IC50) and viability of primary cell cultures after treatment with DCLK1 inhibitor (LRRK2‐IN‐1) for 72 hours.
The cell viability decreased in a dose‐dependent manner in all populations treated with LRRK2‐IN‐1 compared with the untreated cells. Viability reduction was observed in pCCALGR5+ cells’ (IC50 = 4.51 μM; n = 4; P < 0.01) inhibitory concentrations compared with unsorted pCCA cells (IC50 = 9.61 μM; n = 4) (Fig. 3A), as well as the CD133+ population (IC50 = 9.36 μM; n = 4; P < 0.01) versus the whole unsorted iCCA population (IC50 = 14.72 μM; n = 4) (Fig. 3B).
FIG. 3.
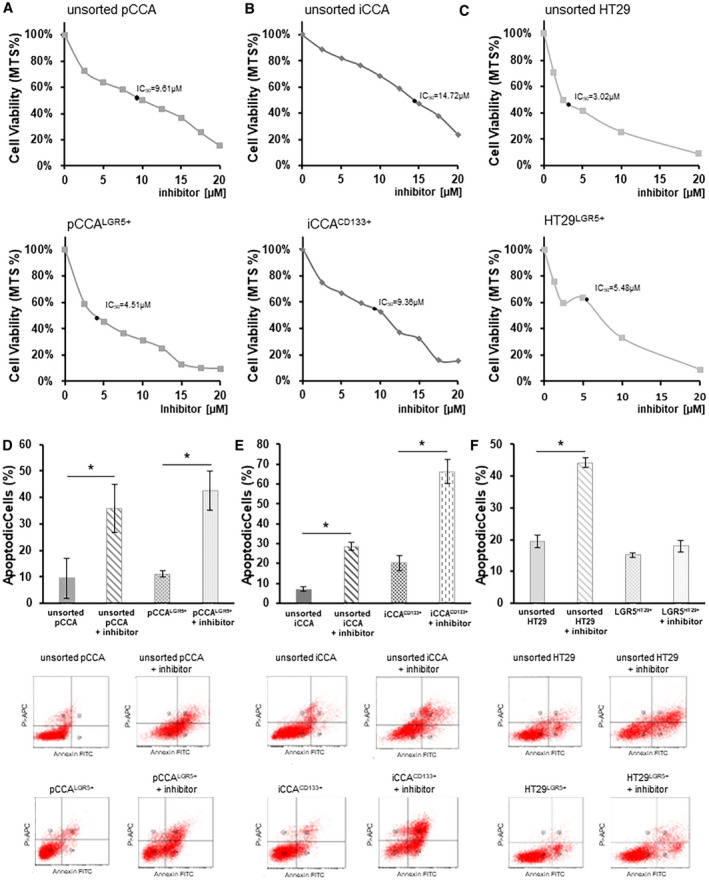
DCLK1 inhibition decreases cell viability and enhances apoptosis of the subpopulation of pCCA‐CSC and iCCA‐CSC primary cell culture. Viability and apoptosis analysis by MTS assay and flow cytofluorimetric assay, respectively, after treatment with LRRK2‐IN‐1, a specific DCLK1 inhibitor. (A) Curve dose‐response of pCCA (up) and pCCALGR5+(down) cells with 0, 2.5, 5, 7.5, 10, 12.5, 15, 17.5, and 20 µM of LRRK2‐IN‐1 concentrations. Data are expressed as mean ± SD of n = 6 experiments. The IC50 is indicated by a bold black dot. (B) Curve dose response of iCCA (up) and iCCACD133+(down) cells with 0, 2.5, 5, 7.5, 10, 12.5, 15, 17.5, and 20 µM LRRK2‐IN‐1 concentrations. Data are expressed as mean ± SD of n = 6 experiments. The IC50 is indicated as a bold black dot. (C) Curve dose response of HT29 (up) and HT29 LGR5+(down) cells with 0, 2.5, 5, 7.5, 10, 12.5, 15, 17.5, and 20 µM LRRK2‐IN‐1 concentrations. Data are expressed as mean ± SD of n = 6 experiments. The IC50 is indicated by a bold black dot. (D) Percentage of apoptotic unsorted pCCA and pCCALGR5+ after treatment with LRRK2‐IN‐1 at the concentration of own IC50 or without treatment (controls). The dot plots below display the representative experiments. Data are expressed as mean ± SD of n = 6 experiments; *P < 0.05. (E) Percentage of apoptotic unsorted iCCA and iCCACD133+ after treatment with LRRK2‐IN‐1 at the concentration of own IC50 or without treatment (controls). The dot plots below display the representative experiments. Data are expressed as mean ± SD of n = 6 experiments; *P < 0.05. (F) Percentage of apoptotic unsorted HT29 and HT29LGR5+ after treatment with LRRK2‐IN‐1 at the concentration of own IC50 or without treatment (controls). The dot plots below display the representative experiments. Data are expressed as mean ± SD of n = 6 experiments; *P < 0.05.
The HT29LGR5+ subpopulation showed a higher IC50 (5.48 μM; n = 4) with respect to unsorted HT29 (3.02 μM; n = 4) (Fig. 3C). Furthermore, the viability of iBECs and pBECs was not influenced by LRRK2‐IN‐1 treatment (Supporting Fig. S1).
Supernatant from CCA cultures was collected and used to culture the H69 nonmalignant cholangiocyte cell line. MTS assay showed that all conditioned mediums increased the H69 proliferation compared with control. H69 grown in conditioned medium from CCA cell culture with LRRK2‐IN‐1 for 72 hours at the found concentrations of IC50 for each CCA subpopulation showed reduced cell proliferation compared to H69 cultured with CCA conditioned medium without LRRK2‐IN‐1 (Supporting Fig. S8).
Effects of DCLK1 Inhibition on CCA Cell Apoptosis
To investigate whether DCLK‐1 inhibition by LRRK2‐IN‐1 can induce an effect on cell apoptosis, Annexin V fluorescein isothiocyanate/propidium‐iodide double‐labeling flow cytometry was carried out.
We treated the pCCA and iCCA cells with LRRK2‐IN‐1 for 72 hours at the found concentrations of IC50 for each subpopulation. We observed a significant increase of apoptotic process in unsorted (treated minus untreated unsorted pCCA cells: 26.30% ± 7.48%; n = 6; P < 0.05) or in pCCALGR5+ cells (treated minus untreated pCCALGR5+ cells: 31.34% ± 4.37%; n = 6; P < 0.01) treated with LRRK2‐IN‐1 compared with the respective untreated control cells (Fig. 3D).
Moreover, LRRK2‐IN‐1 increased apoptosis in unsorted iCCA when compared with untreated and unsorted iCCA (treated minus untreated unsorted iCCA cells: 21.47% ± 1.57%; n = 6; P < 0.01) (Fig. 3E). The extent of apoptosis was massive in the iCCA133+ subpopulation treated with LRRK2‐IN‐1 with respect to untreated iCCA133+ cells (treated minus untreated iCCA133+ cells: 46.1% ± 5.44%; n = 6; P < 0.01) (Fig. 3E). The apoptotic effect of LRRK2‐IN‐1 was confirmed in HT29 unsorted cells treated with LRRK2‐IN‐1 when compared with untreated cells (treated minus untreated HT29 unsorted cells: 24.87% ± 1.78%; n = 6; P < 0.01) (Fig. 3F). No statistically significant increase was observed in apoptosis between HT29LGR5+ cells and HT29LGR5+ LRRK2‐IN‐1 treated cells.
Effects of DCLK1 Inhibition on CCA Cell Proliferation
To analyze the population doubling (PD) index, we treated the pCCA and iCCA cells with LRRK2‐IN‐1 for 72 hours at the concentrations of IC50 for each subpopulation.
The PD index of the unsorted pCCA cells treated with LRRK2‐IN‐1 was significantly reduced (1.99 ± 0.32; n = 6; P < 0.01) compared with untreated pCCA cells (3.74 ± 0.07; n = 6) (Fig. 4A). Similarly, pCCALGR5+ cells treated with LRRK2‐IN‐1 underwent a reduction of proliferation rate (0.99 ± 0.54; n = 6; P < 0.01) when compared with pCCALGR5+ untreated cells, which showed a stable growth over time (4.15 ± 0.08; n = 6) (Fig. 4A).
FIG. 4.
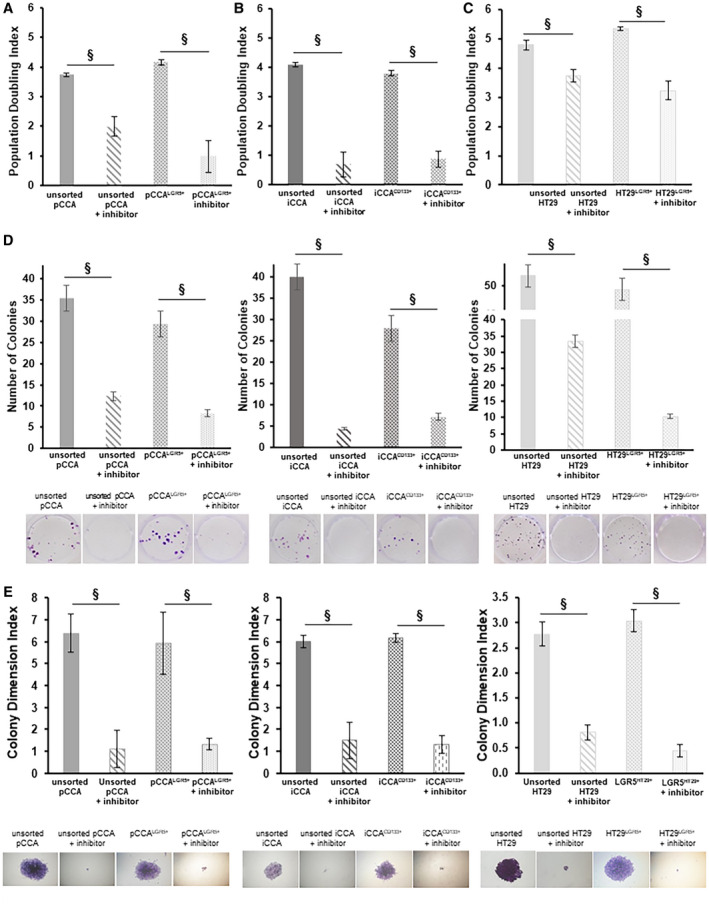
DCLK1 inhibition exerts an effect on proliferation and colony formation capacity of subpopulation of pCCA and iCCA‐CSC primary cell culture. Proliferation rate of unsorted pCCA and pCCALGR5+ (A), unsorted iCCA and iCCACD133+ (B), and unsorted HT29 and HT29LGR5+ (C) were analyzed after 3 days of treatment with LRRK2‐IN‐1 at the concentration of own IC50 or without treatment (control) by PD. The primary cell culture treated with LRRK2‐IN‐1 showed a significant decrease of the PD compared with untreated cells. The results are expressed as mean ± SD of n = 6 experiments (§ P < 0.01 versus untreated control). (D) Number of colonies of unsorted pCCA, pCCALGR5+, unsorted iCCA, iCCACD133+, and unsorted HT29 and HT29LGR5+ after 10 days of treatment with LRRK2‐IN‐1 at the concentration of own IC50 or without treatment (controls). The primary cell culture treated with LRRK2‐IN‐1 showed a significant decrease in the number of colonies compared with untreated cells. Data are expressed as mean ± SD of n = 6 experiments (§ P < 0.01). (E) Colony size expressed as colony dimension index of unsorted pCCA, pCCALGR5+, unsorted iCCA, iCCACD133+, and unsorted HT29 and HT29LGR5+ after 10 days of treatment with LRRK2‐IN‐1 at the concentration of own IC50 or without treatment (controls). The primary cell culture treated with LRRK2‐IN‐1 shows a significant decrease in the colony dimension index compared with untreated cells (§ P < 0.01 versus untreated control). Data are expressed as mean ± SD of n = 6 experiments (§ P < 0.01).
Unsorted iCCA treated with LRRK2‐IN‐1 cells showed an important population index decrease (0.67 ± 0.43; n = 6; P < 0.01) compared with untreated cells, which exhibited a stable growth over time (4.09 ± 0.07; n = 6) (Fig. 4A). Moreover, the PD index in iCCACD133+ cells treated with LRRK2‐IN‐1 (0.86 ± 0.28; n = 6; P < 0.01) was significantly reduced compared with untreated iCCACD133+ cells (3.80 ± 0.10; n = 6) (Fig. 4B).
In HT29 cells treated with inhibitor, the PD rate was reduced (HT29 unsorted: 3.74 ± 0.20; and HT29LGR5+: 3.22 ± 0.32; n = 6; P < 0.01) compared with untreated cells (unsorted: 4.78 ± 0.15; and HT29LGR5+: 5.34 ± 0.07; n = 6) (Fig. 4C).
Effects of DCLK1 Inhibition on CCA Colony Formation
Colony formation capacity was analyzed by measuring the colony number after 10 days of treatment with LRRK2‐IN‐1 or without (controls) at the concentrations of IC50 for each subpopulation.
pCCA, iCCA primary cell cultures, and HT29 cell lines treated with LRRK2‐IN‐1 showed a significant reduction of colony formation capacity compared with controls cells (P < 0.05) (Fig. 4D). Moreover, we observed a trend toward a decrease in the size of colonies, measured by a colony dimension index in pCCA, iCCA, and HT29 cultures, treated with LRRK2‐IN‐1 compared with untreated controls, respectively (P < 0.05) (Fig. 4E).
In Situ Expression of DCLK1
To assess DCLK1 expression, we performed immunohistochemistry on normal and CCA samples. Interestingly, both intrahepatic (i.e., interlobular bile ducts [IBDs]) and extrahepatic bile ducts (hepatic ducts at the hilum) were mostly negative (less than 5% of epithelial cells) for DCLK1 in healthy organs (Supporting Fig. S2). In the hepatic duct, peribiliary glands were also present and were mostly DCLK1‐negative. In CCA samples, DCLK1 was expressed by tumor glands both in pCCA (semiquantitative [SQ] score: 2.50 ± 0.55; P < 0.05 vs. normal ducts) and iCCA (SQ score: 2.33 ± 0.82; P < 0.05 vs. normal ducts), with no significant differences between the two tumor subtypes (Fig. 5A,B).
FIG. 5.
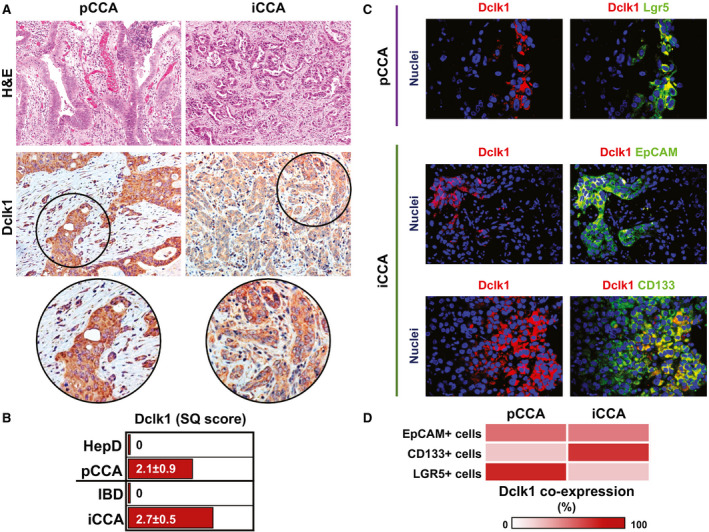
In situ expression of DCLK1 and CSC markers in CCA samples. (A) Hematoxylin and eosin (H&E) staining (upper panels) and immunohistochemistry for DCLK1 (lower panels) in pCCA and iCCA. H&E staining shows histological heterogeneity between the two tumor subtypes. Immunohistochemistry for DCLK1 shows that both tumor subtypes express DCLK1. Original magnification: ×20. Areas in the circles are magnified below. (B) The graph reports the mean and SD of the SQ score for DCLK1 expression in pCCA and iCCA compared with the expression in cholangiocytes lining the HepD and IBDs, respectively (P < 0.05 vs. normal samples). See also Supporting Fig. S2. (C) Double immunofluorescence for Lgr5/DCLK1 (upper panels) in pCCA, and for EpCAM/DCLK1 (middle panels) and CD133/DCLK1 (lower panels) in iCCA. Immunofluorescence staining shows how DCLK1+ cells (in red) represent a subpopulation of CCA cells expressing CSC markers (i.e., Lgr5, EpCAM, and CD133, in green). Separate channels are also provided. Nuclei are displayed in blue. Original magnification: ×20. (D) Heat map showing the percentage of CSC+ cells co‐expressing DCLK1 in pCCA and iCCA.
We then used double immunofluorescence to evaluate whether CSC subpopulations co‐expressed DCLK1 in the same cell (Fig. 5C,D). In pCCA, DCLK1 was expressed by 54.8% ± 12.7% of EpCAM+ cells, by 25% ± 6.7% of CD133+ cells, and by 80.2% ± 5.7% of Lgr5+ cells. In iCCA, DCLK1 was expressed by 50.4% ± 4.7% of EpCAM+ cells, by 74.8% ± 4.9% of CD133+ cells, and by 25.6% ± 6.3% of Lgr5+ cells.
These interesting results were confirmed by DCLK1 gene‐expression analysis from total tissue extracts by real‐time quantitative PCR (Fig. 6A). The graph shown in Fig. 6B shows a higher DCKL1 gene expression in pCCA (9.23*10−3 ± 9.04*10−5; n = 6; P < 0.001) or in iCCA (1.25*10−2 ± 2.56*10−3; n = 6; P < 0.01) when compared with healthy hepatic bile ducts at hilum region (HepD) (2.26*10−8 ± 9.65*10−9; n = 6) and healthy liver parenchyma (7.39*10−5 ± 1.68*10−5; n = 6), respectively (Fig. 6B).
FIG. 6.
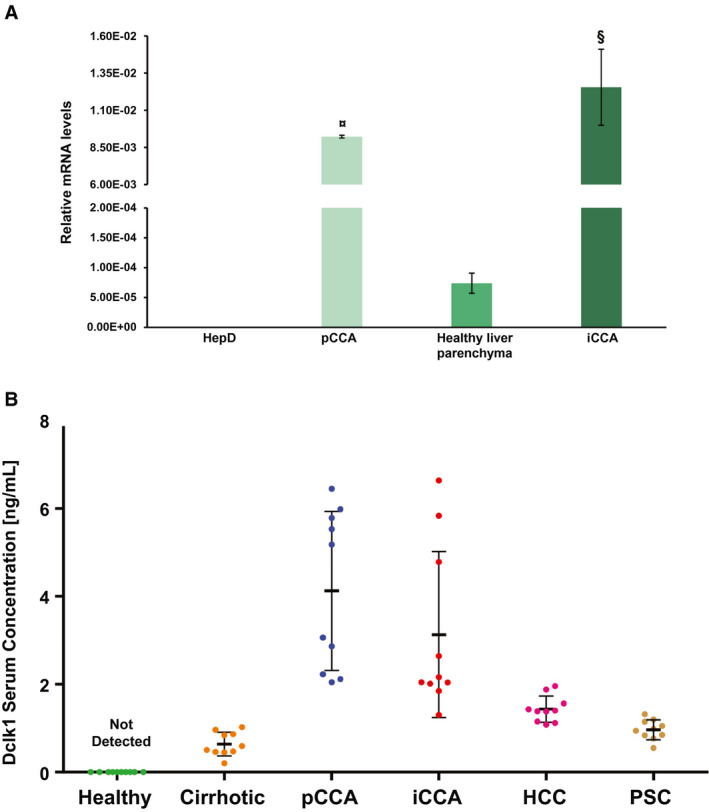
Putative role of DCLK1 as a diagnostic biomarker. (A) DCLK1‐relative mRNA levels in total extracts of human tumors are statistically higher compared with healthy human tissue from perihilar biliary ducts (healthy pBDs) and small biliary ducts (healthy sBDs), which were the healthy controls of pCCA and iCCA, respectively. Data are expressed as mean ± SD of n = 6 experiments (¤ P < 0.001 versus healthy pBDs; § P < 0.01 versus healthy sBDs). (B) DCLK1 serum concentrations in patients with pCCA, iCCA, HCC, and PSC were analyzed by ELISA. DCLK1 was not detected in healthy controls, and its average concentration increased in the serum of patients with CCA (P < 0.01 vs. healthy samples). Data are expressed as mean ± SD of n = 5 experiments.
DCLK1 as Putative Diagnostic Serum Biomarker
Furthermore, we evaluated the DCLK1 concentration in human serum samples of patients with pCCA or iCCA, in patients with HCC, cirrhosis, and primary sclerosing cholangitis (PSC), and in healthy subjects (Supporting Table S1). Higher DCLK1 levels were detected both in pCCA (4.35 ± 1.76 ng/mL; n = 10; P < 0.01 vs. patients with cirrhosis, HCC, and PSC) and iCCA patients (3.21 ± 1.98 ng/mL; n = 10; P < 0.01 vs. patients with cirrhosis and PSC; P < 0.05 vs. patients with HCC) when compared with patients with cirrhosis (0.90 ± 0.39 ng/mL; n = 10), HCC (1.20 ± 0.39 ng/mL; n = 10), and PSC (0.96 ± 0.23 ng/mL; n = 10). The analysis of the variance confirmed that DCLK1 concentration in human serum of patients affected by iCCA and/or pCCA was sensibly higher compared with all other groups (iCCA or pCCA vs. others, P < 0.05; CCA vs. others, P < 0.01). In the healthy group, DCLK1 in the serum is undetectable (Fig. 6B).
Correlation Between DCLK1 and Inflammation in CCA
To assess possible correlation between DCLK1 and tissue inflammation, we counted the number of CD68+ macrophages within CCA samples and evaluated IL‐6 expression in DCLK1+ cells (Supporting Fig. S3A). However, we did not find any significant correlation between macrophage number and DCLK1 expression, nor did we observe a significant overlap (co‐expression) between IL‐6+ and DCLK1+ CCA populations (Supporting Fig. S3B). Furthermore, we analyzed several tumors (CA19‐9) and inflammation (IL‐6 and tumor necrosis factor α) biomarkers using enzyme‐linked immunosorbent assay (ELISA) and observed a marked increase in all serum biomarkers analyzed, similar to DCLK1 in serum samples (Supporting Fig. S4).
Discussion
We have demonstrated the DCLK1 overexpression in the CSC‐CCA populations, particularly in pCCALGR5+ and iCCACD133+, and the DCLK1 functional role in tumor proliferation and viability.
The results reveal that (1) the expression of genetic and proteic DCLK1 changed based on expression of different pluripotent/multipotent markers analyzed in different pCCA or iCCA cell subpopulations (LGR5, CD90, CD133, EpCAM, and CD13); (2) the highest DCLK1 genic and proteic expression was observed in the pCCALGR5+ and iCCACD133+ subpopulations by real‐time quantitative PCR and WB, respectively, and this expression was significantly high when compared with the whole tumor cell population; (3) DCLK1 is located in the cytoplasm of CSC‐CCA, without any relevant differences between sorted and whole populations, whereas in healthy tissues, pBECs and iBECs were not detectable; (4) the specific inhibition of DCLK1 by LRRK2‐IN‐1 in CCA cells demonstrated that the anti‐proliferative effect of LRRK2‐IN‐1 was dose‐dependent, inducing directly proportional dose response through MTS assay, and this inhibition was more relevant in pCCA than iCCA cells; (5) DCLK1 inhibition by LRRK2‐IN‐1 markedly impaired the cell proliferation and increased the PD time, induced apoptosis, and decreased colony formation capacity and colony size in both pCCA and iCCA treated with LRRK2‐IN‐1 when compared with untreated CCA cells; (6) tumoral cells within iCCA and pCCA tissue samples expressed DCLK1 using immunohistochemical analysis; and (7) using ELISA, DCLK1 was only found in the serum of CCA, patients with cirrhosis, HCC, and, importantly, was never detected in healthy control serum samples.
Currently, there are no techniques for early diagnosis of CCA; moreover, no specific CCA‐CSC markers are known.( 1 ) Furthermore, many research groups are studying several strategies to block CSC activity, the cells responsible for tumor growth, recidivism, and chemoresistance.( 1 , 9 , 25 ) Currently, the drug therapy using radio‐chemotherapy is intended primarily for palliative purposes, because it does not target CSCs.( 19 , 26 ) In fact, surgical resection is the only effective therapy, but it has low applicability given the numerous late diagnoses.( 1 ) Many research groups are trying to identify specific CSC markers to formulate a targeted therapy that would be able to block the CSCs.( 9 , 24 , 25 ) A new protein that can be expressed at low levels in gastrointestinal non‐CSCs and increased in gastrointestinal CSCs is DCLK1.( 24 , 27 ) In the previous studies on colorectal and pancreatic cancers, DCLK1 has been identified as a co‐marker in CSCs, and its inhibition leads to tumor regression or disappearance.( 28 ) In this work, we demonstrate how the two subtypes of CCA, the iCCA and pCCA, present different levels of DCLK1 expression in cells sorted for stem (LGR5, CD90, EpCAM, and CD13) and progenitor markers (CD133). These data confirm that both gene and protein expression of DCLK1 alter between iCCA and pCCA because of different cells of origin, which are present in distinct stem cell niches located along the adult human biliary tree, as indicated in other metaplastic tumors and pathological conditions.( 11 , 16 , 18 , 24 )
The expression and the localization of DCLK1 has never been described in the CCA. DCLK1 in the CCA showed a cytoplasmic localization, as already described in colorectal cancer and pancreatic cancer, in which DCLK1 was found to be associated with microtubules.( 18 , 29 , 30 , 31 ) However, no difference in cytoplasmic localization was found between the analyzed subpopulations and the total population.
In many studies, it was observed that inhibition of DCLK1 by a specific inhibitor (LRRK2‐IN‐1)( 28 ) or by small interfering RNA( 24 , 32 , 33 ) leads to a reduction of colorectal and pancreatic tumor mass in vivo, and carcinogenesis and viability in vitro. Our data demonstrate that in the subpopulations with the higher DCLK1 expression, in both gene and protein levels, DCLK1 inhibition leads to a significant decrease of cell viability and proliferation compared with whole populations. In fact, we observed high inhibitor efficiency in specific CSC‐CCA subpopulations when compared with whole CCA cells. Furthermore, the sensitivity to treatment in pCCALGR5+ cells was increased. In previous studies, the DCLK1 pathway was hypothesized to be in HCC( 11 ) with a direct effect on c‐myc and an indirect effect on nuclear factor kappa B (NF‐kB) through the S100A9 factor, enhancing the tumor proliferation and cell mobility. We hypothesized that the same pathway is also active in CCA. This hypothesis is strengthened by the dose‐response data obtained by MTS, in which the high concentration of inhibitor had more of an effect on cell viability, until the vitality was reduced to below about 80%. In addition, the inhibition of DCLK1 led to an increase of apoptosis in the CSC‐CCA subpopulations. This indicates an involvement of DCLK1 protein in the resistance to apoptosis in the CSC‐CCA; confirming this evidence, it was recently shown that DCLK1 increases chemoresistance of colorectal cancer cells through the anti‐apoptosis pathway.( 34 ) DCLK1 inhibition induced a marked decrease in cell proliferation and a reduced expression of NF‐kB, a gene under Notch control (Supporting Fig. S7). Interestingly, Chandrakesan et al. demonstrated that NOTCH expression decreased after DCLK1 knockdown in colon cancer cells.( 12 ) Therapeutic effects of DCLK1 inhibition by LRRK2‐IN‐1 in animal models should be the subject of future research.
Our data showed a strong reduction in epithelial‐mesenchymal transition gene expression and an impairment of cell migration after DCLK1 inhibition (Supporting Figs. S5 and S6). Consistent with these results, several research teams have demonstrated an important role of DCLK1 in the progression of different gastroenterological tumors.( 35 , 36 , 37 , 38 )
Additionally, we assessed the correlation between DCLK1 and inflammation markers in tissue and serum. However, at this time we do not have enough data to support a functional role of DCLK1 in tumor inflammation; therefore, further investigations are needed to better address this topic.
Finally, a potentially relevant result is that DCLK1 could be detected in the human serum samples of patients with CCA, but, surprisingly, it was almost undetectable in healthy controls. Interestingly, in liver cirrhosis, a recognized iCCA risk factor, and in PSC, a recognized pCCA risk factor, we found very low DCLK1 serum levels. These results confirm the findings observed in other tumor studies, in which the precancer condition showed lower DCLK1 levels than the tumor. In fact, Whorton et al.( 16 ) and Sureban et al.( 39 ) demonstrated in their studies that in the malignant condition the concentration of DCLK1 in the patient serum (in esophageal adenocarcinoma and HCC, respectively) was higher than precancer conditions (Barrett’s esophagus and liver cirrhosis, respectively). Many research teams have associated DCLK1, analyzed in different tumors, with metastasis, tumor invasion, and prognosis.( 18 , 38 , 40 , 41 ) Moreover, Nakanishi et al.( 14 ) demonstrated that the ablation of DCLK1 in tumor stem cells resulted in regression of intestinal polyps within mouse models. DCLK1 has been proposed as a marker of quiescent stem cells in both the pancreas and gastrointestinal tract.( 42 ) DCLK1 has displayed a high methylation frequency in CCA tissues.( 43 ) Intraepithelial neoplasms have been reported in the biliary tract as biliary intraepithelial neoplasms (BilINs), microscopic lesions unable to be identified macroscopically.( 44 ) DCLK1 marked a morphologically distinct and functionally unique population of pancreatic cancer–initiating cells in mouse models of pancreatic intraepithelial neoplasia, the pancreatic counterpart of BilIN.( 17 ) Finally, DCLK1 has been investigated in PSC through DNA methylation analysis of biliary brush samples as compared with CCA.( 45 ) Our results regarding DCLK1 expression in CCA serum samples and its low levels in at‐risk conditions (e.g., liver cirrhosis, PSC) should be confirmed in larger investigations assessing the clinical use of DCLK1 as a serum biomarker in CCA.
In conclusion, DCLK1 expression characterizes specific CSC subpopulations of iCCACD133+ and pCCALGR5+, and DCLK1 inhibition exerts antineoplastic properties in primary CSC‐CCA cell cultures. Moreover, DCLK1 was detected in the serum of patients with CCA, while it was not observed in the serum of healthy individuals. Finally, it will be important to study the DCLK1 signaling pathway, because blocking its function could be an effective therapeutic target in the future, against CCA‐CSCs.
Author Contributions
L.N. and S.D.M. were responsible for the study concept and design, the generation, collection, assembly, analysis, and interpretation of the data, the manuscript draft and revision, and approval of the final manuscript. G.C., I.Z., and P.M.G. were responsible for the data analysis and interpretation, and the drafting, revision, and approval of the final manuscript. V.C., V.A., D.C., O.V., and S.S. were responsible for the data collection, generation and analysis, and approval the final manuscript. F.M. and P.B.B. were responsible for the collection of biliary trees from organ donors. A.G., M.M., D.B., and P.B.P. were responsible for the collection of fetal biliary trees from therapeutic abort. V.D.P., A.O., A.M.D., G.G., and F.G. were responsible for the collection of CCA surgical resection. S.M. and P.I. were responsible for the collection of PSC serum samples. G.C., E.G., and D.A. were responsible for the study concept and design, the drafting and revision of the manuscript, and approval of the final manuscript.
Supporting information
Supplementary Material
Acknowledgments
Pietro Invernizzi and Sara Massironi are members of the European Reference Network on Hepatological Diseases (ERN RARE LIVER), and they thank AMAF Monza ONLUS and AIRCS for the unrestricted research funding.
Supported by Sapienza University of Rome (000324_17_H2_ALVARO_H2020 ‐ ALVARO ‐ PROGETTI H2020 2017) and by Consorzio Interuniversitario Trapianti d’Organo, Rome, Italy.
Potential conflict of interest: Dr. Invernizzi consults and received grants from Intercept. He received grants from Gilead and Bruschettini.
See Editorial on Page 4
References
Author names in bold designate shared co‐first authorship.
- 1. Banales JM, Cardinale V, Carpino G, Marzioni M, Andersen JB, Invernizzi P, et al. Expert consensus document: cholangiocarcinoma: current knowledge and future perspectives consensus statement from the European Network for the Study of Cholangiocarcinoma (ENS‐CCA). Nat Rev Gastroenterol Hepatol 2016;13:261‐280. [DOI] [PubMed] [Google Scholar]
- 2. Carnevale G, Carpino G, Cardinale V, Pisciotta A, Riccio M, Bertoni L, et al. Activation of Fas/FasL pathway and the role of c‐FLIP in primary culture of human cholangiocarcinoma cells. Sci Rep 2017;7:14419. [DOI] [PMC free article] [PubMed] [Google Scholar]
- 3. Komuta M, Govaere O, Vandecaveye V, Akiba J, Van Steenbergen W, Verslype C, et al. Histological diversity in cholangiocellular carcinoma reflects the different cholangiocyte phenotypes. Hepatology 2012;55:1876‐1888. [DOI] [PubMed] [Google Scholar]
- 4. Patel T. Cholangiocarcinoma—controversies and challenges. Nat Rev Gastroenterol Hepatol 2011;8:189‐200. [DOI] [PMC free article] [PubMed] [Google Scholar]
- 5. Bragazzi MC, Ridola L, Safarikia S, Matteo SD, Costantini D, Nevi L, et al. New insights into cholangiocarcinoma: multiple stems and related cell lineages of origin. Ann Gastroenterol 2018;31:42‐55. [DOI] [PMC free article] [PubMed] [Google Scholar]
- 6. Aishima S, Oda Y. Pathogenesis and classification of intrahepatic cholangiocarcinoma: different characters of perihilar large duct type versus peripheral small duct type. J Hepatobiliary Pancreat Sci 2015;22:94‐100. [DOI] [PubMed] [Google Scholar]
- 7. Nakanuma Y, Sato Y, Harada K, Sasaki M, Xu J, Ikeda H. Pathological classification of intrahepatic cholangiocarcinoma based on a new concept. World J Hepatol 2010;2:419‐427. [DOI] [PMC free article] [PubMed] [Google Scholar]
- 8. Liau JY, Tsai JH, Yuan RH, Chang CN, Lee HJ, Jeng YM. Morphological subclassification of intrahepatic cholangiocarcinoma: etiological, clinicopathological, and molecular features. Mod Pathol 2014;27:1163‐1173. [DOI] [PubMed] [Google Scholar]
- 9. Cardinale V, Renzi A, Carpino G, Torrice A, Bragazzi MC, Giuliante F, et al. Profiles of cancer stem cell subpopulations in cholangiocarcinomas. Am J Pathol 2015;185:1724‐1739. [DOI] [PMC free article] [PubMed] [Google Scholar]
- 10. Yamashita T, Wang XW. Cancer stem cells in the development of liver cancer. J Clin Invest 2013;123:1911‐1918. [DOI] [PMC free article] [PubMed] [Google Scholar]
- 11. Ali N, Chandrakesan P, Nguyen CB, Husain S, Gillaspy AF, Huycke M, et al. Inflammatory and oncogenic roles of a tumor stem cell marker doublecortin‐like kinase (DCLK1) in virus‐induced chronic liver diseases. Oncotarget 2015;6:20327‐20344. [DOI] [PMC free article] [PubMed] [Google Scholar]
- 12. Chandrakesan P, Yao J, Qu D, May R, Weygant N, Ge Y, et al. Dclk1, a tumor stem cell marker, regulates pro‐survival signaling and self‐renewal of intestinal tumor cells. Mol Cancer 2017;16:30. [DOI] [PMC free article] [PubMed] [Google Scholar] [Retracted]
- 13. Westphalen CB, Takemoto Y, Tanaka T, Macchini M, Jiang Z, Renz BW, et al. Dclk1 defines quiescent pancreatic progenitors that promote injury‐induced regeneration and tumorigenesis. Cell Stem Cell 2016;18:441‐455. [DOI] [PMC free article] [PubMed] [Google Scholar]
- 14. Nakanishi Y, Seno H, Fukuoka A, Ueo T, Yamaga Y, Maruno T, et al. Dclk1 distinguishes between tumor and normal stem cells in the intestine. Nat Genet 2013;45:98‐103. [DOI] [PubMed] [Google Scholar]
- 15. Westphalen CB, Asfaha S, Hayakawa Y, Takemoto Y, Lukin DJ, Nuber AH, et al. Long‐lived intestinal tuft cells serve as colon cancer‐initiating cells. J Clin Invest 2014;124:1283‐1295. [DOI] [PMC free article] [PubMed] [Google Scholar]
- 16. Whorton J, Sureban SM, May R, Qu D, Lightfoot SA, Madhoun M, et al. DCLK1 is detectable in plasma of patients with Barrett's esophagus and esophageal adenocarcinoma. Dig Dis Sci 2015;60:509‐513. [DOI] [PMC free article] [PubMed] [Google Scholar]
- 17. Bailey JM, Alsina J, Rasheed ZA, McAllister FM, Fu YY, Plentz R, et al. DCLK1 marks a morphologically distinct subpopulation of cells with stem cell properties in preinvasive pancreatic cancer. Gastroenterology 2014;146:245‐256. [DOI] [PMC free article] [PubMed] [Google Scholar]
- 18. Ito H, Tanaka S, Akiyama Y, Shimada S, Adikrisna R, Matsumura S, et al. Dominant expression of DCLK1 in human pancreatic cancer stem cells accelerates tumor invasion and metastasis. PLoS One 2016;11:e0146564. [DOI] [PMC free article] [PubMed] [Google Scholar]
- 19. Di Matteo S, Nevi L, Costantini D, Overi D, Carpino G, Safarikia S, et al. The FXR agonist obeticholic acid inhibits the cancerogenic potential of human cholangiocarcinoma. PLoS One 2019;14:e0210077. [DOI] [PMC free article] [PubMed] [Google Scholar]
- 20. Nevi L, Carpino G, Costantini D, Cardinale V, Riccioni O, Di Matteo S, et al. Hyaluronan coating improves liver engraftment of transplanted human biliary tree stem/progenitor cells. Stem Cell Res Ther 2017;8:68. [DOI] [PMC free article] [PubMed] [Google Scholar]
- 21. Nevi L, Cardinale V, Carpino G, Costantini D, Di Matteo S, Cantafora A, et al. Cryopreservation protocol for human biliary tree stem/progenitors, hepatic and pancreatic precursors. Sci Rep 2017;7:6080. [DOI] [PMC free article] [PubMed] [Google Scholar]
- 22. Cardinale V, Puca R, Carpino G, Scafetta G, Renzi A, De Canio M, et al. Adult human biliary tree stem cells differentiate to beta‐pancreatic islet cells by treatment with a recombinant human Pdx1 peptide. PLoS One 2015;10:e0134677. [DOI] [PMC free article] [PubMed] [Google Scholar]
- 23. Kuribara M, Jenks BG, Dijkmans TF, de Gouw D, Ouwens DT, Roubos EW, et al. ERK‐regulated double cortin‐like kinase (DCLK)‐short phosphorylation and nuclear translocation stimulate POMC gene expression in endocrine melanotrope cells. Endocrinology 2011;152:2321‐2329. [DOI] [PubMed] [Google Scholar]
- 24. Gagliardi G, Bellows CF. DCLK1 expression in gastrointestinal stem cells and neoplasia. J Cancer Ther Res 2012;1:12. [Google Scholar]
- 25. Kennedy L, Hargrove L, Demieville J, Francis N, Seils R, Villamaria S, et al. Recent advances in understanding cholangiocarcinoma. F1000Res 2017;6:1818. [DOI] [PMC free article] [PubMed] [Google Scholar]
- 26. Fraveto A, Cardinale V, Bragazzi MC, Giuliante F, De Rose AM, Grazi GL, et al. Sensitivity of human intrahepatic cholangiocarcinoma subtypes to chemotherapeutics and molecular targeted agents: a study on primary cell cultures. PLoS One 2015;10:e0142124. [DOI] [PMC free article] [PubMed] [Google Scholar]
- 27. Mirzaei A, Madjd Z, Kadijani AA, Tavakoli‐Yaraki M, Modarresi MH, Verdi J, et al. Evaluation of circulating cellular DCLK1 protein, as the most promising colorectal cancer stem cell marker, using immunoassay based methods. Cancer Biomark 2016;17:301‐311. [DOI] [PubMed] [Google Scholar]
- 28. Weygant N, Qu D, Berry WL, May R, Chandrakesan P, Owen DB, et al. Small molecule kinase inhibitor LRRK2‐IN‐1 demonstrates potent activity against colorectal and pancreatic cancer through inhibition of doublecortin‐like kinase 1. Mol Cancer 2014;13:103. [DOI] [PMC free article] [PubMed] [Google Scholar]
- 29. Westphalen CB, Quante M, Wang TC. Functional implication of Dclk1 and Dclk1‐expressing cells in cancer. Small GTPases 2017;8:164‐171. [DOI] [PMC free article] [PubMed] [Google Scholar]
- 30. Dai T, Hu Y, Lv F, Ozawa T, Sun X, Huang J, et al. Analysis of the clinical significance of DCLK1(+) colorectal cancer using novel monoclonal antibodies against DCLK1. Onco Targets Ther 2018;11:5047‐5057. [DOI] [PMC free article] [PubMed] [Google Scholar]
- 31. Weygant N, Qu D, May R, Tierney RM, Berry WL, Zhao L, et al. DCLK1 is a broadly dysregulated target against epithelial‐mesenchymal transition, focal adhesion, and stemness in clear cell renal carcinoma. Oncotarget 2015;6:2193‐2205. [DOI] [PMC free article] [PubMed] [Google Scholar]
- 32. Sureban SM, May R, Qu D, Weygant N, Chandrakesan P, Ali N, et al. DCLK1 regulates pluripotency and angiogenic factors via microRNA‐dependent mechanisms in pancreatic cancer. PLoS One 2013;8:e73940. [DOI] [PMC free article] [PubMed] [Google Scholar]
- 33. Wang W, Zhang H, Wang L, Zhang S, Tang M. miR‐613 inhibits the growth and invasiveness of human hepatocellular carcinoma via targeting DCLK1. Biochem Biophys Res Commun 2016;473:987‐992. [DOI] [PubMed] [Google Scholar]
- 34. Li L, Jones K, Mei H. Doublecotin‐like kinase 1 increases chemoresistance of colorectal cancer cells through the anti‐apoptosis pathway. J Stem Cell Res Ther 2019;9:447. [DOI] [PMC free article] [PubMed] [Google Scholar]
- 35. Liu ZQ, He WF, Wu YJ, Zhao SL, Wang L, Ouyang YY, et al. LncRNA SNHG1 promotes EMT process in gastric cancer cells through regulation of the miR‐15b/DCLK1/Notch1 axis. BMC Gastroenterol 2020;20:156. [DOI] [PMC free article] [PubMed] [Google Scholar]
- 36. Yan R, Li J, Zhou Y, Yao L, Sun R, Xu Y, et al. Inhibition of DCLK1 down‐regulates PD‐L1 expression through Hippo pathway in human pancreatic cancer. Life Sci 2020;241:117150. [DOI] [PubMed] [Google Scholar]
- 37. Makino S, Takahashi H, Okuzaki D, Miyoshi N, Haraguchi N, Hata T, et al. DCLK1 integrates induction of TRIB3, EMT, drug resistance and poor prognosis in colorectal cancer. Carcinogenesis 2020;41:303‐312. [DOI] [PubMed] [Google Scholar]
- 38. Liu W, Wang S, Sun Q, Yang Z, Liu M, Tang H. DCLK1 promotes epithelial‐mesenchymal transition via the PI3K/Akt/NF‐kappaB pathway in colorectal cancer. Int J Cancer 2018;142:2068‐2079. [DOI] [PubMed] [Google Scholar]
- 39. Sureban SM, Madhoun MF, May R, Qu D, Ali N, Fazili J, et al. Plasma DCLK1 is a marker of hepatocellular carcinoma (HCC): targeting DCLK1 prevents HCC tumor xenograft growth via a microRNA‐dependent mechanism. Oncotarget 2015;6:37200‐37215. [DOI] [PMC free article] [PubMed] [Google Scholar]
- 40. Gao T, Wang M, Xu L, Wen T, Liu J, An G. DCLK1 is up‐regulated and associated with metastasis and prognosis in colorectal cancer. J Cancer Res Clin Oncol 2016;142:2131‐2140. [DOI] [PMC free article] [PubMed] [Google Scholar]
- 41. Harada Y, Kazama S, Morikawa T, Emoto S, Murono K, Kaneko M, et al. Prognostic impact of doublecortin‐like kinase 1 expression in locally advanced rectal cancer treated with preoperative chemoradiotherapy. APMIS 2018;126:486‐493. [DOI] [PubMed] [Google Scholar]
- 42. Delgiorno KE, Hall JC, Takeuchi KK, Pan FC, Halbrook CJ, Washington MK, et al. Identification and manipulation of biliary metaplasia in pancreatic tumors. Gastroenterology 2014;146:233‐244.e235. [DOI] [PMC free article] [PubMed] [Google Scholar]
- 43. Andresen K, Boberg KM, Vedeld HM, Honne H, Hektoen M, Wadsworth CA, et al. Novel target genes and a valid biomarker panel identified for cholangiocarcinoma. Epigenetics 2012;7:1249‐1257. [DOI] [PMC free article] [PubMed] [Google Scholar]
- 44. Zaccari P, Cardinale V, Severi C, Pedica F, Carpino G, Gaudio E, et al. Common features between neoplastic and preneoplastic lesions of the biliary tract and the pancreas. World J Gastroenterol 2019;25:4343‐4359. [DOI] [PMC free article] [PubMed] [Google Scholar]
- 45. Andresen K, Boberg KM, Vedeld HM, Honne H, Jebsen P, Hektoen M, et al. Four DNA methylation biomarkers in biliary brush samples accurately identify the presence of cholangiocarcinoma. Hepatology 2015;61:1651‐1659. [DOI] [PMC free article] [PubMed] [Google Scholar]
Associated Data
This section collects any data citations, data availability statements, or supplementary materials included in this article.
Supplementary Materials
Supplementary Material