

Abstract
Background
Autosomal dominant polycystic kidney disease (ADPKD) is one of the most common monogenetic disorders in humans and is characterized by numerous fluid-filled cysts that grow slowly, resulting in end-stage renal disease in the majority of patients. Preclinical studies have indicated that treatment with low-dose thiazolidinediones, such as pioglitazone, decrease cyst growth in rodent models of PKD.
Methods
This Phase 1b cross-over study compared the safety of treatment with a low dose (15 mg) of the peroxisome proliferator-activated receptor-γ (PPAR-γ) agonist pioglitazone or placebo in PKD patients, with each treatment given for 1 year. The study monitored known side effects of PPAR-γ agonist treatment, including fluid retention and edema. Liver enzymes and risk of hypoglycemia were assessed throughout the study. As a secondary objective, the efficacy of low-dose pioglitazone was followed using a primary assessment of total kidney volume (TKV), blood pressure (BP) and kidney function.
Results
Eighteen patients were randomized and 15 completed both arms. Compared with placebo, allocation to pioglitazone resulted in a significant decrease in total body water as assessed by bioimpedance analysis {mean difference 0.16 Ω [95% confidence interval (CI) 0.24–2.96], P = 0.024} and no differences in episodes of heart failure, clinical edema or change in echocardiography. Allocation to pioglitazone led to no difference in the percent change in TKV of −3.5% (95% CI −8.4–1.4, P = 0.14), diastolic BP and microalbumin:creatinine ratio.
Conclusions
In this small pilot trial in people with ADPKD but without diabetes, pioglitazone 15 mg was found to be as safe as placebo. Larger and longer-term randomized trials powered to assess effects on TKV are needed.
Keywords: anti-hypertensive, crossover design, MRI, PPARγ, agonists, total kidney volume
INTRODUCTION
Autosomal dominant polycystic kidney disease (ADPKD) is one of the most common monogenetic disorders in humans and is characterized by numerous fluid-filled cysts that are present in utero and grow slowly throughout a patient’s life. The growth ultimately compromises renal function, with approximately one-half of the patients progressing to end-stage renal disease by 60 years of age [1, 2]. The disease arises predominately from mutations in either polycystin 1 or 2 encoded by PKD1 and PKD2 [2–4]. While there is some controversy regarding the diversity of functions of these proteins, the current evidence supports the formation of a highly regulated, nonspecific cation channel that is responsible for modulating intracellular calcium [4, 5].
As the disease progresses, renal cyst growth involves an excess proliferation of epithelial cells, intracyst fluid accumulation and remodeling of the extracellular matrix [4]. Among the myriad intracellular signaling pathways that are implicated in the pathogenesis, increases in cyclic adenosine monophosphate (cAMP) appear to play a key role by stimulating both increased cellular proliferation and fluid secretion [4–8]. Researchers have demonstrated that fluid secretion is driven by transcellular Cl− secretion via the cystic fibrosis transmembrane conductance regulator (CFTR), which is stimulated by cAMP agonists including arginine vasopressin [9–12]. In tissue culture studies using principal cell lines as models of the mammalian distal nephron, we have shown that a variety of insulin-sensitizing drugs known as peroxisome proliferator-activated receptor-γ (PPAR-γ) agonists or thiazolidinediones decrease the synthesis of CFTR and show concentration–response relationships for inhibition of vasopressin-stimulated anion transport with half maximal inhibitory concentrations that are ∼10-fold lower than the half maximal effective concentrations for receptor transactivation. These findings indicate that the inhibitory effect of the PPAR-γ agonists on Cl− transport may be mediated at concentrations below those used to modulate insulin sensitivity in diabetes. Importantly, this effect was observed at concentrations that were less than the effective concentration for insulin sensitization [13].
In our preclinical studies, two PPAR-γ agonists, pioglitazone and rosiglitazone, attenuated cyst growth in the PCK rat, a slowly progressing model of PKD [14, 15]. The PCK model was chosen because it is orthologous to autosomal recessive polycystic kidney disease while showing the phenotypic characteristics of ADPKD, including a slowly progressive disease and gender dimorphism in the relative severity of kidney and liver disease [16]. In addition, pioglitazone was effective in Wistar Wpk/Wpk rats, a rapidly progressing model of PKD that is orthologous to human type 3 Meckel–Gruber syndrome [15, 17]. In all the preclinical studies, the PPAR-γ agonists were effective at doses that were equivalent to or lower than analogous human doses used to treat diabetes. While our preclinical studies indicated that the major effect of low-dose thiazolidinediones is manifested as a decrease in CFTR expression, other beneficial effects may also contribute. Notably, at considerably higher concentrations, pioglitazone and rosiglitazone have been shown to have beneficial effects on endothelial function [18] and vascular oxidative stress [19].
Based on these studies, we hypothesized that low-dose PPAR-γ agonists may be a safe and effective treatment for ADPKD. The primary objective of this Phase 1b clinical study was to test the safety of the lowest commercially available dose of 1-year treatment of pioglitazone (15 mg/day) compared with placebo in human ADPKD patients in a 2-year crossover study in which each individual served as their own control. Known side effects of PPAR-γ agonist treatment, including fluid retention and edema, were monitored. Liver enzymes and risk of hypoglycemia were assessed throughout the study. As a secondary objective, the efficacy of low-dose pioglitazone was followed using magnetic resonance imaging (MRI) assessment of changes in total kidney volume (TKV) and other renal parameters. These data will inform the power calculations for a future multicenter trial.
MATERIALS AND METHODS
Study design
The study was a double-blind, placebo-controlled, crossover Phase 1b trial of pioglitazone (15 mg/day) versus placebo. The detailed inclusion/exclusion criteria are provided in the protocol in the Supplementary data. Briefly, patients 18–55 years of age with known ADPKD, estimated glomerular filtration rate (eGFR) >50 mL/min/m2 on recent labs and no history of diabetes were identified using International Classification of Diseases, 9th and 10th revisions (ICD-9 and ICD-10) codes for cystic kidney disease by a search of electronic medical records in the statewide Indiana Patient Care Network. Other patients were identified through advertisements and letters sent to nephrologists in a tristate area. Patients who fulfilled the initial screening criteria signed informed consent and underwent further screening with a baseline MRI of the kidney ≤30 days prior to the baseline visit. Patients were then randomized to pioglitazone or placebo providing the TKV was ≥675 mL (18–25 years old), ≥900 mL (26–35 years old) or ≥1350 mL (36–55 years old). These criteria define patients with a high likelihood of rapid progression based on the Consortium for Radiologic Imaging Studies of Polycystic Kidney Disease (CRISP) study [18–20]. Given the interreader reliability of 10%, we decreased the CRISP MRI criteria for enrollment by 10%. The study was approved by the US Food and Drug Administration (IND 117464) and the Indiana University Institutional Review Board (1308084213). The study was registered on ClinicalTrials.gov (NCT02697617). A copy of the study protocol is provided in the Supplementary material.
Interventions
The study design is shown in Figure 1. Patients were block randomized by an investigational pharmacist to placebo or pioglitazone (15 mg) as a tablet taken once a day. After 1 year, plus a 2- to 4-week washout period, the patient was transitioned to the opposite therapy (pioglitazone or placebo) for 1 year (Figure 1). The investigational pharmacist distributed the medication to patients and performed pill counts upon return to ensure blinding of the patients and investigators. The pioglitazone tablets were purchased from a pharmaceutical distributor (courtesy of the National PKD Foundation) and both the pioglitazone and placebo were overencapsulated in an identical manner (University of Iowa Pharmaceuticals). Subjects were seen at the start of each period and then at Months 1, 3, 6, 9 and 12 during each 1 year treatment period (arm) and contacted by phone once a month to encourage medication adherence, defined as >80% prescribed pill intake. Standardized blood pressure (BP) measurements were performed according to the CRISP protocol [20–22]. Urine was collected as the first morning void and analyzed for microalbumin:creatinine (MAC) ratio at the Indiana University Health (IUH) Pathology Lab. Blood for basic biochemistries and blood counts were also analyzed at the IUH Pathology Laboratory.
FIGURE 1:
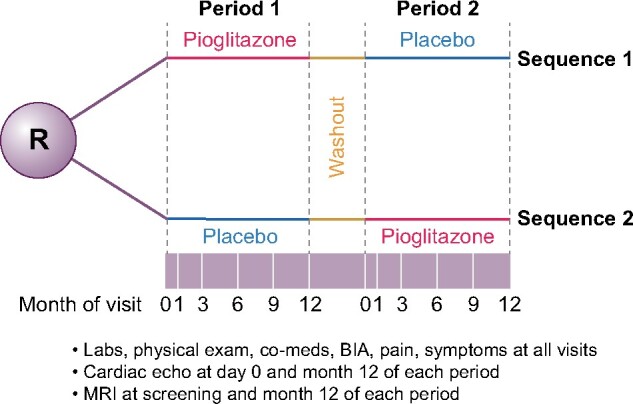
Study schema. The study was a crossover trial where patients were randomized to either pioglitazone or placebo for 1 year, followed by a 2- to 4-week washout and then the other treatment. Study visits (white lines in purple bar) were done throughout the study. MRI to assess TKV was done at the beginning of Period 1, the end of Period 1 and the end of Period 2. The end of Period 1 served as the initial TKV for Period 2.
Safety endpoints
The primary objective was to provide data on the safety of low-dose (15 mg/day) pioglitazone compared with placebo. At each visit, bioimpedance analyses, assessment of edema and standardized BP were performed by the coordinator under the supervision of SMM, RNM or RLB. Fluid retention was assessed by bioimpedance analysis (BIA) done at baseline and every 3 months of each period by a research coordinator using the Quantum V segmental BIA machine (RJL Sciences, Clinton Township, MI, USA). Bioimpedance (opposition to the flow of an electric current through body tissues) through different segments was used to calculate total body water. The resistance in ohms (Ω) decreases with increased total body water. The number of episodes of edema was defined a priori as either sustained (>1 week of edema despite adjustment of diet) or unresponsive to diuretic therapy. Echocardiography was done at the start and end of each treatment period to specifically assess an increase in end-diastolic ventricular volume or new/increase in pericardial effusion. Congestive heart failure was defined as a new onset of pulmonary symptoms together with either increased interstitial edema on chest X-ray or changes by echocardiogram.
Due to the insulin-sensitizing action of pioglitazone, all subjects were monitored for hypoglycemia (defined as blood glucose ˂70 on routine fasting labs at each study visit). Liver function was also monitored and abnormalities defined as the number of episodes of elevated alanine aminotransferase (ALT) or aspartate aminotransferase (AST) levels >2 times the upper limit of normal.
Efficacy endpoints
The primary efficacy outcome was the percent change in TKV from baseline to 12 months measured by MRI while on either pioglitazone or placebo. Following the protocols developed by the CRISP study [20–22], MRI without gadolinium enhancement was conducted at the initiation, at the 1-year crossover time and at the end of the study (a total of three per study participant) for determination of TKV and total liver volume. MRIs were reviewed locally to ensure adequate imaging and were made available after anonymization to the Imaging Core of the Mayo Translational PKD Center using the National Biomedical Imaging Archive. Kidneys or liver volumes were measured from coronal T1-weighted images from MR or axial CT images, using a stereological method with ANALYZEsoftware (AnalyzeDirect, Overland Park, KS, USA). Initial measurements for screening were done by one of three available radiologists, but actual study results were read by a single radiologist blinded to study intervention.
Secondary efficacy endpoints were measures of kidney function, including the change in the eGFR by the Chronic Kidney Disease Epidemiology Collaboration (CKD-EPI) formula, change in the urine MAC ratio and/or change in BP. Due to the relatively high incidence of polycystic liver disease in PKD patients, the liver volume was also measured by MRI. Pain was recorded by asking the patient if they had pain associated with their cystic disease and to rank their pain on a Likert scale (scored 1–10).
Statistical methods
Baseline characteristics were compared between screened versus enrolled patients via Fisher’s exact test (for categorical variables) or Kruskal–Wallis test (for continuous variables due to nonnormality of some variables). The endpoints were analyzed by examining the net change over each period. Safety tests included total body water, clinical edema and episodes of heart failure assessed at each visit and echocardiography assessed twice in each period. For efficacy, BP, pain scores, eGFR and MAC ratio were done at each visit and TKV by MRI was done twice in each period. For tests with multiple assessments in each period, the average of all measures at each visit (Months 3, 6, 9 and 12) in each period was determined to compare with the existing literature and a cumulative score per period was derived using the area under the concentration–time curve from the first visit of the period (where drug was taken for at least 3 months) to the last visit of the period. The TKV and liver volume were analyzed as the percent change over time. A positive value indicates an increase in volume, while a negative value indicates a decrease. All outcomes were first analyzed using a linear mixed model to assess if there were carryover effects (there were none). They were subsequently analyzed using paired t-tests to compare the mean differences between treatments. For the paired t-test, when the absence of normality (assessed via the Q–Q plots) of the paired differences was suspected, Wilcoxon signed-rank tests were also conducted. As there were no substantive differences in the conclusions between the two tests, paired t-tests are reported. Analyses were performed using the intention-to-treat principle. No hierarchy of testing or adjustment for multiplicity of hypothesis testing was used due to the pilot nature of the study and its focus on safety. Missing values were not imputed. Adverse events (AEs) were categorized based on clinical symptoms by the principal investigator (S.M.M.) before unblinding and compared by the biostatisticians (S.P. and M.L.L.). The ‘other’ AEs occurred primarily in the placebo group and thus were not relevant to the safety of pioglitazone.
Sample size
The primary endpoint was safety. However, we calculated the desired sample size for efficacy for change in TKV by MRI. For the treatment effect, we assumed an annual 6% increase in TKV while on placebo based on controls from other trials [23–26] and 4% while on the drug. Using a treatment effect of 2%, a standard deviation (SD) of 4%, correlation of 0.69, 5% type I error and power of 80% using a two-sided paired t-test, we estimated 22 subjects were needed to complete both arms in order to evaluate the efficacy endpoint of the trial.
RESULTS
A total of 118 subjects were screened and 35 signed an informed consent and underwent further laboratory and clinical evaluations and MRI. Eighteen patients fulfilled all criteria and were randomized beginning 21 January 2016 and ending 17 July 2017 (Figure 2). Although our desired enrollment was 22 patients, we were unable to reach that goal despite aggressive recruitment. The data safety monitoring board suggested closing enrollment since the primary endpoint was safety. Three patients dropped out before completion of both periods and therefore were included in the safety but not the efficacy analyses. Two of these patients dropped out for personal reasons (one 6 months into the first treatment period and one just prior to starting the second period) and a third patient dropped out in period 1 due to pregnancy. The last visit for the last patient was on 20 August 2019. Table 1 contains the baseline characteristics of the subjects who were enrolled compared with those who were randomized. Of the 15 patients who completed both arms, baseline TKV was Stage 1C in 4 patients, Stage 1D in 4 patients and Stage 1E in 6 patients [22]. Protocol deviations were minor and did not affect study conduct. Study drug adherence was 81.4–99.9% (average ± SD, 92.88 ± 5.31). There was no difference in drug adherence between the two periods.
FIGURE 2:
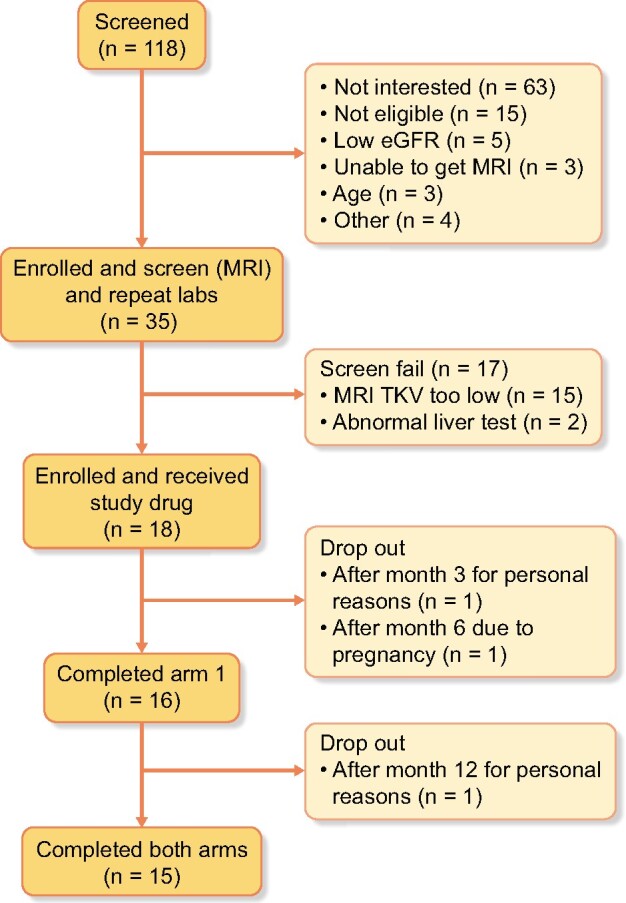
Consort diagram of patient participation.
Table 1.
Baseline characteristics
| Characteristics | All enrolled | Randomized | Completed | *P-value |
|---|---|---|---|---|
| Overall, n | 35 | 18 | 15 | |
| Age (years) | 35.68 ± 7.67 | 34.21 ± 7.54 | 35.81 ± 6.87 | 0.26 |
| Female gender, n (%) | 25 (71.43) | 11 (61.11) | 9 (60) | 0.26 |
| White race, n (%) | 21 (60) | 13 (72.22) | 11 (73.33) | 0.18 |
| Family history of ADPKD, n (%) | 28 (80) | 15 (83.33) | 12 (80) | – |
| eGFR (CKD-EPI) (mL/min/m2) | 79.6 ± 27.66 | 86.29 ± 26.51 | 83.86 ± 23.28 | 0.14 |
| MAC ratio (μg/g) | 0.33 ± 0.38 | 0.38 ± 0.4 | 0.39 ± 0.44 | 0.05 |
| Systolic BP (mmHg) | 130.6 ± 12.15 | 133.83 ± 13.29 | 134.87 ± 12.06 | 0.05 |
| Diastolic BP (mmHg) | 87.3 ± 7.05 | 87.72 ± 6.74 | 88.67 ± 6.64 | 0.61 |
| Right kidney volume (mL) | 816 ± 746.38 | 964.5 ± 635.85 | 1049.2 ± 662.32 | 0.004 |
| Left kidney volume (mL) | 872.24 ± 691.56 | 1078.17 ± 651.7 | 1150.93 ± 693.81 | <0.001 |
| Albumin (g/dL) | 4.36 ± 0.27 | 4.38 ± 0.23 | 4.37 ± 0.22 | 0.57 |
| Alkaline phosphatase (U/L) | 53.65 ± 17.52 | 54.94 ± 19.79 | 57.69 ± 20.62 | 0.75 |
| ALT (U/L) | 16.72 ± 9.56 | 18.65 ± 10.6 | 18.64 ± 11 | 0.37 |
| AST (U/L) | 20.28 ± 9.17 | 19.47 ± 6.37 | 19.43 ± 6.45 | 0.70 |
| Calcium (mg/dL) | 9.45 ± 0.32 | 9.42 ± 0.36 | 9.34 ± 0.33 | 0.34 |
| Chloride (mmol/L) | 105.19 ± 2.32 | 104.53 ± 1.91 | 104.43 ± 1.83 | 0.09 |
| Creatinine (mg/dL) | 3.64 ± 9.82 | 1.03 ± 0.36 | 1.04 ± 0.36 | 0.28 |
| Glucose (mg/dL) | 85.34 ± 8.33 | 84.41 ± 6.69 | 83.29 ± 6.41 | 0.57 |
| Potassium (mmol/L) | 3.89 ± 0.33 | 3.89 ± 0.3 | 3.89 ± 0.32 | 0.91 |
| Sodium (mmol/L) | 137.56 ± 1.54 | 137.41 ± 1.42 | 137.36 ± 1.45 | 0.88 |
| Total bilirubin (mmol/L) | 0.58 ± 0.2 | 0.55 ± 0.2 | 0.58 ± 0.19 | 0.63 |
| Total protein (mmol/L) | 7.29 ± 0.33 | 7.24 ± 0.21 | 7.22 ± 0.21 | 0.63 |
| Blood urea nitrogen (mg/dL) | 19.44 ± 10.4 | 17.47 ± 5.58 | 17.21 ± 5.74 | 0.76 |
| Total carbon dioxide (mmol) | 24.5 ± 2.82 | 25.06 ± 2.38 | 24.86 ± 2.38 | 0.20 |
| Anion gap (mmol/L) | 7.88 ± 1.52 | 7.82 ± 1.63 | 8.07 ± 1.64 | 0.51 |
The values are presented as mean + SD unless stated otherwise. *P-value of enrolled and not randomized versus randomized.
Safety
The primary endpoint of the study was safety, therefore all patients who received at least one dose of either pioglitazone or placebo were evaluated (n = 18) (Table 2). No patients had increased edema that met the protocol definition of significance. One patient reported transient edema, lasting 1 day, at a study visit. This finding was considered an adverse effect possibly related to the study drug and occurred in the pioglitazone period. There was a small but significant increase in the average resistance (decreased total body water) assessed by BIA between the two treatments {pioglitazone = 45.8 ± 11.7 versus placebo 44.2 ± 11.1 Ω; mean difference 0.1.60 [95% confidence interval (CI) 0.24–2.96], P = 0.024} (Figure 3). Similarly, the area under the curve (AUC) of resistance was 571 ± 147 Ω for pioglitazone versus 552 ± 138 Ω for placebo (P = 0.011). There was no change in echocardiography in any patient during the course of the study. The major AEs are noted in Table 3. One patient had recurrent asymptomatic fasting low blood sugars on protocol blood draws in both periods (ranging from 31 to 76 mg/dL). Per protocol, the patient received a glucometer and the non-fasting blood sugars ranged from 75 to 100 mg/dL at home. This was discussed with the Data Safety Monitoring Board (DSMB), where one member was an endocrinologist with expertise in diabetes trials. Given the asymptomatic nature, the condition was not felt to be significant. Another patient had an elevation in a liver function test that occurred in the pioglitazone period, but this resolved on recheck 1 week later.
Table 2.
Safety endpoints
| Outcome | Pioglitazone, mean (95% CI) | Placebo, mean (95% CI) | Mean difference (95% CI) between periods | P-value |
|---|---|---|---|---|
| BIA (Ω), increase = decrease in total body water | 45.78 (39.19–52.36) | 44.17 (37.96–50.39) | 1.60 (0.24–2.96) | 0.024 |
| Episodes of congestive heart failure, echocardiography or visit to doctor for shortness of breath, n | 0 | 0 | – | – |
| Episodes of edema that were sustained or refractory to diuretics, n | 0 | 0 | – | – |
| Hypoglycemia <70 mg/dL ( patients and episodes), n | One patienta with three episodes | One patient with four episodes | – | – |
| Elevated ALT or AST >2 times the upper limit of normal (patients and episodes), n | One patient with one episode | 0 | – | – |
The same patient had episodes in both arms, occurring at nearly every visit with fasting. Glucometer at home confirmed >70 in non-fasting state. All episodes asymptomatic.
FIGURE 3:

Average resistance during treatment by bioelectric impedance analyses for each period. The plot illustrates the mean ± SD for resistance at 10 kHz during either the pioglitazone (open circles: mean ± SD = 45.8 ± 11.7 Ω) or placebo treatment (open squares: 44.2 ± 11.1 Ω) period. Bars represent mean ± SD (n = 15). The lower the resistance, the more interstitial fluid is present. Thus pioglitazone significantly reduced interstitial fluid compared with placebo.
Table 3.
Adverse events
| System classification | Pioglitazone events, n (%) | Pioglitazone Patients affected, n (%) | Pioglitazone Events per patient, minimum–maximum | Placebo, n (%) | Placebo Patients affected, n (%) | Placebo Events per patient, (minimum–maximum) |
|---|---|---|---|---|---|---|
| Headache of any type | 36 (26.5) | 8 (50) | 1–12 | 35 (23.6) | 9 (52.9) | 1–11 |
| Musculoskeletal pain/injury | 17 (12.5) | 7 (43.8) | 1–6 | 23 (15.5) | 9 (52.9) | 1–7 |
| Urinary tract infection, cyst rupture and kidney pain | 12 (8.8) | 7 (43.8) | 1–3 | 18 (12.2) | 9 (52.9) | 1–4 |
| PKD/kidney abdominal pain | 0 (0) | 4 (2.7) | 2 (11.8) | 2 | ||
| Gastrointestinal disorder (e.g. diarrhea, gastroesophageal reflux disease) | 9 (6.6) | 6 (37.5) | 1–2 | 10 (6.8) | 5 (29.4) | 1–5 |
| Infection or virus non genitourinary system | 38 (27.9) | 13 (81.3) | 1–7 | 30 (20.3) | 15 (93.8) | 1–6 |
| Dizziness, lightheadedness and vertigo | 6 (4.4) | 4 (25) | 1–3 | 6 (4.1) | 3 (17.6) | 1–4 |
| Skin problems | 5 (3.7) | 4 (25) | 1–2 | 2 (1.4) | 2 (11.8) | 1 |
| Allergies | 3 (2.2) | 3 (18.8) | 1 | 0 (0) | ||
| Edema not meeting safety endpoint criteria | 4 (2.9) | 3 (18.8) | 1–2 | 0 (0) | ||
| Othera | 6 (4.4) | 5 (3.1) | 1–2 | 20 (13.5) | 11 (64.7) | 1–6 |
Generalized linear mixed modeling (GLMM) Analysis of the ‘other’ category indicated a significant difference between pioglitazone and placebo in terms of the number of patients with at least one ‘other’ AE (P = 0.0135) and rate of ‘other’ AEs (P = 0.0370). Post hoc analysis was performed to assess the ‘other’ AE category. For subjects who received at least one dose of pioglitazone or placebo, GLLM with binomial distribution and a random patient effect was used to analyze if a patient was more likely to have an ‘other’ AE (yes or no) while on pioglitazone versus placebo. GLLM with Poisson distribution was used to determine if the drug had an effect on the number of ‘other’ AEs a patient experienced.
Efficacy
The efficacy endpoints are listed in Table 4. The primary efficacy endpoint was the percent change in TKV by MRI (Figure 4). There was no change in the absolute and percent change during the 12 months of treatment with pioglitazone compared with placebo. The mean percent change in TKV with pioglitazone versus placebo was 4.3 ± 6.3% versus 7.85 ± 7.68%, respectively. The mean difference between the two periods was −3.5% (95% CI −8.4–1.4, P = 0.146). Two patients had more advanced CKD and greater TKV (>4400 mL) at baseline (versus <3000 mL in the other patients). Excluding these patients did not alter the mean difference results (mean difference without these patients = −3.6%).
Table 4.
Efficacy endpoints
| Outcome | Pioglitazone, mean (95% CI) | Placebo, mean (95% CI) | Mean difference (95% CI) between periods | P-value |
|---|---|---|---|---|
| TKV (% change) | 4.35 (0.84–7.86) | 7.85 (3.60–12.11) | −3.5 (−8.39–1.38) | 0.15 |
| Kidney cyst volume (% change) | 5.64 (1.48–9.79) | 7.82 (3.57–12.08) | −2.19 (07.68–3.3) | 0.41 |
| Kidney cyst index (% change) | 571 (490–652) | 552 (475–629) | −25 (121–70) | 0.58 |
| Liver volume (% change) | 0.31 (−6.12 to 6.73) | −2.46 (−8.27–3.36) | 2.7 (−6.42–11.94) | 0.53 |
| Liver cysts volume (% change) | 30.4 (7.8–53.1) | 23.7 (11.2–36.26) | 6.69 (−19.7–33.1) | 0.59 |
| Liver cysts index (% change) | 27.1 (0.52–53.73) | 21.29 (8.0–34.6) | 5.83 (−20.5–32.1) | 0.63 |
| Pain score AUC (scale 1–10) | 69.9 (32.8–107.1) | 46.9 (20.3–63.2) | 21.6 (−15.45–58.7) | 0.19 |
| eGFR AUC (CKD-EPI) (mL/min/m2) | 956 (805–1108) | 975 (795–1155) | −103 (295–89) | 0.27 |
| eGFR (CKD-EPI) (mL/min/m2), mean (95% CI) | 75.5 (61.99–89.1) | 78.1 (64.3–91.9) | −2.59 (6.24–1.05) | 0.15 |
| MAC ratio AUC (μg/mg) | 37 (17–56) | 38 (24–52) | −03.8 (−22–14) | 0.66 |
| MAC ratio (μg/g), mean (95% CI) | 0.16 (0.12–0.21) | 0.24 (0.13–0.35) | −0.08 (−0.16–0.01) | 0.09 |
| Systolic BP AUC (mmHg) | 1610 (1577–1643) | 1648 (1579–1727) | −125 (−319–70) | 0.19 |
| Systolic BP (mmHg), mean (95% CI) | 127 (124–130) | 129 (124–134) | −2.07 (7.1–3.0) | 0.40 |
| Diastolic BP AUC (mmHg) | 1053 (1015–1091) | 1094 (1052–1134) | −95 (−216–26) | 0.12 |
| Diastolic BP (mmHg), mean (95% CI) | 83 (81–86) | 86 (82–89) | −2.4 (−5.1–0.3) | 0.08 |
| Mean arterial BP (mmHg), mean (95% CI) | 97.9 (95.2–100.5) | 100.2 (96.3–104.1) | −2.29 (−5.5–1.52) | 0.1 |
The 15 subjects who completed both periods are included in the comparison. The mean difference (paired t-test) is the difference between pioglitazone minus placebo for treatment; a negative number represents a lower value with pioglitazone.
There were no significant decreases in diastolic BP, mean arterial pressure and urine MAC ratio with pioglitazone compared with placebo (Table 3 and Figure 5). There was no significant effect of pioglitazone on eGFR, cumulative pain score or liver cysts (Table 4).
FIGURE 5:

Average BP during treatment. The data represent systolic (left panel), diastolic (middle panel) and mean arterial BP (right panel) changes during treatment with pioglitazone (open circles) or placebo (open squares). Dark bars represent the mean and lighter bars the SD (n = 15).
FIGURE 4:
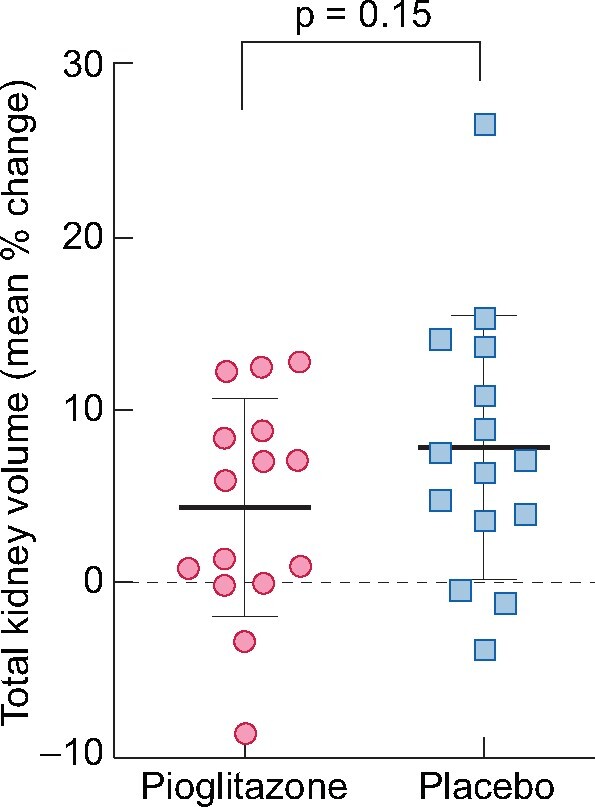
Change in TKV. Mean percent change in TKV in response to each treatment. The plot illustrates the change in TKV of subjects treated with pioglitazone (open circles) and placebo (open squares). Dark bars represent the mean and lighter bars the SD (n = 15).
DISCUSSION
Pioglitazone has been used to treat diabetes for many years and the potential side effects are well documented, but only in the diabetic population where pioglitazone is associated with a mild to moderate rate of edema that is dose dependent [27]. Thus the primary endpoint of the present study was safety, to ensure no significant hypoglycemia or fluid retention, the latter being of significant concern in patients with CKD. We found no evidence that pioglitazone at 15 mg/day caused hypoglycemia or clinical fluid retention assessed by edema in ADPKD patients. Unexpectedly, given the propensity of PPAR-γ agonists to cause fluid retention, there was a small but statistically significant increase in bioimpedance with a mean difference of 1.6 Ω, indicative of less fluid retention with pioglitazone than placebo. For comparison, the mean difference observed after 4 weeks of amlodipine, a drug that causes clinically meaningful edema in up to 15% of patients [28], led to a difference of −21 Ω compared with placebo [29]. Thus there was no evidence of fluid retention with pioglitazone. The overall AEs were also similar in both treatment groups. In summary, no concerning safety signals were observed in the PKD population, although longer studies with continued monitoring of hypoglycemia are required.
The primary efficacy endpoint was a change in TKV and we did not see a significant decrease in the change in TKV, but the results warrant continued assessment of pioglitazone as a treatment to slow the progression of PKD. Although allocation to pioglitazone treatment did not significantly decrease diastolic BP [mean difference −2.39 (95% CI −5.08–0.28), P = 0.07], our observed ∼2 mmHg reduction is consistent with the action of the drug and findings from other trials. A meta-analysis of 37 clinical trials looking at relatively high doses of two thiazolidinediones, rosiglitazone and pioglitazone, in a wide variety of healthy subjects and patients with a duration of treatment of 8–52 weeks found a decrease of 1.84 mmHg (95% CI −3.43 to −0.25) in diastolic BP in subjects treated with thiazolidinediones compared with placebo [30]. In a 1-year study comparing the cardiovascular effects of pioglitazone, metformin and gliclazide, the administration of pioglitazone (up to 45 mg/day) decreased diastolic BP by 1.4 ± 9.2 mmHg [31]. Thus our results are similar to previous studies. Given the importance of BP control in preventing the progression of PKD [32], this adds another potential attribute to the use of pioglitazone.
There were a number of limitations, most notably the small sample size. We did not meet our original recruitment target. We observed a difference in the percent change in TKV of 3.5% between pioglitazone and placebo at 12 months, an SD of 7%, and correlation between the percent change from the same subject under the two treatment conditions of 0.22. If these numbers are the true population numbers, a sample size of 51 subjects would be needed to have 80% power in a crossover design using a two-sided paired t-test with a 5% type I error. The SD observed in the Tolvaptan Efficacy and Safety in Management of Autosomal Dominant Polycystic Kidney Disease and Its Outcomes (TEMPO) study at 1 year [23] was 8.9%. Using these data, a sample size of 82 subjects is needed in a crossover design to have 80% power using a two-sided paired t-test with a 5% type I error. A second limitation is the crossover design, which although useful to minimize confounders, can sometimes produce less conservative treatment effect estimates than parallel-arm trials [33]. However, excepting this potential caveat, if designing a parallel group trial using a difference in percent TKV of 3.5% between pioglitazone and placebo at 12 months, with the SD of change estimated at 7.0% (our study) or 8.9% (TEMPO), a sample size of 64 or 103, respectively, per arm would be needed to have 80% power using a two-sided, two-sample t-test with 5% type I error. Another limitation is that it is also possible that we did not utilize a high-enough dose of pioglitazone; however, our preclinical studies found the effect on cyst growth was manifested at concentrations that were less than the effective concentrations for insulin sensitization [13–15]. Given that one patient had asymptomatic hypoglycemia, we believe the lowest effective dose is still a goal given that long-term administration of these drugs would be required in patients with PKD.
In summary, in this Phase 1b study, pioglitazone was found to be safe when given to nondiabetics with ADPKD at a dose of 15 mg/day for 1 year compared with placebo. There was no statistical improvement in the percent change in TKV, diastolic BP and MAC ratio with pioglitazone versus placebo. However, taken together, the results of this Phase 1b study justify a prospective randomized controlled trial to definitively test the efficacy and long-term safety of this inexpensive therapy in patients with ADPKD.
SUPPLEMENTARY DATA
Supplementary data are available at ckj online.
Supplementary Material
ACKNOWLEDGEMENTS
The authors would like to thank the members of the DSMB for their helpful oversight and the patients for their willingness to participate.
FUNDING
The work was supported by a grant from the US Food and Drug Administration (RO1 FD004826). The Polycystic Kidney Disease Foundation provided funding for the pioglitazone and placebo formulations. An Indiana National Institues of Health (NIH) Clinical Translational Science Award (UL1TR002529-01) provided preclinical support, regulatory guidance, study monitoring, database support and statistical support. Measurements of kidney and liver volumes were supported in part by the Mayo Clinic Robert M. and Billie Kelley Pirnie Translational PKD Center and NIH Diabetes and Digestive and Kidney Diseases grant P30DK090728. S.M.M. is also supported by NIH grants AR072581, DK110871 and ULTR002529-01 and receives consulting fees from Amgen, Sanifit, Ardeylx and Novo Nordisk and grants from Chugai and Keryx. B.L.B.-Y. is supported by a Department of Defense Peer Reviewed Medical Research Program grant (W81XWH-16-PRMRP-IIRA). R.N.M. is funded by an NIH award (NIH-K23DK102824). The funding sources had no role in the study design, data collection/interpretation or writing of the manuscript.
AUTHORS’ CONTRIBUTIONS
B.L.B.Y. and S.M.M. designed the study, interpreted the data and collaborated on the initial draft of the manuscript. S.M.M. provided medical oversight of the study, assessed AE severity and relatedness, drafted the interim reports and interacted with the granting agencies, IRB and DSMB. S.M.M., R.M. and R.L.B. performed clinical assessments. V.T. provided advice on study design and facilitated the reading of the MRI results at the Mayo Clinic. B.E., M.E. and M.B. were responsible for the MRI reading and imaging. K.P., N.S. and K.S. served as coordinators for the study. S.M.P. and M.L.L. were responsible for the statistical analyses. All authors approved the final version of the manuscript.
CONFLICT OF INTEREST STATEMENT
B.L.B.-Y. is the inventor of a published (23 April 2020) patent application entitled ‘PPAR Gamma Modulators for Treating Cystic Disease’. R.L.B. is the founder and chief scientific officer of Rene Medical and Apoptocyst and serves on the Scientific Review Panel of Otsuka. K.M.P.-S. is currently an employee of Eli Lilly, Indianapolis, IN, USA. V.E.T. reports grants and/or other fees from Acceleron Pharma, Blueprint Medicines, Mironid, Otsuka Pharmaceuticals, Palladio Biosciences, Sanofi Genzyme, Regulus Therapeutics and Vertex Pharmaceuticals, all outside the submitted work.
REFERENCES
- 1. Schrier RW, McFann KK, Johnson AM.. Epidemiological study of kidney survival in autosomal dominant polycystic kidney disease. Kidney Int 2003; 63: 678–685 [DOI] [PubMed] [Google Scholar]
- 2. Harris PC, Hopp K.. The mutation, a key determinant of phenotype in ADPKD. J Am Soc Nephrol 2013; 24: 868–870 [DOI] [PubMed] [Google Scholar]
- 3. Hanaoka K, Qian F, Boletta A. et al. Co-assembly of polycystin-1 and -2 produces unique cation-permeable currents. Nature 2000; 408: 990–994 [DOI] [PubMed] [Google Scholar]
- 4. Harris PC, Torres VE.. Genetic mechanisms and signaling pathways in autosomal dominant polycystic kidney disease. J Clin Invest 2014; 124: 2315–2324 [DOI] [PMC free article] [PubMed] [Google Scholar]
- 5. Hanaoka K, Guggino WB.. cAMP regulates cell proliferation and cyst formation in autosomal polycystic kidney disease cells. J Am Soc Nephrol 2000; 11: 1179–1187 [DOI] [PubMed] [Google Scholar]
- 6. Grantham JJ. 1992 Homer Smith Award. Fluid secretion, cellular proliferation, and the pathogenesis of renal epithelial cysts. J Am Soc Nephrol 1993; 3: 1841–1857 [DOI] [PubMed] [Google Scholar]
- 7. Yamaguchi T, Nagao S, Kasahara M. et al. Renal accumulation and excretion of cyclic adenosine monophosphate in a murine model of slowly progressive polycystic kidney disease. Am J Kidney Dis 1997; 30: 703–709 [DOI] [PubMed] [Google Scholar]
- 8. Wallace DP. Cyclic AMP-mediated cyst expansion. Biochim Biophys Acta 2011; 1812: 1291–1300 [DOI] [PMC free article] [PubMed] [Google Scholar]
- 9. Grantham JJ, Ye M, Gattone VH 2nd. et al. In vitro fluid secretion by epithelium from polycystic kidneys. J Clin Invest 1995; 95: 195–202 [DOI] [PMC free article] [PubMed] [Google Scholar]
- 10. Ye M, Grantham JJ.. The secretion of fluid by renal cysts from patients with autosomal dominant polycystic kidney disease. N Engl J Med 1993; 329: 310–313 [DOI] [PubMed] [Google Scholar]
- 11. Davidow CJ, Maser RL, Rome LA. et al. The cystic fibrosis transmembrane conductance regulator mediates transepithelial fluid secretion by human autosomal dominant polycystic kidney disease epithelium in vitro. Kidney Int 1996; 50: 208–218 [DOI] [PubMed] [Google Scholar]
- 12. Mangoo-Karim R, Ye M, Wallace DP. et al. Anion secretion drives fluid secretion by monolayers of cultured human polycystic cells. Am J Physiol 1995; 269: F381–F388 [DOI] [PubMed] [Google Scholar]
- 13. Nofziger C, Brown KK, Smith CD. et al. PPARγ agonists inhibit vasopressin-mediated anion transport in the MDCK-C7 cell line. Am J Physiol Renal Physiol 2009; 297: F55–F62 [DOI] [PubMed] [Google Scholar]
- 14. Blazer-Yost BL, Haydon J, Eggleston-Gulyas T. et al. Pioglitazone attenuates cystic burden in the PCK rodent model of polycystic kidney disease. PPAR Res 2010; 2010: 274376. [DOI] [PMC free article] [PubMed] [Google Scholar]
- 15. Flaig SM, Gattone VH, Blazer-Yost BL.. Inhibition of cyst growth in PCK and Wpk rat models of polycystic kidney disease with low doses of peroxisome proliferator-activated receptor γ agonists. J Transl Int Med 2016; 4: 118–126 [DOI] [PMC free article] [PubMed] [Google Scholar]
- 16. Mason SB, Liang Y, Sinders RM. et al. Disease stage characterization of hepatorenal fibrocystic pathology in the PCK rat model of ARPKD. Anat Rec 2010; 293: 1279–1288 [DOI] [PMC free article] [PubMed] [Google Scholar]
- 17. Gattone VH 2nd, Tourkow BA, Trambaugh CM. et al. Development of multiorgan pathology in the wpk rat model of polycystic kidney disease. Anat Rec 2004; 277A: 384–395 [DOI] [PubMed] [Google Scholar]
- 18. Muto S, Aiba A, Saito Y. et al. Pioglitazone improves the phenotype and molecular defects of a targeted Pkd1 mutant. Hum Mol Genet 2002; 11: 1731–1742 [DOI] [PubMed] [Google Scholar]
- 19. Brookes ZL, Ruff L, Upadhyay VS. et al. Pkd2 mesenteric vessels exhibit a primary defect in endothelium-dependent vasodilatation restored by rosiglitazone. Am J Physiol Heart Circ Physiol 2013; 304: H33–H41 [DOI] [PMC free article] [PubMed] [Google Scholar]
- 20. Torres VE, King BF, Chapman AB. et al. Magnetic resonance measurements of renal blood flow and disease progression in autosomal dominant polycystic kidney disease. Clin J Am Soc Nephrol 2007; 2: 112–120 [DOI] [PubMed] [Google Scholar]
- 21. Chapman AB. Approaches to testing new treatments in autosomal dominant polycystic kidney disease: insights from the CRISP and HALT-PKD studies. Clin J Am Soc Nephrol 2008; 3: 1197–1204 [DOI] [PubMed] [Google Scholar]
- 22. Irazabal MV, Rangel LJ, Bergstralh EJ et al.. Imaging classification of autosomal dominant polycystic kidney disease: a simple model for selecting patients for clinical trials. J Am Soc Nephrol 2015; 26: 160–172 [DOI] [PMC free article] [PubMed] [Google Scholar]
- 23. Torres VE, Chapman AB, Devuyst O. et al. Tolvaptan in patients with autosomal dominant polycystic kidney disease. N Engl J Med 2012; 367: 2407–2418 [DOI] [PMC free article] [PubMed] [Google Scholar]
- 24. Serra AL, Poster D, Kistler AD. et al. Sirolimus and kidney growth in autosomal dominant polycystic kidney disease. N Engl J Med 2010; 363: 820–829 [DOI] [PubMed] [Google Scholar]
- 25. Walz G, Budde K, Mannaa M. et al. Everolimus in patients with autosomal dominant polycystic kidney disease. N Engl J Med 2010; 363: 830–840 [DOI] [PubMed] [Google Scholar]
- 26. Ruggenenti P, Remuzzi A, Ondei P. et al. Safety and efficacy of long-acting somatostatin treatment in autosomal-dominant polycystic kidney disease. Kidney Int 2005; 68: 206–216 [DOI] [PubMed] [Google Scholar]
- 27. Nesto RW, Bell D, Bonow RO. et al. Thiazolidinedione use, fluid retention, and congestive heart failure: a consensus statement from the American Heart Association and American Diabetes Association. Diabetes Care 2004; 27: 256–263 [DOI] [PubMed] [Google Scholar]
- 28. Weir MR. Incidence of pedal edema formation with dihydropyridine calcium channel blockers: issues and practical significance. J Clin Hypertens (Greenwich) 2003; 5: 330–335 [DOI] [PMC free article] [PubMed] [Google Scholar]
- 29. Schoeller DA, Alon A, Manekas D. et al. Segmental bioimpedance for measuring amlodipine-induced pedal edema: a placebo-controlled study. Clin Ther 2012; 34: 580–592 [DOI] [PubMed] [Google Scholar]
- 30. Qayyum R, Adomaityte J.. A meta-analysis of the effect of thiazolidinediones on blood pressure. J Clin Hypertens (Greenwich) 2006; 8: 19–28 [DOI] [PMC free article] [PubMed] [Google Scholar]
- 31. Belcher G, Lambert C, Goh KL. et al. Cardiovascular effects of treatment of type 2 diabetes with pioglitazone, metformin and gliclazide. Int J Clin Pract 2004; 58: 833–837 [DOI] [PubMed] [Google Scholar]
- 32. Schrier RW, Abebe KZ, Perrone RD. et al. Blood pressure in early autosomal dominant polycystic kidney disease. N Engl J Med 2014; 371: 2255–2266 [DOI] [PMC free article] [PubMed] [Google Scholar]
- 33. Lathyris DN, Trikalinos TA, Ioannidis JP.. Evidence from crossover trials: empirical evaluation and comparison against parallel arm trials. Int J Epidemiol 2007; 36: 422–430 [DOI] [PubMed] [Google Scholar]
Associated Data
This section collects any data citations, data availability statements, or supplementary materials included in this article.