

Abstract
Purpose:
Diet is a well-established, modifiable factor influencing dental caries risk; however, evidence regarding its association with distinct clinical patterns of dental caries is lacking. We sought to identify the association of child nutrition patterns with two distinct clinical presentations (subtypes) of childhood dental caries.
Methods:
The study sample comprised 120 children who were patients of a private pediatric dental practice: 30 with anterior caries lesions ages 1-3 (mean=2.2 years); 30 with posterior-only caries lesions ages 4-12 (mean=6.0 years); and 60 age-, gender- and payment method-matched caries-free controls. Participants underwent dental examinations and their guardians completed a 17-item nutrition frequency questionnaire. A Latent Profile Analysis was used to define distinct dietary patterns and subsequently tested their association with dental caries subtypes.
Results:
Dietary patterns were differentiated by consumption frequencies of water and cariogenic solid, soft and liquid food items—a diet cluster characterized by frequent consumption of fruit juice, cereal bars, and daily vitamins was more common (P<.05) among 1-3-year-old patients with anterior caries lesions compared to matched caries-free controls.
Conclusions:
These results affirm the key role of diet patterns in childhood oral health and demonstrate the influence of fermentable carbohydrates on specific clinical subtypes of caries.
Keywords: dental caries, children, early childhood caries, diet, risk factors, latent profile analysis
Introduction
Dental caries is the most common chronic disease of children with approximately a quarter of 2-5 year-old children in the US having experienced it.1,2 The etiology of dental caries in children is multi-factorial, but it is generally understood as an imbalance between protective and causative factors leading to tooth surface demineralization.3-5 Among a large number of protective and risk-increasing factors, sugar-rich diet is the strongest and best documented, modifiable dental caries risk factor.3,6 Accordingly, the American Academy of Pediatric Dentistry (AAPD) caries risk assessment tool places children under the age of six who consume more than 3 between-meal sugar-containing snacks or beverages per day at high risk for the development of early childhood caries (ECC).7 However, there is no uniformity in this regard across risk assessment tools. For example, the American Dental Association (ADA) risk assessment tool places children under the age of six at moderate risk if they have “frequent or prolonged between meal exposures/day” and at high risk only if they had used a “bottle or sippy cup with anything other than water at bed time.”8 Moreover, “frequent … between-meal snacks of sugars/cooked starch/sugared beverages” is considered as equal to 20 additional risk factors or indicators in the CAMBRA approach.9 Another difference is that the AAPD and CAMBRA/CDA caries risk assessment tools question whether a child has greater than 3 sugar containing snacks or beverages a day between meals while the ADA tool simply asks whether a child consumes sugary foods or drinks.
Inconsistencies or variations in the quantification of sugar consumption and diet in caries risk assessment amount to conflicting information when assessing individuals’ caries propensity and creating personalized prevention plans. Moreover, it is understood that dietary items (i.e., sugar in this case) should not be considered in isolation, as individuals tend to follow dietary patterns that consist of varieties of preferred and correlated liquid and solid foods.10,11 This feature can be leveraged by the use of mixture models, i.e., latent class (LCA) and latent profile analysis (LPA). These techniques are used for the “recovery” of hidden groups in the data and are especially useful when one seeks to use a large number of variables to identify and characterize a few subgroups.12 LCA is used in analyses where input variables are categorical and LPA when variables are ordinal or continuous. Recent applications of LCA in oral health research include combinations of clinical, demographic, self-reported symptoms, and oral health behavior data.13-15 In nutrition research, the goal of mixture models is the identification of diet patterns among study participants, wherein individual food items contribute information to the emergent pattern. In other words, LCA/LPA can help classify and characterize individuals in homogeneous latent groups according to comprehensive assessments of their diet, offering an improvement in terms of clinical translation and patient care.10,16
Additional sources of heterogeneity in appreciating dietary influences on ECC are due to the disease definition itself and the timing of exposure. The recent Bangkok declaration,6 similar to the AAPD, defines ECC as the presence of any caries lesion, missing or restored (due to caries) tooth surfaces in the primary dentition of children under the age of 6. Despite the merits of this harmonized ECC taxonomy, this definition ignores important clinical features or patterns of dental caries presentation, including severity and intra-oral lesion distribution (e.g., smooth surfaces, pits and fissures, proximal surfaces, or anterior versus posterior teeth).5,17,18 This is an important point, because these parameters arguably reflect distinct etiologies (i.e., proximal lesions generally develop when interproximal spaces are closed) and possibly management pathways (e.g. occlusal versus proximal lesions). Moreover, the cariogenic influence of a sugar-rich diet is likely to differ between children of different ages (e.g., diet sources differ drastically between 2 and 6-year-olds) and clinical presentation (e.g., open versus closed posterior contacts).
There is a paucity of evidence regarding the association of distinct diet patterns or foods with specific clinical presentations of ECC or primary dentition caries. We undertook this study aiming to address this knowledge gap and augment the evidence base of the association of specific dietary items with patterns of childhood dental caries.
Methods
Study design and population
The Institutional Review Board of the University of North Carolina at Chapel Hill (#17-2530) approved this investigation. A total of 120 pediatric dental patients under the age of twelve were recruited between July 2018 and March 2019 to participate in this cross-sectional study. Eligible participants were all under 12 years old, healthy or with mild systemic disease using the American Society of Anesthesiology (ASA)-Classification System Class I or II, and met clinical criteria for one of the three study groups described below. Patients were selected in a consecutive manner from a private practice dental office in Durham, NC. They were recruited into age-stratified clinical groups designed to facilitate comparisons of primary dental caries patterns and their associated dietary contributions amongst this pediatric population. The first group (A) comprised 30 1-3-year-old children with maxillary anterior cavitated or incipient caries lesions with or without posterior lesions (refer to Figure 1). The second experimental group (B) comprised 30 4-12-year-old children with one or more posterior proximal caries lesion and no anterior caries lesion history (refer to Figure 2).19 These caries-affected patients were 1:1 age-, gender-, and payment method matched to equally sized samples of caries free controls (Table 1).
Figure 1.

Intraoral photograph representative of a group A participant (1-3-year-old children with maxillary anterior caries lesions).
Figure 2.
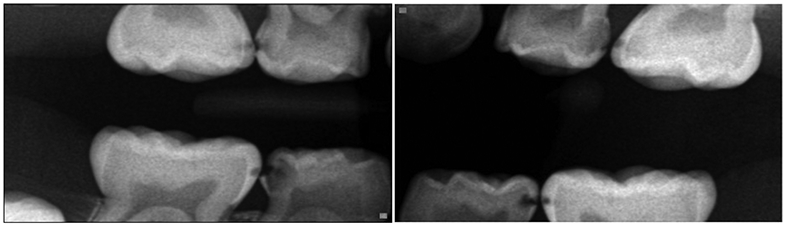
Bitewing radiographs representative of a group B participant (4-12-year-old children with posterior interproximal caries lesions and no anterior caries lesion history).
Table 1.
Sociodemographic and clinical characteristics of the 120 study participants
| Group A: 1-3-year-olds with maxillary anterior caries lesions |
Group B: 4-12-year-olds without history of maxillary anterior caries lesions |
|||
|---|---|---|---|---|
| caries cases | controls | caries cases | controls | |
| n=30 | n=30 | n=30 | n=30 | |
| mean (SD) | mean (SD) | mean (SD) | mean (SD) | |
| Child’s age (years) | 2.2 (0.6) | 2.2 (0.6) | 6.0 (1.9) | 6.0 (1.9) |
| Child’s gender | n (col. %) | n (col. %) | n (col. %) | n (col. %) |
| male | 12 (40) | 12 (40) | 14 (47) | 14 (47) |
| female | 18 (60) | 18 (60) | 16 (53) | 16 (53) |
| Child’s race/ethnicity | n (col. %) | n (col. %) | n (col. %) | n (col. %) |
| Caucasian/White | 15 (58) | 21 (72) | 20 (77) | 20 (71) |
| African American/Black | 5 (19) | 3 (10) | 2 (8) | 7 (25) |
| Asian | 2 (8) | 0 (0) | 2 (8) | 1 (4) |
| Hispanic | 4 (15) | 5 (17) | 2 (8) | 0 (0) |
| missing | 4 | 1 | 4 | 2 |
| Caries experience | mean (SD); median (range) |
mean (SD); median range |
||
| Group A: dmfs | ||||
| Group B: dmfs + DMFS | 17 (15); 12 | N/A | 13 (9); 12 | N/A |
SD: standard deviation
dmfs: decayed, missing or restored primary tooth surfaces due to caries
DMFS: decayed, missing or restored permanent tooth surfaces due to caries
To obtain information about participants’ nutritional intake, caregivers completed a dietary questionnaire including questions about the frequency of consumption of certain food items. The caregiver was defined as the guardian that coordinates the child’s dental visits and is legally responsible for them. If multiple guardians (e.g., two parents) accompanied a participant for their dental visit, the person that identified himself or herself as the one responsible for making the patient’s meals was invited to complete the dietary questionnaire. Once the dietary questionnaire was completed, a board-certified pediatric dentist (i.e., the study’s corresponding author MAK) performed the dental examination and reviewed the dental radiographs.
Data collection and study procedures
The nutritional questionnaire contained 17 items (Table 2) asking for the frequency of consumption of liquid and solid food items such as flavored water, water, cheese, cookies, etc. Although not a validated food frequency questionnaire (typically containing over 100 items), the specific 17 items used here were the most common exposures identified from a dietary analysis used in the clinic over the past 10 years, and were intended to best discriminate between liquid and solid diet items in this age group. Responses were presented on a 4-point ordinal scale (1: none, 2: one or two times per week, 3: once per day, and 4: more than twice per day). Although these response options do not provide full coverage of the available frequency intervals (e.g., one a month or 3 times per week), they were intended to represent ordinal categories of ‘never’, ‘infrequently’, ‘daily’, and ‘more than daily’. A combination of visual and visual-tactile criteria paired with periodic radiographic examination were used for the detection of caries lesions. Information obtained from the comprehensive dental examination consisted primarily of patient caries experience, caries history, age, gender, and insurance type. Information on age, gender, and insurance were used to select the matched control groups.
Table 2.
Consumption frequency distribution for the 17 examined food items among the 120 study participants and exploratory factor analysis loadings for each study sub-group (i.e., 1-3-year-olds and 4-12-year-olds).
| Food Item | None | 1-2/Week | 1/Day | ≥2/Day | Factor loadings* | |
|---|---|---|---|---|---|---|
| n (row %) | n (row %) | n (row %) | n (row %) | 1-3-year- olds |
4-12-year- olds |
|
| Flavored Water | 88 (73) | 10 (8) | 12 (10) | 10 (8) | 0.54 | 0.53 |
| Soda/Sweet Tea | 81 (67) | 25 (21) | 11 (9) | 3 (3) | <0.40 | 0.66 |
| Fruit Juice | 48 (41) | 29 (25) | 32 (27) | 9 (8) | 0.61 | 0.58 |
| Sports and Energy Drinks | 96 (81) | 16 (1) | 5 (4) | 2 (2) | <0.40 | 0.57 |
| Milk (Cow's milk, yogurt, shakes, etc.) | 10 (8) | 19 (16) | 44 (37) | 47 (39) | <0.40 | 0.55 |
| Water | 3 (3) | 8 (7) | 22 (18) | 87 (72) | 0.63 | 0.48 |
| Bread/Noodles/Rice | 2 (2) | 24 (20) | 51 (44) | 40 (34) | <0.40 | <0.40 |
| Cheese | 10 (8) | 39 (33) | 55 (46) | 15 (13) | <0.40 | <0.40 |
| Cookies | 33 (28) | 58 (49) | 24 (20) | 4 (3) | 0.60 | 0.41 |
| Gummy or Chewable Vitamins | 76 (64) | 12 (10) | 28 (23) | 3 (3) | 0.51 | 0.42 |
| Candy | 27 (23) | 71 (60) | 19 (16) | 1 (1) | 0.51 | <0.40 |
| Chewing gum (sugar free) | 85 (71) | 25 (21) | 8 (7) | 1 (1) | <0.40 | <0.40 |
| Dried fruit/Fruit Snacks/Fruit rollups/Fruit chews | 68 (57) | 33 (27) | 14 (12) | 5 (4) | <0.40 | 0.51 |
| Meats (red meat, poultry, fish) | 4 (3) | 32 (27) | 49 (41) | 34 (29) | <0.40 | <0.40 |
| Cereal/Granola Bars | 49 (41) | 37 (31) | 31 (26) | 3 (3) | 0.57 | 0.59 |
| Dry Cereal/Chips/Crackers (Goldfish, Cheese-it) | 3 (3) | 27 (22) | 54 (45) | 36 (30) | 0.40 | 0.43 |
| Fresh Fruit | 3 (3) | 10 (8) | 42 (35) | 65 (54) | 0.58 | <0.40 |
items with factor loadings <0.40 were considered as not contributing information to the construct of dietary patterns for further age-specific analysis and thus were excluded from the EFA, and not included in the LPA. Loadings with boldface indicate items that were retained and carried forward to age-specific LPA.
Analytical approach
Descriptive methods (e.g., counts, frequencies and means) were used for initial data presentation and exploration of the distribution of food item frequencies. We used the dietary frequency questionnaire information and conducted an age-group-specific latent profile analysis (LPA) to identify sub-groups of children with distinct and homogeneous dietary patterns. To accomplish this, we first conducted an exploratory factor analysis (EFA), a statistical technique used to study the underlying structure of a large set of variables when there is no a priori hypothesis about the latent factors or patterns within the data. Specifically, in this study EFA was used to identify sets of items that adequately represented the construct of dietary patterns in each age group by excluding items that would be non-informative in the young or the older age groups. In this selection process, we retained food items with factor loadings ≥0.4 (i.e., displaying commonality with an underlying pattern), and presumed clinical relevance; 9 items were retained in the 1-3 age group and 11 items were retained for the 4-12 age group (Table 2).
Age-group-specific LPA was then carried out for each age group using the items retained in the EFA. The identification of the optimal number of latent profiles (i.e., dietary classes, patterns, or groups) was based on information-heuristic measures of model selection such as the Akaike Information Criterion, Bayesian Information Criterion, Vuong-Lo-Mendell Rubin test and the bootstrapped Likelihood Ratio test. Once a final, optimally fitting model was selected, dietary item class-specific means were exported and plotted as a means of illustrating specific differences between the identified clusters of participants, as identified by their distinct diet patterns. Finally, participants’ dietary pattern (i.e., latent class) memberships were carried forward to bivariate association testing between dental caries cases and controls using chi-square/Fisher’s exact tests and a conventional P<.05 statistical significance criterion. Descriptive statistics, EFA, association analyses, and figure creation were done using Stata 16.1 (StataCorp LP, College Station, TX, USA), and LPA was done using with Mplus 8.4 (Muthén & Muthén, Los Angeles, USA).
Results
The median ages of group A (i.e., 1-3-year-old) participants and matched controls (57% females), and group B (i.e., 4-12-year-old) participants and matched controls (53% females) were 2.2 and 6.0 years, respectively. Among the entire study sample, milk, water, bread, noodles or rice, cheese, cookies, meats, dry cereal, chips, crackers, and fresh fruit were the most frequently consumed food items (Table 2). Several items were excluded from further analyses due to insufficient ‘loading’ in age group-specific factors; e.g., soda/sweet tea and sports/energy drinks for the 1-3-age group, candy and fresh fruit for the 4-12-year-old group, and bread/noodles/rice, cheese, and meats for both groups. The subsequent age-stratified LPA included 9 and 11 food items for the 1-3 and the 4-12-year-old groups, respectively. This analysis revealed two dietary patterns among the young and three among the older participants that are described further below.
The mean dietary item frequencies for each class and age group are presented in the profile plots shown in Figure 3. The identified dietary patterns or classes were differentiated by a few clinically important food items. Specifically, among 1-3-year-olds, class 1 (which we consider the ‘healthier’ pattern) included a mixed diet with high consumption of water, fresh fruit snacks, and low consumption of gummy or chewable vitamins; in comparison, class 2 was characterized by higher consumption of vitamins, fruit juice, and cereal bars (Figure 3a). In the older age group, differences between dietary patterns were mainly driven by liquids. Class 1 included again the ‘healthier’ dietary pattern characterized by high consumption of water and the lowest consumption of juice. Class 2 was somewhat lower on water but higher on fruit juice and flavored water (Figure 3b). Class 3 was characterized by high sweet tea consumption (i.e., reported daily use), fruit juice, and energy drinks. Smaller differences were noted for other items (e.g., fruit snacks and cereal bars).
Figure 3.

Distribution of dietary patterns and corresponding mean frequencies of the most discriminant food items in the Latent Profile Analysis in 1-3-year-old (panel a) and 4-12-year-old children (panel b).
In terms of associations with dental caries, class 1, being the ‘healthier’ dietary pattern, was more common among controls versus cases for both age groups (Table 2), albeit most important for the young age group. Class 2, the cariogenic pattern among the younger group (A, 1-3-year-olds) was more common among children with dental caries (P=.01) compared to controls. Similarly, class 3, the most cariogenic pattern in the older group (B, 4-12-year-olds) was more common among children with dental caries (17%) compared to controls (7%) but this difference was not statistically significant (P=.61).
Discussion
This study examined children’s diet patterns and their association with subtypes of childhood caries in a sample of 120 private dental clinic patients. We identified healthier, caries-protective, and unfavorable, caries-promoting diet patterns that were mainly differentiated by consumption frequencies of water and cariogenic solid, soft, and liquid food items. We found a cariogenic dietary pattern that was most common among young children with maxillary anterior caries lesions compared to age-matched caries-free controls. A similar trend of higher frequency of cariogenic diet was noted for older children with posterior but not maxillary anterior lesions compared to their age-matched controls, but this association was not statistically significant. The results provide new insights into diet patterns that may be associated with distinct patterns of childhood caries. Upon validation and replication in other pediatric samples and populations, information on these clusters can contribute to a systematic classification of diet patterns as they pertain to early childhood oral health.
Although there are no previous studies investigating the development of latent diet patterns in the context of early childhood caries, this study’s identified diet clusters were differentiated by known cariogenic foods and beverages. Fruit juice, cereal bars, sweet tea, and energy drinks are all known to be rich in sugars and have been linked to dental caries.20-24 Cereal bar consumption, recognized as a significant component of “class 1” and identified as an associated cariogenic pattern in the younger age group in our study, may have been consumed in an attempt to establish a healthier diet (avoiding foods such as candy). Perhaps, if these children were followed prospectively, a cariogenic effect would be observed with masticating cariogenic foods such as granola bars. Daily vitamin supplementation was a strong feature of the cariogenic diet cluster (“class 2”) in the sample of 1-3-year-olds—this finding could be explained by the cariogenic nature of certain child vitamin formulations. The first two ingredients in most child vitamins is glucose syrup and sugar. The gummy nature of many child vitamins may also be a contributing factor. It also noteworthy that vitamins, fruit juice, and cereal bars can be considered to be ‘healthy’ options by some parents, while in reality they are cariogenic due to their sugar content.
Developing an understanding of the structure of the identified diet clusters is key and becomes evident upon inspection of the cariogenic cluster (i.e., “class 3”) among 4-12-year-olds; individuals who consumed at least daily sweet tea, also reported the highest frequency of fruit juice and energy drinks consumption—all sugar-rich beverages. This clustering is an important finding and underscores the utility of identifying and intervening on diet patterns versus individual diet items. At the same time, ‘regular’ water was less frequently consumed in the cluster of 4-12-year-olds than consumption of flavored water—however, this pattern was not associated with dental caries.
Diet is a central piece of pediatric health and its importance in childhood oral and general health cannot be overemphasized. The Healthy Eating Research (HER) guidelines include specific guidance and nutritional best practices for infant and toddler feeding.25 The American Heart Association (AHA) recently published guidelines about sugar intake that detail that children between the ages of 2 and 18 should have less than 25 grams (or 6 teaspoons) of added sugars daily.26 In parallel, the Food and Drug Administration (FDA) has issued a directive for the food industry to comply with and use new revised nutrition fact labels that disclose an “added sugar” content.27 The 2020 Dietary Guidelines Advisory Committee recommends that parents should refrain from giving any foods with added sugar to children through age 2.28 Given the importance of sugar for caries development, these recommendations are of importance and great relevance to pediatric dentistry.
The results of this study should be interpreted while acknowledging its limitations. First, the 17 diet items were not a validated food frequency questionnaire or a 24-hour recall, and parental recall bias when completing the questionnaire could hamper the precision of the obtained results. Nevertheless, the questionnaire survey captured mean consumption frequencies for a wide range of solid, soft, and liquid food items of potential relevance of early childhood caries development. Second, due to its cross-sectional nature among caries-affected cases and matched controls, and the concurrent assessment of diet and clinical status, the study cannot make direct inferences regarding caries risk. We support that without a systematic intervention, diet habits and the observed patterns are unlikely to change from cariogenic to non-cariogenic during the first few years of life. Because our study compared age-matched cases and controls, any such diet changes are unlikely to vary substantially between cases and controls.
Conclusions
We found a strong association between diet containing fruit juice, cereal bars, and vitamins and early childhood caries involving the maxillary anterior teeth in a pediatric dental clinic sample of 1-3-year-old children.
Children with posterior caries lesions and no history of anterior caries lesions consumed sweet tea, sports/energy drinks, and fruit juice more frequently than, matched, caries-free controls, but this difference was not statistically confirmed.
Table 3.
Association between-diet patterns (identified via latent profile analysis) and dental caries among the two study groups (i.e., 1-3-year-olds with maxillary anterior caries lesions versus caries-free controls and 4-12-year-olds without history of maxillary anterior caries lesions versus caries-free controls).
| Group A: 1-3-year-olds with maxillary anterior caries lesions |
|||||
|---|---|---|---|---|---|
| 1-3-year-old diet patterns |
entire sample |
caries cases |
controls | ||
| n | % | n (%) | n (%) | P* | |
| Class 1 “health-associated” | 39 | 65 | 15 (50) | 24 (80) | 0.01 |
| Class 2 “vitamins, fruit juice, cereal bars” | 21 | 35 | 15 (50) | 6 (20) | |
| Group B: 4-12-year-olds without history of maxillary anterior caries lesions | |||||
| 4-12-year-old diet patterns |
entire sample |
caries cases |
controls | ||
| n | % | n (%) | n (%) | P§ | |
| Class 1 “health-associated” | 41 | 68 | 19 (63) | 22 (73) | 0.61 |
| Class 2 “fruit juice, flavored water” | 12 | 20 | 6 (20) | 6 (20) | |
| Class 3 “sweet tea” | 7 | 12 | 5 (17) | 2 (7) | |
: obtained from χ2 test
: obtained from Fisher’s exact test
Acknowledgements
Drs. Simancas-Pallares, Divaris, and Zandona acknowledge partial support from NIH/NIDCR grant U10DE025046.
References
- 1.Casamassimo PS, Thikkurissy S, Edelstein B, Mairoini E. Beyond the dmft. The human and economic cost of early childhood caries. J Am Dent Assoc 2009;140;650–7. [DOI] [PubMed] [Google Scholar]
- 2.Dye BA, Thornton-Evans G, Li X, Iafolla TJ. Dental Caries and Sealant Prevalence in Children and Adolescents in the United States, 2011-2012. NCHS data brief no 191. Hyattsville, MD: National Center for Health Statistics. 2015 [PubMed] [Google Scholar]
- 3.Pitts NB, Zero DT, Marsh PD, et al. Dental caries. Nature Reviews Disease Primers. 2017. May 25;3(1):1–6. [DOI] [PubMed] [Google Scholar]
- 4.Featherstone JD. The continuum of dental caries--evidence for a dynamic disease process. J Dent Res. 2004;83 Spec No C:C39–42. [DOI] [PubMed] [Google Scholar]
- 5.Divaris K Predicting Dental Caries Outcomes in Children: A "Risky" Concept. J Dent Res. 2016. March;95(3):248–54. [DOI] [PMC free article] [PubMed] [Google Scholar]
- 6.Pitts NB, Baez RJ, Diaz-Guillory C, et al. Early Childhood Caries: IAPD Bangkok Declaration. J Dent Child (Chic). 2019. May 15;86(2):72. [PubMed] [Google Scholar]
- 7.American Academy of Pediatric Dentistry. Best practices: Caries-risk assessment and management for infants, children, and adolescents. The Reference Manual of Pediatric Dentistry. Chicago, IL: American Academy of Pediatric Dentistry; 2019:220. [Google Scholar]
- 8.American Dental Association. Caries Risk Assessment Form (Age 0-6). 2009, 2011 [Google Scholar]
- 9.Featherstone JD, Domejean-Orliaguet S, Jenson L, Wolff M, Young DA. Caries risk assessment in practice for age 6 through adult. J Calif Dent Assoc. 2007. October;35(10):703–7, 710-3. [PubMed] [Google Scholar]
- 10.Smithers LG, Brazionis L, Golley RK, et al. Associations between dietary patterns at 6 and 15 months of age and sociodemographic factors. Eur J Clin Nutr. 2012. June;66(6):658–66. [DOI] [PubMed] [Google Scholar]
- 11.Pitt E, Cameron CM, Thornton L, et al. Dietary patterns of Australian children at three and five years of age and their changes over time: A latent class and latent transition analysis. Appetite. 2018. October 1;129:207–16. [DOI] [PubMed] [Google Scholar]
- 12.Oberski D Mixture models: Latent profile and latent class analysis. In: Modern statistical methods for HCI 2016. (pp. 275–287). Springer, Cham. [Google Scholar]
- 13.Sánchez-García S, Heredia-Ponce E, Cruz-Hervert P, Juárez-Cedillo T, Cárdenas-Bahena A, García-Peña C. Oral health status in older adults with social security in Mexico City: Latent class analysis. J Clin Exp Dent. 2014. February 1;6(1):e29–35. [DOI] [PMC free article] [PubMed] [Google Scholar]
- 14.Ortíz-Barrios LB, Granados-García V, Cruz-Hervert P, Moreno-Tamayo K, Heredia-Ponce E, Sánchez-García S. The impact of poor oral health on the oral health-related quality of life (OHRQoL) in older adults: the oral health status through a latent class analysis. BMC Oral Health. 2019. July 10; 19(1): 141. [DOI] [PMC free article] [PubMed] [Google Scholar]
- 15.Al-Sudani FY, Vehkalahti MM, Suominen AL. Association of current employment status with oral health-related behaviors: findings from the Finnish Health 2000 Survey. Eur J Oral Sci. 2016. August; 124(4):368–76. [DOI] [PubMed] [Google Scholar]
- 16.Huh J, Riggs NR, Spruijt-Metz D, Chou CP, Huang Z, Pentz M. Identifying patterns of eating and physical activity in children: a latent class analysis of obesity risk. Obesity. 2011. March; 19(3):652–8. [DOI] [PMC free article] [PubMed] [Google Scholar]
- 17.Psoter WJ, Morse DE, Pendrys DG, Zhang H, Mayne ST. Historical evolution of primary dentition caries pattern definitions. Pediatr Dent. 2004. Nov-Dec;26(6):508–11. [PubMed] [Google Scholar]
- 18.Psoter WJ, Zhang H, Pendrys DG, Morse DE, Mayne ST. Classification of dental caries patterns in the primary dentition: a multidimensional scaling analysis. Community Dent Oral Epidemiol. 2003. June;31(3):231–8. [DOI] [PubMed] [Google Scholar]
- 19.Keels MA. Personalized Dental Caries Management in Children. Dent Clin North Am. 2019. October;63(4):621–9. [DOI] [PubMed] [Google Scholar]
- 20.Evans EW, Hayes C, Palmer CA, Bermudez OI, Cohen SA, Must A. Dietary intake and severe early childhood caries in low-income, young children. J Acad Nutr Diet. 2013. August;113(8):1057–61. [DOI] [PMC free article] [PubMed] [Google Scholar]
- 21.Hu S, Sim YF, Toh JY, et al. Infant dietary patterns and early childhood caries in a multi-ethnic Asian cohort. Sci Rep. 2019. January 29;9(1):852. [DOI] [PMC free article] [PubMed] [Google Scholar]
- 22.Warren JJ, Blanchette D, Dawson DV, et al. Factors associated with dental caries in a group of American Indian children at age 36 months. Community Dent Oral Epidemiol. 2016. April;44(2):154–61. [DOI] [PMC free article] [PubMed] [Google Scholar]
- 23.Hashim R, Williams SM, Murray Thomson W. Diet and caries experience among preschool children in Ajman, United Arab Emirates. Eur J Oral Sci. 2009. December;117(6):734–40 [DOI] [PubMed] [Google Scholar]
- 24.Chaffee BW, Feldens CA, Rodrigues PH, Vitolo MR. Feeding practices in infancy associated with caries incidence in early childhood. Community Dent Oral Epidemiol. 2015. August;43(4):338–48. [DOI] [PMC free article] [PubMed] [Google Scholar]
- 25.Pérez-Escamilla R, Segura-Pérez S, Lott M, on behalf of the RWJF HER Expert Panel on Best Practices for Promoting Healthy Nutrition, Feeding Patterns, and Weight Status for Infants and Toddlers from Birth to 24 Months. Feeding Guidelines for Infants and Young Toddlers: A Responsive Parenting Approach. Guidelines for Health Professionals. Durham, NC: Healthy Eating Research, 2017. http://healthyeatingresearch.org/wp-content/uploads/2017/02/her_feeding_guidelines_report_021416-1.pdf [Google Scholar]
- 26.Vos MB, Kaar JL, Welsh JA, et al. ; American Heart Association Nutrition Committee of the Council on Lifestyle and Cardiometabolic Health; Council on Clinical Cardiology; Council on Cardiovascular Disease in the Young; Council on Cardiovascular and Stroke Nursing; Council on Epidemiology and Prevention; Council on Functional Genomics and Translational Biology; and Council on Hypertension. Added Sugars and Cardiovascular Disease Risk in Children: A Scientific Statement From the American Heart Association. Circulation. 2017. May 9:135(19):e1017–34 [DOI] [PMC free article] [PubMed] [Google Scholar]
- 27.Malik VS, Willett WC, Hu FB. The Revised Nutrition Facts Label: A Step Forward and More Room for Improvement. JAMA. 2016. August 9;316(6):583–4. [DOI] [PMC free article] [PubMed] [Google Scholar]
- 28.U.S. Department of Health and Human Services and U.S. Department of Agriculture. 2015–2020 Dietary Guidelines for Americans. 8th Edition. December 2015. Available at http://health.gov/dietaryguidelines/2015/guidelines/ [Google Scholar]