

Abstract
Scope
Infant formula (IF) uses besides vegetable fats also bovine milk fat, which differs in triacylglycerol (TAG) structure. Furthermore, it differs in fatty acid (FA) composition. Whether changing fat source in IF affects postprandial energy metabolism, lipemic response, and blood lipid profile is unknown.
Methods and Results
A proof‐of‐principle study, with a randomized controlled double‐blind cross‐over design, is conducted. Twenty healthy male adults consumed drinks with either 100% vegetable fat (VEG) or 67% bovine milk fat and 33% vegetable fat (BOV), on 2 separate days. For a detailed insight in the postprandial responses, indirect calorimetry is performed continuously, and venous blood samples are taken every 30 min, until 5 h postprandially. No differences in postprandial energy metabolism, serum lipids, lipoprotein, or chylomicron concentrations are observed between drinks. After consumption of VEG‐drink, C18:2n‐6 in serum increased. Observed differences in chylomicron FA profile reflect differences in initial FA profile of test drinks. Serum ketone bodies concentrations increase following consumption of BOV‐drink.
Conclusions
The use of bovine milk fat in IF does neither affect postprandial energy metabolism nor lipemic response in healthy adults, but alters postprandial FA profiles and ketone metabolism. Whether the exact same effects occur in infants requires experimental verification.
Keywords: bovine milk fat, chylomicrons, infant formula, metabolism, lipidomics
To study the effects of different fat sources in infant formula on energy and lipid metabolism, a proof‐of‐principle study with young adults is conducted. Replacing 67% of vegetable fat in infant formula with bovine milk fat did not affect postprandial energy metabolism nor the lipemic response, the initial difference in fatty acid profile of the formulas is reflected in the chylomicrons, and serum ketone bodies increase with consumption of bovine milk fat. Whether the exact same effects occur in infants requires experimental verification.

1. Introduction
Fat is an important component of infant formula (IF), delivering about 50% of required energy to an infant.[ 1 ] Fat blends for IF are designed to mimic the fatty acid (FA) composition of human milk, usually containing a mixture of vegetable fats, e.g., palm oil, (high‐oleic) sunflower oil, and coconut oil.[ 2 ] Animal sources, such as bovine milk fat, are also used.[ 3 ] Bovine milk fat is added because of its triacylglycerol (TAG) structure, since TAGs of bovine milk fat contain more long‐chain saturated FAs (LCSFA) on the sn‐2 position compared to vegetable fat.[ 2 ] This results in less fatty acid soap formation in the lumen, and thereby less fecal fat and calcium excretion.[ 4 ] Besides a different positioning of FAs on the glycerol backbone, vegetable fat and bovine milk fat also differ in FA composition.[ 2 ] When using bovine milk fat, a wider variety of FAs is introduced into IF, compared to the use of vegetable fats only. The level of saturated FA (SFA), including short‐ and medium‐chain FA (SCFA, MCFA), increases, and the level of monounsaturated FA (MUFA) slightly decreases.[ 2 ]
The type of FA is known to affect energy metabolism, for example, consumption of medium‐chain triglycerides has been shown to increase energy expenditure and fat oxidation in adults, when compared to long‐chain triglycerides.[ 5 , 6 , 7 ] Furthermore, FA type affects the postprandial rise in circulating TAG‐containing lipoproteins; the lipemic response.[ 8 , 9 , 10 ] Postprandial lipemic responses have gained strong interest, since a prolonged or elevated postprandial lipemic response, hypertriglyceridemia, is associated with increased metabolic disease risk, including risk for cardiovascular diseases.[ 11 , 12 ] This lipemic response is largely caused by chylomicron production[ 8 ], which is influenced by endogenous (e.g., genetic variation), as well as exogenous factors, such as food components.[ 13 ] Despite conflicting findings, lipemic response is believed to be highest for SFA, followed by MUFA, n‐6 poly‐unsaturated fatty acids (PUFA), and lowest for n‐3 PUFA.[ 8 , 14 ]
Besides FA composition, the structure of fat might also affect the postprandial response. A clinical trial showed that positioning of LCSFA at the sn‐2 position, instead of the sn‐1 and sn‐3 positions of a TAG, resulted in higher levels of apolipoprotein‐B in infants, indicating higher concentrations of chylomicrons and lipoproteins.[ 10 ] Based on these results, it may be hypothesized that partial replacement of vegetable fat in infant formulas by bovine milk fat may increase postprandial energy metabolism and the lipemic response. Whether this is indeed the case is, however, unknown.
To reach the minimum preferred level of linoleic acid (C18:2n‐6), a maximum of 67% of bovine milk can be introduced in IF, which has to be mixed with vegetable fats. Therefore, in this study, we examined whether an IF containing 67% bovine milk fat and 33% vegetable fats differs in postprandial lipemic response compared to an IF containing 100% vegetable fats. Since invasive blood sampling, which is precluded in infants, is needed to study the lipemic response, we conducted a proof‐of‐principle study with healthy male adults. Comprehensive analyses of serum samples and chylomicron‐rich fraction (CMRF) of plasma samples were performed to obtain a unique, detailed view of the postprandial lipemic response in time.
2. Experimental Section
2.1. Study Ethics
This intervention study, with acronym MELC, was performed at the Human Research Unit of Wageningen University, approved by the Medical Ethics Committee of Wageningen University, and conducted according to the declaration of Helsinki. The trial has been registered at the Netherlands Trial Register (NL6896). Written and oral information was provided to the volunteers. All subjects gave an informed written consent before enrolment.
2.2. Subjects
Twenty healthy Caucasian males, mean age of 21.4 years, with a healthy body weight (75.9 ± 8.3 kg) and BMI (22.5 ± 1.6 kg m‐2) were included in the study. Baseline subject characteristics are presented in Table S 1 (Supporting Information). The exclusion criteria were claustrophobia, (symptoms of) lactose intolerance or cow's milk allergy, known metabolic diseases, autoimmune diseases, gastrointestinal diseases, cardiovascular diseases, smoking, vegetarians, >5 h of strenuous exercise [>6.0 metabolic equivalents of task (METs)] per week, excessive alcohol consumption (>21 glasses per week), and blood donation during the 2 months before the study.
2.3. Study Design
The MELC study was a double‐blind, randomized, cross‐over trial, in which two test drinks were compared on separate test days with a wash‐out period of at least 1 week. Subjects were restricted from exercise, use of alcohol, and recreational drugs on the day prior to a test day. A standardized dinner was consumed (2443 kJ, 15 g fat, 64 g carbohydrates, 43 g protein), followed by an overnight fast of 12 h. After transportation by car to the research unit, an indwelling venous catheter was placed, and participants lied down on a bed for at least 30 min prior to the start of the measurements to ensure a rested state. Thereafter, indirect calorimetry was performed using a ventilated hood system, for determinations of resting metabolic rate. After blood sampling to determine baseline concentrations of outcome parameters, subjects consumed one of the two test drinks (time point: 0 min). The order of the test drinks was randomized by a random sequence generator. After consumption, participants were placed under the ventilated hood again and exhaled air measurements continued for 5 h. Every 30 min blood samples were taken. At 150 min after test drink consumption, subjects received a glass of water and were allowed a toilet break. During the 5 hours, participants were allowed to watch television, and were instructed to lie down as still as possible.
2.4. Test Drinks
IF basepowders (FrieslandCampina, the Netherlands) were used to produce the test drinks. The test drinks were iso‐energetic and equal in nutrient composition, with about 50 en% from fat, 42 en% from carbohydrates, and 8 en% from protein (Table S 2, Supporting Information). The fat source differed between the test drinks; one contained a fat blend of vegetable fats only (VEG), the other one contained a fat blend of 67% anhydrous bovine milk fat and 33% vegetable fats (BOV). The FA profile was determined by conversion of FAs into methyl esters followed by capillary gas chromatography (NEN‐ISO 15884 and 15885) (Table 1 ). To correct for individual differences in energy expenditure of the participants, the total amount of test drink to be consumed was similar to 30% of the estimated total energy expenditure of the participants, calculated using the Harris‐Benedict equation[ 15 ] and a physical activity level of 1.75.
Table 1.
Fatty acid composition of the two test drinks (in % of total FAMEs)
| VEG‐ test drink | BOV‐test drink | |
|---|---|---|
| C4:0 | <0.1 | 2.6 |
| C6:0 | <0.1 | 1.6 |
| C8:0 | 0.6 | 1.2 |
| C10:0 | 0.5 | 2.1 |
| C11:0 | <0.1 | 0.3 |
| C12:0 | 7.0 | 4.3 |
| C14:0 | 3.0 | 8.2 |
| C14:1n‐5 | <0.1 | 0.7 |
| C15:0 | <0.1 | 0.7 |
| C16:0 | 24.7 | 22.8 |
| C16:1n‐7 | 0.2 | 1.1 |
| C18:0 | 3.1 | 7.1 |
| C18:1 trans | <0.1 | 1.1 |
| C18:1n‐9 | 42.3 | 25.9 |
| C18:1n‐7 | 1.6 | 1.1 |
| C18:2 n‐6 | 12.9 | 12.0 |
| C18:3 n‐3 | 1.8 | 1.4 |
| C18:3n‐6 | 0.1 | <0.1 |
| C20:0 | 0.3 | 0.2 |
| C20:1n‐9 | 0.5 | 0.2 |
| Total SFA | 39.6 | 51.1 |
| Total MUFA | 44.8 | 30.1 |
| Total PUFA | 14.8 | 13.5 |
2.5. Indirect Calorimetry
Concentrations of O2 and CO2 were determined in exhaled air by indirect calorimetry (MAX‐II Metabolic System, AEI technologies Inc, USA). Every 30 s, a measurement was performed. Energy expenditure was calculated using the equations of Weir.[ 16 ] Measurements were performed at 22.8 ± 0.7 °C. Resting metabolic rate was determined in fasted state, after 30 min of rest, for 10 min. The average of the last 5 min of this measurement was used to calculate resting energy expenditure. Diet‐induced thermogenesis (DIT) was calculated by subtracting resting energy expenditure from the energy expenditure that was measured after consumption of the drinks. Averages of DIT were calculated per 30 min, and expressed in kcal min‐1. Non‐protein fat and glucose oxidation rates were calculated according to Péronnet & Massicotte[ 17 ], and averaged per 30 min.
At time points ‐2, 60, 120, 180, 240, and 300 min exhaled air was sampled into Tedlar sample bags, via a sampling device coupled to the MAX‐II Metabolic system. Concentrations of m/z 59 (acetone) were determined via PTR‐MS (Ionicon Analytik, Austria).
2.6. Blood Analysis
Blood was sampled into sterile vacutainers, containing coagulation activators (serum), or EDTA (plasma). After inverting the tubes ten times, plasma samples were centrifuged immediately (1200 x g, 10 min, 4°C), serum samples were left at room temperature for 60 minutes to clot and centrifuged (1200 x g, 10 min, RT). Aliquots of serum were stored at ‐80°C until further analysis. Concentrations and compositions of different lipoprotein subclasses, apolipoproteins, and ketone bodies were analyzed in serum samples of all time points by a metabolomics platform using nuclear magnetic resonance (NMR) spectroscopy.[ 18 ]
2.7. Isolation and Analysis of Chylomicron‐Rich Fraction of Plasma
Plasma was used for the isolation of the CMRF. Four milliliter of plasma was carefully overlaid with 8 mL of demineralized water and centrifuged for 180 min at 22 500 rpm, at 21°C (Beckmann Avanti J‐25, rotor JA 25.50). The upper layer, the CMRF, was separated, snap frozen and stored at ‐80°C until analysis. Analysis of TAG and FAs in the CMRF were performed as described[ 19 ]. Briefly, total lipid was extracted from 0.1 mL of CMRF by the method of Folch et al.[ 20 ] using dichloromethane instead of chloroform.[ 21 ] Nonadecanoic acid ethyl ester (NuCheck Prep, USA) was added as internal standard to each sample before extraction. Samples were transmethylated to FA methyl esters (FAME). Chromatographic analyses were performed with a Trace‐GC gas chromatograph combined with AS 2000 autosampler (Thermo‐Finnigan, USA), equipped with a capillary split/splitless injector and a flame ionization detector. Analyses of FAME were performed on a fused‐silica capillary column coated with chemically bound stationary phase DB‐23 (60 m, 0.25 mm I.D., film thickness 0.25 um) (Agilent Technologies, USA). The oven temperature was programmed: 100°C isothermal for 2 min, then to 180°C at 10°C min‐1, isothermal for 25 min, then to 250°C at 8°C min‐1, where it was maintained for 15 min. The injector and detector temperatures were set at 250°C and 270°C, respectively. Hydrogen carrier gas was maintained at a head pressure of 80 kPa and total flow of 30.6 mL min‐1, with a split flow 20 mL min‐1 and splitless time 0.25 min. Integration software Clarity version 2.4.1.57 (Data Apex Ltd. Prague, Czech Rep.) was used for data acquisition and handling. TAG concentrations were determined with an analyzer UNICEL DxC 880i (Beckman Coulter, USA), using reaction set for TAGs (Cat. Nr. 445850, Beckman Coulter, USA).
To measure the CMRF particle size, samples were thawed in a water bath at 40°C, and diluted 1:1 with 0.01M PBS. Particle size distribution was determined by dynamic light scattering at 40°C with a Zetasizer Nano ZS (Malvern Pananalytics, United Kingdom), refractive index of 1.33.
2.8. Statistical Analyses
One participant was excluded from analyses due to non‐compliance of dietary restrictions. CMRF samples of one participant were lost during isolation. Means of DIT, fat, and glucose oxidation were calculated per 30 min.
For NMR metabolite analysis, measurement values under the detection limit were removed and baseline values (metabolite concentration at t = 0) were subtracted from values at every time point. A linear mixed‐effects modelling (LMM) framework was used to estimate trajectories of the metabolite concentrations as a function of time after ingestion of the test drinks. These mixed‐effects models accounted for repeated measurements on the same individuals. Linear, quadratic, and cubic time terms were included in the models where appropriate, to allow for the nonlinearity observed over time in the metabolite levels. The appropriate degree of the time terms was selected for every metabolite based on the best fitting model as given by the Akaike Information Criterion. Models screened for the appropriate degree of time terms can be seen in Table S3 (Supporting Information). Once the degree of the time terms was established, the interaction term between the type of test drink and the previously identified time terms were included to examine differences in metabolite trajectories by test drink (Table S4, Supporting Information) with the VEG‐test drink used as the reference. The estimate of interest is the joint effect of the interaction between type of test drink with the time terms in the model, indicating whether the profile (shape) of the time courses differ by test drink or not. The significance of this effect was tested via an F‐test on the full polynomial structure (e.g., in case of a quadratic model the interaction of treatment with time and with time2). We performed Benjamini‐Hochberg multiple testing correction to control the false discovery rate (FDR). The metabolite models are summarized in Table S4 (Supporting Information) with the joint F‐test and corresponding significance on the estimates of interest in column poly(time)*TD. Significance threshold was set to be 0.05, FDR corrected P‐values are reported in the results.
In all mixed‐effects models, the covariance matrix of the residuals was modelled by an unstructured matrix and model parameters were estimated using restricted maximum likelihood estimation. All mixed‐effects models were implemented in the NLME (non‐linear mixed‐effects) package[ 22 ] in R (version 3.3.3, The R foundation for Statistical Computing, http://www.r‐project.org/)[ 23 ]. The same analyses were applied to the indirect calorimetry data and the measurements in CRMF regarding chylomicron concentration, size, and biochemical composition.
As a clear peak was observed for the ketone bodies, an additional peak analysis was performed for these metabolites. The highest peak, corrected for baseline values, was compared between the test drinks with the non‐parametric Wilcoxon rank test, using GraphPad Prism (version 5.04, GraphPad Software Inc, USA). Differences were considered to be significant when P‐values were below 0.05.
3. Results
3.1. Postprandial Energy Metabolism
Energy expenditure increased after consumption of the test drinks, as depicted in Figure 1A. No significant difference was found between the shape of the DIT trajectories by treatment via the LMM (p = 0.80). No differences in the estimates of interest were found for non‐protein fat oxidation and glucose oxidation between the test drinks (p = 0.91 and p = 0.91, respectively, Figure 1B‐C). During the first 30 min, an increase in fat oxidation and concomitant decrease in glucose oxidation could be observed. Thereafter, fat oxidation decreased and stabilized from about 150 min postprandially onwards. Glucose oxidation increased from 30 to 90 min, and then gradually returned towards baseline.
Figure 1.
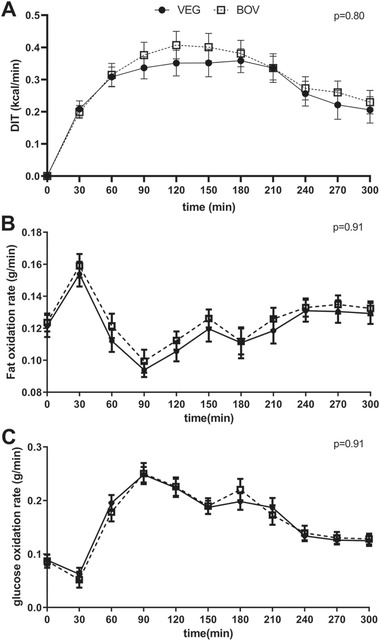
Diet‐induced thermogenesis (DIT) and substrate oxidation after consumption of test drink containing either 100% vegetable fat (VEG‐test drink) or a mixture of 67% bovine milk fat with 33% vegetable fat (BOV‐test drink) (mean ± SEM, n = 19). The black circles (●) represent the VEG‐test drink, the open squares (□) represent the BOV‐test drink. The LMM did not reveal significant differences between the test drinks with respect to the time courses of A) DIT, B) Fat oxidation rate, and C) Glucose oxidation rate (respectively p = 0.80, p = 0.91, and p = 0.91).
3.2. Serum Lipids
After consumption of the test drinks, an increase in serum concentrations of total TAG and FA was observed (Figure 2A, 2B). No significant differences in time‐course profiles between the test drinks were found using the LMM (p = 0.28 and p = 0.22, respectively). The serum FA profile did differ between test drinks, as significant treatment‐time interactions were observed for estimated degree of unsaturation (p = 0.01), total omega‐6 fatty acids (p = 0.0002), total PUFA (p = 0.0012), total C18:2n‐6 (linoleic acid) (p = 0.000, Figure 2C), and the ratios of C18:2n‐6 (p = 0.01) and saturated fatty acids (p = 0.000, Figure 2D) per total fatty acids in serum by using the LMM (all outcomes of the LMM can be found in Table S4, Supporting Information). Esterified cholesterol slightly increased after consumption of the drinks, with a maximum at 60 min postprandially, after which levels gradually returned to baseline (Figure 2E). Free cholesterol appeared to decrease from 60 min postprandial onwards (Figure 2F). No significant differences in the estimates of interest between the test drinks were found using the LMM (p = 0.88 and p = 0.83 for esterified and free cholesterol, respectively).
Figure 2.

Serum concentrations of total triacylglycerol (TAG) (A), total fatty acids (B), esterified cholesterol (C), free cholesterol (D), ratio of saturated fatty acids to total fatty acids (E), and C18:2n‐6 (F). The black circles (●) represent the VEG‐test drink, the open squares (□) represent the BOV‐test drink. No significant differences in time‐courses between the test drinks were found using the LMM, for total TAG (p = 0.28), total fatty acids (p = 0.22), esterified cholesterol (p = 0.88), and free cholesterol (p = 0.83). A significant treatment‐time interaction was found for the ratio of saturated fatty acids to total fatty acids (p = 0.000) and C18:2n‐6 (p = 0.000).
3.3. Chylomicrons
After consumption of the test drinks, an increase in chylomicron concentration and size was found, as well as an increase in TAG and FA concentrations in the CMRF, and an increase in total cholesterol and phospholipids in chylomicrons (Figure 3 ). The LMM did not reveal significant differences in the shape of time courses between the test drinks for chylomicron concentration (p = 0.32), particle size of chylomicron (p = 0.72), TAG in CMRF (p = 0.32), FA in CRMF (p = 0.23), cholesterol in the chylomicrons (p = 0.33), or phospholipids in the chylomicrons (p = 0.32).
Figure 3.

Chylomicron concentration (A), size (B), and content (C‐F) after consumption of a milk drink containing either 100% vegetable fat (VEG‐test drink) or a mixture of 67% bovine milk fat with 33% vegetable fat (BOV‐test drink) (mean ± SEM, n = 19 for A, E, and F, n = 18 for B, C, and D). The black circles (●) represent the VEG‐test drink, the open squares (□) represent the BOV‐test drink. No significant differences in time‐courses between the test drinks were found using the LMM (p > 0.05).
3.4. Fatty Acid Profile of Chylomicrons
Figure 4 displays the FA profile of the CMRF with time. A significant treatment‐time interaction was found for C14:0, C14:1n‐5, C18:0, and C18:1n‐9 with the LMM (p = 0.001, p = 0.000, p = 0.01, and p = 0.04, respectively). To get an impression whether the FA profile of the test drinks was reflected in the CRMF, both the FA profile of the CMRF at 180 min after consumption of the test drinks and the FA profile of the two test drinks, in percentages, is shown in Figure 5 . Statistical analysis was not possible for this comparison (n = 1 for the test drinks), but the CMRF samples seemed to be relatively lower in C12:0 and C14:0 content compared to the levels of these fatty acids in the test drinks themselves. Furthermore, there seemed to be a relative enrichment of longer chain FA in CMRF, compared to the FA profile of the test drinks. For the BOV‐test drink, this was especially C18:1n‐9. C18:2n‐6, C20:3n‐6, C20:4n‐6, C22:5n‐3, and C22:6n‐3 were relatively enriched in the CMRF for both drinks.
Figure 4.

Fatty acid profile in chylomicron‐rich fraction (CMRF) of plasma after consumption of a milk drink containing either 100% vegetable fat (VEG‐test drink) or a mixture of 67% bovine milk fat with 33% vegetable fat (BOV‐test drink) (mean ± SEM, n = 18). A) C12:0, B) C14:0, C) C14:1n‐5, D) C16:0, E) C16:1n‐9, F) C16:1n‐7, G) C18:0, H) C18:1trans, I) C18:1n‐9, J) C18:1n‐7, K) C18:2n‐6, L) C18:3n‐6, M) C18:3n‐3, N) C20:0, O) C20:1n‐9, P) C20:2n‐6, Q) C20:3n‐6, R) C20:4n‐6, S) C20:5n‐3, T) C22:4n‐6), U) C22:5n‐6, V) C22:5n‐3, W) C22:6n‐3. The black circles (●) represent the VEG‐test drink, the open squares (□) represent the BOV‐test drink. A significant treatment‐time interaction was found in the case of C14:0, C14:1n‐5, C18:0, and C18:1n‐9 (p = 0.001, p = 0.000, p = 0.01, and p = 0.04 respectively).
Figure 5.

Fatty acid profile in chylomicron‐rich fraction (CMRF) of plasma 180 min after consumption of a milk drink containing either 100% vegetable fat (VEG‐test drink) or a mixture of 67% bovine milk fat with 33% vegetable fat (BOV‐test drink) (mean ± SEM, n = 18), and the normalized initial fatty acid profile of the VEG‐ and BOV‐test drinks (sum of C12:0‐C22:6n‐3: 100%). The black (▪) and open (□) bars represent the percentages in CMRF 150 min after consumption of the VEG‐ and BOV‐test drink, respectively.
3.5. Lipoproteins
Figure 6 shows the serum concentrations and particle sizes of the three main classes of lipoproteins, i.e., VLDL, LDL, and HDL. The LMM did not reveal significant differences between the test drinks in time‐course profiles of concentrations of lipoprotein classes, nor their particle sizes or content (for the specific subclasses see Table S4, Supporting Information) (Figure 6A‐F). The only exception was the level of TAGs in small LDL particles (p = 0.03, Figure 6G), which seem to return to baseline concentrations faster for VEG‐ compared to BOV‐test drink. The concentration profiles of small LDL particles was not different between test drinks (p = 0.66, Figure 6H).
Figure 6.

Concentrations and particle diameters of lipoprotein particles. A) Concentration and B) particle diameter of very large density lipoprotein (VLDL) particles, C) concentration, and D) particle diameter of large density lipoprotein (LDL) particles, E) concentration, and F) particle diameter of high‐density lipoprotein (HDL) particles, G) concentration of small LDL particles, and H) concentration of triglycerides in small LDL particles (mean ± SEM, n = 19). The black circles (●) represent the VEG‐test drink, the open squares (□) represent the BOV‐test drink. No significant differences in time‐courses of lipoprotein concentrations or particle sizes between the test drinks were found using the LMM, * represents sub‐classes of which p‐values can be found in Table S4 (Supporting Information). The concentration of triglycerides in small LDL particles was significant different between test drinks (p = 0.03).
3.6. Apolipoproteins
Serum concentration profiles of apolipoproteins B and A‐I were not significantly different between test drinks using the LMM (p = 0.85 and p = 0.66, respectively, Figure 7 ).
Figure 7.

Concentrations of apolipoprotein B (A) and A‐I (B) after consumption of two different test drinks. The black circles (●) represent the VEG‐test drink, the open squares (□) represent the BOV‐test drink. The LMM did not reveal significant differences between the test drinks with respect to the time courses of the concentrations of apolipoprotein‐B and apolipoprotein A‐I (p = 0.85 and p = 0.66, respectively).
3.7. Ketone Bodies
After consumption of the BOV‐test drink, a transient increase in the serum concentration of acetoacetate and 3‐hydroxybutyrate was found, while after consumption of the VEG‐test drink the concentrations of the compounds continuously decreased (Figure 8 ). The acetone response, measured in breath, did not differ between the BOV‐ and VEG‐test drink. The LMM did not show significant differences in time‐course profiles of the ketone bodies: acetoacetate (p = 0.15), 3‐hydroxybutyrate (p = 0.72), and acetone (p = 0.33). The peaks of the ketone bodies corrected for baseline (t = 30 for acetoacetate and 3‐hydroxybutyrate, t = 60 for acetone) were compared. The concentration of acetoacetate and 3‐hydroxybutyrate at 30 min after consumption of the BOV‐test drink significantly increased compared to the VEG‐test drink (p = 0.006 and p = 0.004, respectively). The concentrations of acetone at 60 min after consumption did not show significant differences between test drinks (p = 0.28).
Figure 8.

Concentrations of ketone bodies in serum (acetoacetate (A) and 3‐hydroxybutyrate (B)) and exhaled air (acetone (C)) after consumption of a milk drink containing either 100% vegetable fat (VEG‐test drink) or a mixture of 67% bovine milk fat with 33% vegetable fat (BOV‐test drink) (mean ± SEM, n = 19). The black circles (●) represent the VEG‐test drink, the open squares (□) represent the BOV‐test drink. No significant differences in time‐course of A) acetoacetate (p = 0.15), B) 3‐hydroxybutyrate (p = 0.72), and C) acetone (p = 0.33) between the test drinks were observed using the LMM. The peak concentrations of acetoacetate and 3‐hydroxybutyrate (30 min postprandial) were significantly higher after the BOV‐test drink compared to VEG‐test drink (p = 0.006 and p = 0.004, respectively), the peak concentrations of acetone (60 min postprandial) was not different between test drinks (p = 0.28).
4. Discussion
Bovine milk fat has a different FA profile and TAG structure compared to vegetable fat. This study indicated that this did not affect the postprandial energy metabolism and lipemic response to consumption of an IF containing 67% bovine milk fat in the fat blend (BOV), compared to IF containing vegetable fats only (VEG). No differences between the test drinks were observed in the shape of DIT and substrate oxidation over time. The IF fat source did not affect chylomicron concentration, particle size, or its total lipid content. The total TAG concentration in serum was not affected by the test drink consumed. The postprandial FA profile in CMRF reflected the difference in FA profile of the respective IFs. The concentration of ketone bodies was increased directly after consumption of the BOV‐test drink, but not after consumption of the VEG‐test drink.
Even though DIT seemed slightly higher over most of the time course after consumption of the BOV‐test drink, the DIT time‐course profiles of the test drinks were not significantly different. Previous studies that showed an increased DIT after consumption of MCT versus LCT involved considerably higher levels of MCFA (at least 12%) compared to this study.[ 5 , 6 ] The similar DIT of the two test drinks, despite a higher SCFA and MCFA content for the BOV‐test drink, may thus be explained by the relatively small difference in SCFA and MCFA between the two test drinks, which was just 6%, which is the maximum difference that can be reached by a realistic addition of bovine milk fat to IF. Directly (i.e., within 30 min) after consumption of the two drinks fat oxidation increased with a concomitant slight decrease in glucose oxidation. After 30 min postprandially, FA oxidation decreased again and carbohydrates became more predominant. This increase in fat oxidation directly after consumption of a meal is also found in previous trials,[ 24 , 25 , 26 ] but in these studies the meals contained 65–95en% from fat, while in the current study this was only 50en% with 42 en% from carbohydrates. This rapid initial increase in fat oxidation might be caused by the oral perception of fat. Sham feeding of fat has been found to increase metabolite levels, which can be used for oxidation and energy expenditure up to 1 h after the sham feeding.[ 27 , 28 , 29 ] Another explanation might be the oxidation of FAs by intestinal enterocytes directly after uptake.[ 30 , 31 ] Interestingly, the increase in fat oxidation was not seen in mice that were fed labelled fatty acids,[ 32 ] rather than providing lipids as TG as is done in this study. So possibly, the initial increase in FA oxidation compared to glucose oxidation may be associated with intestinal handling of TG, but this remains to be tested.
After consumption of the high‐fat test drinks, an increase in VLDL concentration was observed over time, while LDL and HDL concentrations were not much affected, which is in line with other trials studying other dietary lipid challenges in healthy male subjects.[ 33 , 34 ] We did not observe any differences in the shape of lipoprotein concentrations between the test drinks, similar to published findings where no differences in lipoprotein concentrations were seen after short‐term consumption of butter, coconut oil, olive oil, and canola oil[ 35 ], or long‐term consumption of diets differing in oleic acid[ 36 ] or medium‐chain FAs[ 37 ]. While we did not see a difference in small LDL size or concentration, we did observe a difference in small LDL‐TAGs. Small‐dense LDL particles originate from larger VLDL and large LDL particles following lipid transfer to tissues or are directly produced by the liver.[ 38 ] Small‐dense LDL particles, and specifically their cholesterol content, have been associated with hyperglyceridemia, obesity, and type 2 diabetes.[ 39 ] In the present study, not only particle size and amount, but also cholesterol content and total lipids of the small‐dense LDL were not different. Only a difference between drinks in the TAG level decline of the small dense LDL particles was observed. The effect of lower TAG concentrations in small LDL particles on metabolic health is unknown.
The percentage of SFA was 51% and 41% for BOV‐and VEG‐ test drink, respectively. The consumption of SFA is thought to result in a higher postprandial lipemic response compared to intake of MUFA.[ 8 ] However, despite the higher concentration of SFA in the BOV‐drink, no acute effects on TAG concentrations were observed. This is in line with earlier findings in young adults, who showed similar postprandial TAG responses to four single high‐fat meals differing in SFA and MUFA content.[ 35 ] In bovine milk fat, part of the SFA are SCFA and MCFA. Those FAs can be easily absorbed and be transported directly to the liver, without incorporation into chylomicrons.[ 40 ] Therefore, not all FAs of the BOV‐test drink would end up in chylomicrons. A study on the effects of chain length of SFA on postprandial lipemia showed that MCFA induced a lower postprandial TAG concentration than LCSFA.[ 41 ] Hence, the relatively higher levels of SCFA and MCA may have contributed to the absence of an increase of TAG in CMRF after consumption of the BOV‐test drink compared to the VEG‐test drink, despite the higher total SFA content. The differences between the test drinks also did not affect the particle size of the chylomicrons or levels of total FA, cholesterol, and phospholipid concentrations in the chylomicrons.
The FA profile of the test drinks and that of the CMRF, 180 min after consumption of the test drinks, were highly similar, which is in line with the general belief that dietary fat is directly used for the production of chylomicrons. Nevertheless, some differences were also evident. Immediately after consumption, the relative C12:0 and C14:0 content in CMRF seemed lower than in the test drinks. This may related to higher water solubility of FAs <C14,[ 42 ] facilitating direct uptake into the portal vein.[ 43 ] This study thus indicates that C14:0, like C12:0, may partly be directly absorbed without inclusion in chylomicrons. The relative lower levels of C12:0 and C14:0 in CMRF potentially explains the relative enrichment of longer chain FA in CMRF, compared to the FA profile of the test drinks. Nevertheless, it seems that especially C18:1n‐9 for the BOV‐test drink, and C18:2n‐6, C20:3n‐6, C20:4n‐6, C22:5n‐3, and C22:6n‐3 for both drinks were enriched in the CMRF. Possibly, this could be due to metabolism and desaturation of the FAs in the enterocyte.[ 44 ] After a period of fasting the activity of Δ‐desaturases was found to be increased (in rats).[ 45 ] Synthesis of C18:1n‐9 from C18:0 by Δ9‐desaturase might explain the enrichment of this FA and also the absence of an enrichment of its precursor (C18:0) in the CMRF after consumption of the BOV‐test drink. Still, it remains unclear why this is only seen for the BOV‐test drink. Our hypothesis is that it may have occurred to maintain MUFA levels, which were present in lower levels in the BOV‐test drink compared to the VEG‐test drink, as Δ9‐desaturase, in adipose tissue, is suggested to be involved in the regulation of MUFA content.[ 46 ] There might be a diet‐selective desaturase gene activation, as also suggested by Du et al.[ 47 ] Activation of Δ5‐desaturase in the enterocytes may clarify the enrichment of C20:3n‐6 and C20:4n‐6 in CMRF.[ 48 ] Furthermore, combined with activation of Δ6‐desaturase this could explain the enrichment of C22:5n‐3 and C22:6n‐3, which might have been formed from C18:3n‐3, which seems to be abundant in higher percentages in the normalized FA profile of the test drink compared to the CMRF FA profiles. C18:2n‐6 cannot be synthesized from other FAs in humans. It is particularly abundant in the microsomal membranes of enterocytes and may thus have been added to the chylomicrons from the enterocyte.[ 49 ] This proposed adaptive physiological response seems relevant in view of the important role of unsaturated FA in metabolic health and warrants further investigation.
No differences were observed between the test drinks in profiles of fat oxidation, total TAGs, or total FAs in serum. However, the concentration of the circulating ketone bodies acetoacetate and 3‐hydroxybutyrate were increased directly after consumption of the BOV‐test drink, but not after the VEG‐test drink. This may be associated with higher levels of SCFA and MCFA in the BOV‐test drink as these FAs become immediately available for beta‐oxidation due to the fast absorption and mitochondrial uptake independent of the rate limiting carnitine palmitoyltransferase shuttle system.[ 40 ] A similar increase in ketone bodies has been found after consumption of medium‐chain TAGs.[ 50 , 51 , 52 , 53 , 54 ] Ketogenesis was especially related to intake of octanoate (caprylic acid),[ 51 ] which was present twice as much in the BOV‐test drink compared to VEG‐test drink. The increase in ketone body concentration might be beneficial for infants. Lucas et al.[ 55 ] showed that breast‐fed infants have higher concentrations of ketone bodies compared to formula‐fed infants. Ketone bodies are mostly used as energy source for the heart, brain, and skeletal muscle.[ 56 ] In infants, the capacity to oxidize ketone bodies in the brain is higher than in adults.[ 53 ] This matches the development of lipogenesis and myelination of the central nervous system.[ 53 ] However, whether using bovine milk fat in IF could possibly be supportive of brain development, via formation of ketone bodies, needs further exploration.
In addition to the initial differences in circulating ketones, there were some differences in the time‐courses between the two drinks for some individual circulating fatty acids, not affecting the total amounts of TAGs and FA. The ratio of saturated fatty acids per fatty acids in serum was increased more after consumption of the BOV‐test drink compared to the VEG‐test drink. This is probably explained by the higher content of SFA in the BOV‐test drink, and the higher MUFA content in the VEG‐test drink, resulting in a higher absolute influx of those fatty acids. This difference is reflected by the higher concentrations of C14:0 and C18:0 in the CMRF after consumption of the BOV‐test drink, and the higher concentration of C18:1 in the CMRF after consumption of the VEG‐test drink. Another difference in the serum FA response was the higher concentrations of PUFA and omega‐6 fatty acids after consumption of the VEG drink, which could be explained by the higher concentration of C18:2n‐6 in serum after consumption of the VEG drink. This is not readily explained, since the levels of C18:2n‐6 in the test drinks were almost equal, and, as mentioned above, no difference was found in C18:2n‐6 concentrations in the CMRF. As C18:2n‐6 is one of the essential fatty acids, and thus cannot be formed endogenously by humans, the higher serum concentration after VEG drink may reflect an increased release from stores in peripheral tissues, or, alternatively, result from a decreased post‐prandial metabolism of that particular FA. As this essential fatty acid is especially important for the growth and development of infants,[ 57 ] and infants rely on one source of nutrition, the postprandial regulation of C18:2n‐6 could be a worthwhile topic of further investigation
In summary, in this study, we comprehensively examined the acute effects of two different fat blends in IF on postprandial energy metabolism and lipemia in healthy adults. We showed that replacing 67% of vegetable fat with bovine milk fat in IF, possibly beneficial to increase fat absorption by prevention of fatty acid soap formation but also increasing the level of SFA, did not influence energy metabolism and did not negatively affect the postprandial lipemic response. The addition of bovine milk fat to IF affected the postprandial FA profile in serum and chylomicrons, and thus the FAs that were presented to peripheral tissues. The physiological consequences of these different serum concentrations on peripheral tissues are unknown and would be an interesting topic for future research. Bovine milk fat addition also increased serum concentrations of ketone bodies. Ketone bodies are an important energy substrate for brain development,[ 58 ] and this observation may thus bear physiological relevance. However, as this was a short‐term study in adults, giving an indication what can be expected in infants, the true acute and longer‐term effect in infants cannot be directly extrapolated from these findings and needs further studies.
Conflict of interest
J.H.J.H. is an employee of FrieslandCampina. Other authors declare no conflict of interest.
Supporting information
Supporting information
Acknowledgements
A.G.N., J.H.J.H., and J.K. designed the research; J.H.J.H. and B.dW. conducted the clinical trial; J.H.J.H., B.dW., B.S., and E.T. performed the sample analyses; B.E., J.H.J.H., M.A., and I.A. analyzed the data, A.G.N. had primary responsibility for final content. All authors critically revised the paper and read an approved the final manuscript. FrieslandCampina financially contributed to this study and kindly provided the IF basepowders.
Hageman J. H., Erdõs B., Keijer J., Adriaens M., de B. Wit, Stañková B., Tvrzická E., Arts I. C., Nieuwenhuizen A. G., The Effect of Partly Replacing Vegetable Fat with Bovine Milk Fat in Infant Formula on Postprandial Lipid and Energy Metabolism: A Proof‐of‐principle Study in Healthy Young Male Adults. Mol. Nutr. Food Res. 2021, 65, 2000848. 10.1002/mnfr.202000848
Data Availability Statement
The data that support the findings of this study are available from the corresponding author upon reasonable request.
References
- 1. Manson W. G., Weaver L. T., Arch. Dis. Child. Fetal Neonatal Ed. 1997, 76, F206. [DOI] [PMC free article] [PubMed] [Google Scholar]
- 2. Hageman J. H. J., Danielsen M., Nieuwenhuizen A. G., Feitsma A. L., Dalsgaard T. K., Int. Dairy J. 2019, 92, 37. [Google Scholar]
- 3. Sun C., Wei W., Su H., Zou X., Wang X., Food Chem. 2018, 242, 29. [DOI] [PubMed] [Google Scholar]
- 4. Manios Y., Karaglani E., Thijs‐Verhoeven I., Vlachopapadopoulou E., Papazoglou A., Maragoudaki E., Manikas Z., Kampani M., Christaki I., Vonk M., Bos R., Parikh P., Proc. Nutr. Soc. 2020, 79, 1. [DOI] [PMC free article] [PubMed] [Google Scholar]
- 5. Kasai M., Nosaka N., Maki H., Suzuki Y., Takeuchi H., Aoyama T., Ohra A., Harada Y., Okazaki M., Kondo K., J. Nutr. Sci. Vitaminol. 2002, 48, 536. [DOI] [PubMed] [Google Scholar]
- 6. Ogawa A., Nosaka N., Kasai M., Aoyama T., Okazaki M., Igarashi O., Kondo K., J. Oleo Sci. 2007, 56, 283. [DOI] [PubMed] [Google Scholar]
- 7. Scalfi L., Coltorti a., Contaldo F., Am. J. Clin. Nutr. 1991, 53, 1130. [DOI] [PubMed] [Google Scholar]
- 8. Desmarchelier C., Borel P., Lairon D., Maraninchi M., Valéro R., Nutrients 2019, 11, 1299. [DOI] [PMC free article] [PubMed] [Google Scholar]
- 9. Innis S. M., Nelson C. M., Prostaglandins, Leukot. Essent. Fat. Acids 2013, 89, 145. [DOI] [PubMed] [Google Scholar]
- 10. Nelson C. M., Innis S. M., Am. J. Clin. Nutr. 1999, 70, 62. [DOI] [PubMed] [Google Scholar]
- 11. Borén J., Matikainen N., Adiels M., Taskinen M.‐R., Clin. Chim. Acta 2014, 431, 131. [DOI] [PubMed] [Google Scholar]
- 12. Hyson D., Rutledge J. C., Berglund L., Curr. Atheroscler. Rep. 2003, 5, 437. [DOI] [PubMed] [Google Scholar]
- 13. Lopez‐Miranda J., Marin C., Dietary, Physiological, and Genetic Impacts on Postprandial Lipid Metabolism, CRC Press/Taylor & Francis 2010. [PubMed] [Google Scholar]
- 14. Rathnayake K. M., Weech M., Jackson K. G., Lovegrove J. A., Nutr. Res. Rev. 2018, 31, 193. [DOI] [PubMed] [Google Scholar]
- 15. Harris J. A., Benedict F. G., Proc. Natl. Acad. Sci. USA 1918, 4, 370. [DOI] [PMC free article] [PubMed] [Google Scholar]
- 16. de J. B., Weir V., J. Physiol. 1949, 109, 1. [DOI] [PMC free article] [PubMed] [Google Scholar]
- 17. Péronnet F., Massicotte D., Can. J. Sport Sci. 1991, 16, 23. [PubMed] [Google Scholar]
- 18. Ala‐Korpela M., Clin. Chem. Lab. Med. 2008, 46, 27. [DOI] [PubMed] [Google Scholar]
- 19. Tvrzická E., Vecka M., Staňková B., Žák A., Anal. Chim. Acta 2002, 465, 337. [Google Scholar]
- 20. Folch J., Lees M., Sloane stanley G. H., J. Biol. Chem. 1957, 226, 497. [PubMed] [Google Scholar]
- 21. Carlson L. A., Clin. Chim. Acta. 1985, 149, 89. [DOI] [PubMed] [Google Scholar]
- 22. Pinheiro J., Bates D., DebRoy S., Sarkar D., R. C. Team , nlme: Linear and Nonlinear Mixed Effects Models. 2019. https://CRAN.R-project.org/package=nlme.
- 23. Team R. C., R: A Language and Environment for Statistical Computing. R Foundation for Statistical Computing, R Core Team, Vienna, Austria 2018. http://www.R-project.org/.
- 24. Marrades M. P., Martínez J. A., Moreno‐Aliaga M. J., Eur. J. Clin. Nutr. 2007, 61, 166. [DOI] [PubMed] [Google Scholar]
- 25. Blaak E. E., Hul G., Verdich C., Stich V., Martinez A., Petersen M., Feskens E. F. M., Patel K., Oppert J. M., Barbe P., Toubro S., Anderson I., Polak J., Astrup A., Macdonald I. A., Langin D., Holst C., Sørensen T. I., Saris W. H. M., J. Clin. Endocrinol. Metab. 2006, 91, 1462. [DOI] [PubMed] [Google Scholar]
- 26. Chiu C. H., Yang T. J., Chen C. H., Zeng M. J., Lipids Health Dis. 2019, 18, 1. [DOI] [PMC free article] [PubMed] [Google Scholar]
- 27. Smeets A. J., Lejeune M. P., Westerterp‐Plantenga M. S., Br. J. Nutr. 2009, 101, 1360. [DOI] [PubMed] [Google Scholar]
- 28. Smeets A. J. P. G., Lejeune M. P. G. M., Westerterp‐Plantenga M. S., Appetite 2007, 49, 331. [Google Scholar]
- 29. Smeets A. J. P. G., Westerterp‐Plantenga M. S., Br. J. Nutr. 2006, 95, 795. [DOI] [PubMed] [Google Scholar]
- 30. Metges C. C., Wolfram G., J. Nutr. 1991, 121, 31. [DOI] [PubMed] [Google Scholar]
- 31. Randle P. J., Garland P. B., Hales C. N., Newsholme E. A., Lancet (London, England) 1963, 1, 785. [DOI] [PubMed] [Google Scholar]
- 32. Fernández‐Calleja J. M. S., Bouwman L. M. S., Swarts H. J. M., Oosting A., Keijer J., van Schothorst E. M., Sci. Rep. 2019, 9, 1. [DOI] [PMC free article] [PubMed] [Google Scholar]
- 33. Rizi E. P., Baig S., Loh T. P., Toh S. A., Khoo C. M., Shyong Tai E., Front. Physiol. 2019, 10, 1. [DOI] [PMC free article] [PubMed] [Google Scholar]
- 34. Wojczynski M. K., Glasser S. P., Oberman A., Kabagambe E. K., Hopkins P. N., Tsai M. Y., Straka R. J., Ordovas J. M., Arnett D. K., Lipids Health Dis. 2011, 10, 181 DOI 10.1186/1476-511X-10-181. [DOI] [PMC free article] [PubMed] [Google Scholar]
- 35. Sciarrillo C. M., Koemel N. A., Tomko P. M., Bode K. B., Emerson S. R., Nutrients 2019, 11, 1089. [DOI] [PMC free article] [PubMed] [Google Scholar]
- 36. Thijssen M. A., Mensink R. P., Small Differences in the Effects of Stearic Acid, Oleic Acid, and Linoleic Acid on the Serum Lipoprotein Profile of Humans 1–3, 2005. [DOI] [PubMed]
- 37. Tremblay A. J., Lamarche B., Labonté M. È., Lépine M. C., Lemelin V., Couture P., Am. J. Clin. Nutr. 2014, 99, 54. [DOI] [PubMed] [Google Scholar]
- 38. Diffenderfer M. R., Schaefer E. J., Curr. Opin. Lipidol. 2014, 25, 221. [DOI] [PubMed] [Google Scholar]
- 39. Feingold K. R., Grunfeld C., in Endotext, MDText.Com, Inc., South Dartmouth: n.d. [Google Scholar]
- 40. Schönfeld P., Wojtczak L., J. Lipid Res. 2016, 57, 943. [DOI] [PMC free article] [PubMed] [Google Scholar]
- 41. Panth N., Dias C. B., Wynne K., Singh H., Garg M. L., Clin. Nutr. 2019, 90, DOI 10.1016/J.CLNU.2019.02.008. [DOI] [PubMed] [Google Scholar]
- 42. Nielsen S. D., Amer B., Blaabjerg K., Dalsgaard T. K., Jessen R., Petrat‐Melin B., Rasmussen M. K., Poulsen H. D., Young J. F., J. Agric. Food Chem. 2017, 65, 281. [DOI] [PubMed] [Google Scholar]
- 43. Perret J. P., J. Physiol. 1980, 76, 159. [PubMed] [Google Scholar]
- 44. Garg M. L., Keelan M., Thomson A. B. R., Clandinin M. T., Biochim. Biophys. Acta ‐ Lipids Lipid Metab. 1988, 958, 139. [DOI] [PubMed] [Google Scholar]
- 45. Garg M. L., Keelan M., Thomson A. B., Clandinin M. T., Biochim. Biophys. Acta 1992, 1126, 17. [DOI] [PubMed] [Google Scholar]
- 46. Kouba M., Mourot J., Reprod. Nutr. Dev. n.d., 38, 31. [DOI] [PubMed] [Google Scholar]
- 47. Du Q., Martin J.‐C., Agnani G., Pages N., Leruyet P., Carayon P., Delplanque B., J. Nutr. Biochem. 2012, 23, 1573. [DOI] [PubMed] [Google Scholar]
- 48. Lee J. M., Lee H., Kang S., Park W. J., Nutrients 23, 2016, 8, DOI 10.3390/NU8010023. [DOI] [PMC free article] [PubMed] [Google Scholar]
- 49. Keelan M., Clandinin M. T., Thomson A. B., Can. J. Physiol. Pharmacol. 1997, 75, 1009. [PubMed] [Google Scholar]
- 50. Bach A., Schirardin H., Weryha A., Bauer M., J. Nutr. 1977, 107, 1863. [DOI] [PubMed] [Google Scholar]
- 51. Yeh Y.‐Y., Zee P., J. Nutr. 1976, 106, 58. [DOI] [PubMed] [Google Scholar]
- 52. Sann L., Divry P., Lasne Y., Ruitton A., Acta Paediatr. Scand. 1982, 71, 923. [DOI] [PubMed] [Google Scholar]
- 53. Wu P. Y. K., Edmond J., Auestad N., Rambathla S., Benson J., Picone T., Pediatr. Res. 1986, 20, 338. [DOI] [PubMed] [Google Scholar]
- 54. Seaton T. B., Welle S. L., Warenko M. K., Campbell R. G., Am. J. Clin. Nutr. 1986, 44. [DOI] [PubMed] [Google Scholar]
- 55. Lucas A., Boyes S., Bloom S. R., Aynsley‐Green A., Acta Paediatr. Scand. 1981, 70, 195. [DOI] [PubMed] [Google Scholar]
- 56. Puchalska P., Crawford P. A., Cell Metab. 2017, 25, 262. [DOI] [PMC free article] [PubMed] [Google Scholar]
- 57. Uauy R., Dangour A. D., Ann. Nutr. Metab. 2009, 55, 76. [DOI] [PubMed] [Google Scholar]
- 58. Steiner P., Ann. Nutr. Metab. 2020, 75, 8. [DOI] [PubMed] [Google Scholar]
Associated Data
This section collects any data citations, data availability statements, or supplementary materials included in this article.
Supplementary Materials
Supporting information
Data Availability Statement
The data that support the findings of this study are available from the corresponding author upon reasonable request.