

Abstract
31P MR spectroscopic imaging (MRSI) is a versatile technique to study phospholipid precursors and energy metabolism in the healthy and diseased human brain. However, mainly due to its low sensitivity, 31P MRSI is currently limited to research purposes. To obtain 3D 31P MRSI spectra with improved signal‐to‐noise ratio on clinical 3 T MR systems, we used a coil combination consisting of a dual‐tuned birdcage transmit coil and a 31P eight‐channel phased‐array receive insert. To further increase resolution and sensitivity we applied WALTZ4 1H decoupling and continuous wave nuclear Overhauser effect (NOE) enhancement and acquired high‐quality MRSI spectra with nominal voxel volumes of ~ 17.6 cm3 (effective voxel volume ~ 51 cm3) in a clinically relevant measurement time of ~ 13 minutes, without exceeding SAR limits. Steady‐state NOE enhancements ranged from 15 ± 9% (γ‐ATP) and 33 ± 3% (phosphocreatine) to 48 ± 11% (phosphoethanolamine). Because of these improvements, we resolved and detected all 31P signals of metabolites that have also been reported for ultrahigh field strengths, including resonances for NAD+, NADH and extracellular inorganic phosphate. T1 times of extracellular inorganic phosphate were longer than for intracellular inorganic phosphate (3.8 ± 1.4s vs 1.8 ± 0.65 seconds). A comparison of measured T1 relaxation times and NOE enhancements at 3 T with published values between 1.5 and 9.4 T indicates that T1 relaxation of 31P metabolite spins in the human brain is dominated by dipolar relaxation for this field strength range. Even although intrinsic sensitivity is higher at ultrahigh fields, we demonstrate that at a clinical field strength of 3 T, similar 31P MRSI information content can be obtained using a sophisticated coil design combined with 1H decoupling and NOE enhancement.
Keywords: brain, 1H decoupling, nuclear Overhauser effect, 31P MR spectroscopic imaging, T1, 3 T
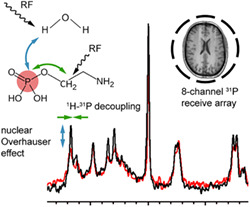
We performed 3D 31P MRSI of the human brain at 3 T employing a 1H/31P dual‐tuned birdcage transmit coil and a 31P 8‐channel phased‐array receive insert to acquire high‐quality 31P MR spectra with and without 1H‐decoupling and/or 1H‐31P NOE. The well‐resolved spectra allowed to analyze two peaks for inorganic phosphate and the NAD+/NADH redox ratio. Localized T1 relaxation times and NOE enhancements of 31P spins were measured and compared with those acquired at other field strengths, indicating little effect of chemical shift anisotropy relaxation.
Abbreviations used
- ATP
adenosine triphosphate
- CSA
chemical shift anisotropy
- CW
continuous wave
- FID
free induction decay
- FOV
field of view
- GPC
glycerophosphocholine
- GPE
glycerophosphoethanolamine
- imP
immobile phosphates
- MRSI
magnetic resonance spectroscopic imaging
- NAD
nicotinamide adenine dinucleotide
- NADH
NAD reduced
- NAD+
NAD oxidized
- NOE
nuclear Overhauser effect
- OTP
occipito–temporal–parietal
- PC
phosphocholine
- PCr
phosphocreatine
- PDE
phosphodiesters
- PE
phosphoethanolamine
- Pi
inorganic phosphate
- Piex
extracellular inorganic phosphate
- Piin
intracellular inorganic phosphate
- PME,
phosphomonoesters
- SAR
specific absorption rate
- SD
standard deviation
- SEM
standard error of the mean
- SNR
signal‐to‐noise ratio
- TR
repetition time
- UDPG
uridine diphosphate glucose
1. INTRODUCTION
In vivo phosphorus magnetic resonance spectroscopy (31P MRS) of living tissues enables monitoring of phosphorus‐containing compounds involved in membrane synthesis and energy metabolism. In addition, from the chemical shift of the 31P resonances of some of these compounds, intracellular pH and magnesium content can be determined. 1 Recently, it was also shown that at a magnetic field of 4 T or higher the cellular redox state of the brain can be determined from the nicotinamide dinucleotide (NAD(H)) resonances. 2 31P MRS of the human brain can provide unique information about various neurological diseases (eg, 3 , 4 , 5 , 6 , 7 , 8 ). However, because of a lower sensitivity and the need for additional hardware, 31P MRS is less frequently used than 1H MRS. 9
Localized 31P MRS of the brain is commonly performed with surface or birdcage coils, integrated with 1H coils for MRI and shimming, and pulse sequences to select a single voxel or multiple voxels. 10 , 11 , 12 To make up for the lower sensitivity of 31P compared with 1H MRS, larger voxels and/or longer acquisition times are usually employed. The intrinsic signal‐to‐noise ratio (SNR) can be improved by performing 31P MRS at a high main magnetic field and by using dedicated receive coils. Most clinical sites do not have access to expensive ultrahigh field MR systems (≥ 7 T) and therefore rely on adequate coil designs to optimize sensitivity. A phased array of receive coils encompassing the whole brain combined with a homogeneous 31P volume coil for transmit can boost SNR, in particular in superficial brain areas, while maintaining a large field of view (FOV). 10 , 13 , 14 Such coil setups do not require high power adiabatic pulses for a homogeneous 31P excitation profile, but can be employed with rectangular pulses with low radiofrequency (RF) power instead. As a result, RF power deposition remains well below maximum specific absorption rates (SAR), which creates room for further spectral and sensitivity improvement by 1H irradiation techniques like 1H‐31P heteronuclear decoupling and nuclear Overhauser effect (NOE) enhancement.
Broadband 1H decoupling can improve spectral resolution and sensitivity, in particular at field strengths of 3 T or below for which the attainable 31P resonance linewidths of metabolites are of the same order as the 1H‐31P J‐coupling constants. 15 This J‐coupling results in splitting of 31P resonances, which appears as a line broadening in in vivo 31P MR spectra and decreases spectral resolution. In 1H‐decoupled spectra, the 1H‐31P J‐coupling is eliminated by saturating the coupled proton spins with high‐power broadband 1H irradiation pulses during 31P signal acquisition. In this way, peak splitting is removed and spectral overlap is minimized, resulting in increased SNR and improved fitting accuracy.
NOE enhancement is achieved by the saturation of proton spins near 31P nuclei by applying low‐power proton irradiation at the water frequency prior to 31P signal acquisition. As a result of cross‐relaxation, polarization will be transferred from the saturated protons to the 31P nuclei of metabolites, which leads to an increase of the 31P signal. 16
In this study we evaluated the benefits of using a volume transmit and phased array receive setup at 3 T to perform 31P MRSI with 1H decoupling and 1H‐31P NOE. As there are only limited data available on the effect of 1H decoupling on signal linewidth, on signal enhancement due to 1H‐31P NOE, and on T1 relaxation times of 31P spins in the brain at 3 T, we performed spatially resolved 3D 31P MRSI to determine the value of these variables for the resonances of all phosphorylated metabolites in the healthy human brain that can be detected. In addition, we investigated if we could determine the redox state of the brain from the 31P resonances of the oxidized and reduced form of nicotinamide adenine dinucleotide (NAD+ and NADH, respectively) at 3 T. Finally, we compared our results with those reported for other field strengths and discuss to what extent our 31P MRSI methodology at 3 T can compete with reported 31P MRSI at ultrahigh fields.
2. EXPERIMENTAL
In total, 12 volunteers participated in this study, which was conducted with the approval of the institutional review board of Radboud University Medical Center, Nijmegen. Age and gender of the volunteers are reported below.
2.1. Data acquisition
31P MRS experiments were performed on a Magnetom Prisma Fit 3 T MR system (Siemens Healthcare, Erlangen, Germany) with a customized coil setup as previously described. 14 Briefly, this setup consists of an in‐house‐built eight‐channel 31P receive head‐array coil (inner diameter 23 cm, element size 10 x 20 cm) combined with a commercially available quadrature Tx/Rx 1H/31P birdcage coil (RAPID Biomedical, Würzburg, Germany). With this setup the 1H‐31P volume coil generates a homogeneous transmit field while 31P signals close to the elements are received with a high sensitivity by the eight‐channel array insert. In order to allow active detuning at the 31P frequency in both the transmit and receive coils, small adjustments were made to the commercial birdcage coil by the manufacturer. 31P transmit pulse calibration was performed by means of maximizing PCr signal intensity in a series of slice‐selective pulse‐acquire experiments with an incremental flip angle (TR = 15 seconds) covering the brain cortex.
Whole brain 3D 31P MRSI FID datasets were acquired with and without NOE or 1H decoupling pulses in six volunteers (male/female: 2/4, mean age: 31.3 ± 7.3 years). TR was set to 2000 ms. 31P spins were excited by a rectangular‐shaped excitation pulse (duration: 500 μs) with a flip angle of 40°. Dead time between the end of excitation and the start of FID acquisition was 100 μs, accommodating phase‐encoding gradients in three dimensions. FIDs (1024 data points, 512 ms) in a 10 x 10 x 10 matrix were averaged four times using Hamming‐weighted k‐space sampling. The FOV was centered on the brain midline and aligned parallel to the tangent to the anterior and posterior commissure. FOV dimensions were 260 x 260 x 260 mm3, resulting in nominal voxels of 17.6 cm3. This corresponds to an effective spherical voxel size of 51 cm3, which is defined as 64% of the point spread function area. 17 The total measurement time was 13 minutes 8 seconds per dataset.
For NOE and 1H decoupling the proton frequency was centered on the water resonance. For steady‐state 1H‐31P NOE experiments, continuous wave (CW) irradiation was applied quasicontinuously (30 pulses, pulse duration 47.7 ms, interpulse delay 1 ms) prior to each 31P excitation pulse, with a duration of 1440 ms and a γB1 of 35 Hz. Proton decoupling was applied during the first 256 ms (50%) of the acquisition window and was achieved with a WALTZ4 decoupling scheme (γB1 of 250 Hz, decoupling bandwidth of 625 Hz).
T1 relaxation times of all observable 31P metabolites were assessed with a 2D MRSI slice‐selective FID progressive saturation experiment in six volunteers (male/female: 3/3, mean age: 32.0 ± 5.4 years). The pulse TR was changed in each experiment according to the following scheme: 550, 1000, 18 000, 9000, 2000, 5000 ms, with a fixed 90° flip angle. The acquisition matrix contained 8 x 8 voxels with a nominal size of 37.5 x 37.5 x 70 mm3. For better SNRs, experiments with a TR of 550 and 1000 ms were averaged 32 and 16 times, respectively; all of the other experiments consisted of eight averages.
2.2. Data postprocessing
FIDs of each receive element were combined in the time domain using the Brown combination. 18 3D 31P MRSI data were Hamming‐filtered and zerofilled to a 16 x 16 x 16 matrix before Fourier transformation. All data were evaluated with the software package syngo.via (Siemens Healthcare) and included postprocessing (zerofilling, phase correction, baseline correction and filtering [159 ms exponential filter]) and automatic peak fitting in the time domain. Prior knowledge for fitting of 1H‐decoupled and nondecoupled 31P MR spectra included the chemical shifts, relative peak heights of multiplets and 31P‐31P J‐coupling constants of the well‐resolved resonances of 12 metabolites, as described elsewhere. 1 , 19 The chemical shifts of the NADH and NAD+ resonances were fixed and related to the α‐ATP chemical shift. For NAD(H), linewidths were used as fitted for α‐ATP. Immobile phosphates (imP) were fitted with an additional peak at 2.25 ppm. In order to compare metabolite linewidths at half height, all 31P resonances in nonfiltered spectra—acquired with and without 1H decoupling—were fitted as singlets with a Gaussian shape.
Signal enhancement by the steady‐state 1H‐31P NOE was evaluated per volunteer in 20 different voxels of two transversal partitions of the 3D dataset covering the occipito–temporal–parietal (OTP) cortex of the brain. Per metabolite the enhancement was calculated as the percentage increase of the peak integral obtained with and without NOE or 1H decoupling:
Averaged voxel values per volunteer were combined to obtain a mean enhancement (± standard deviation [SD]) for all six volunteers. In addition, average linewidths of all metabolite signals and SNR of PCr and α‐ATP were calculated from the same voxels. Linewidth was defined as the full width at half signal maximum. SNR was determined as the peak height divided by the SD of the noise.
Tissue pH was calculated from the difference in chemical shift (δppm) between the PCr and Pi resonance, according to:
with phosphoric acid dissociation constant pKa = 6.73, and 31P limiting shifts δa = 3.275 and δb = 5.685 ppm. 20 From all 1H‐decoupled datasets we selected 21 voxels to measure δppm between the resonance of PCr and of both intracellular (Piin) and extracellular (Piex) inorganic phosphate. Intra‐ and extracellular pH values were calculated and presented as mean values (± SD).
T1 relaxation times of all 31P metabolites were calculated in a large voxel centered in the occipital and parietal cortex. Signal integrals at different TRs were fitted with a nonlinear fitting routine in Matlab (The MathWorks Inc., Natick, MA, USA) to the monoexponential function
describing progressive saturation. M(t) is the signal intensity at time TR and M(0) at infinite TR. Fitted T1 values are reported only in cases where the goodness of fit (R2) was larger than 0.7.
3. RESULTS
3.1. Spectral resolution and 1H decoupling
In 31P MR spectra from voxels obtained of the human brain by 3D 31P MRSI at 3 T with an eight‐channel receive array, peaks can be observed for ATP, phosphocreatine (PCr), phosphodiesters (PDE), inorganic phosphate (Pi) and phosphomonoesters (PME) (Figure 1A). In these spectra, individual PDE and PME peaks are not well resolved due to 1H‐31P J‐coupling. By applying WALTZ4 1H decoupling with the brain volume coil at the 1H frequency during the 31P acquisition time this coupling can be removed, eliminating the 1H splitting of the 31P peaks and resulting in higher peak intensities 15 (Figure 1B). The 1H‐decoupled 31P spectra from MRSI voxels showed well‐resolved signals of phosphoethanolamine (PE), phosphocholine (PC), glycerophosphoethanolamine (GPE) and glycerophosphocholine (GPC) as well as a better resolved doublet for α‐ATP and for the multiplet consisting of the oxidized and reduced form of nicotinamide adenine dinucleotide (NAD+ and NADH, respectively). The 1H decoupling did not generate additional noise in the 31P spectra and could be performed within SAR limits at the applied experimental conditions. 14
FIGURE 1.
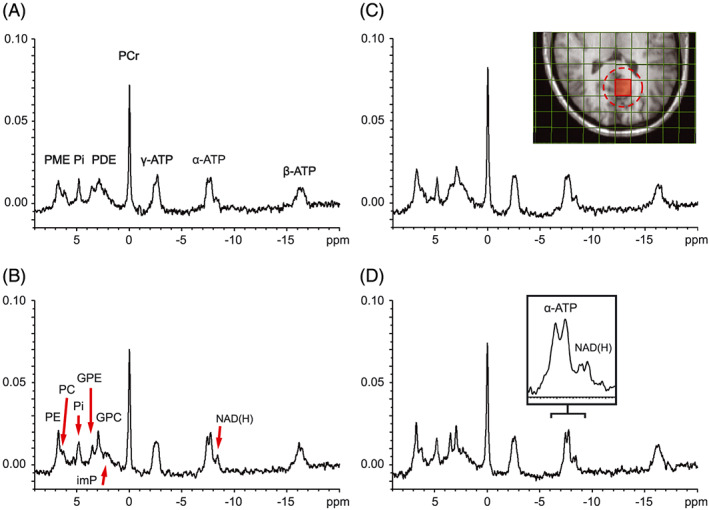
Human brain 31P MR spectra acquired with 3D MRSI with and without 1H irradiation. Line broadening is applied with a 2 Hz exponential filter. All spectra are from the nominal voxel shown in red in the inset of Figure 1C. The effective voxel size (~ 51 cc) is indicated with a dashed circle. (A) Spectrum obtained without 1H irradiation. (B) Spectrum obtained with WALTZ4 1H decoupling during 50% of the acquisition time. The PME peak is better resolved in phosphoethanolamine (PE) and phosphocholine (PC) and the PDE peak in glycerophosphoethanolamine (GPE) and glycerophosphocholine (GPC). The individual resonances of α‐ATP and NAD(H) are also better resolved. (C) Spectrum obtained with 1H CW pulses applied during 1440 ms before the 31P excitation pulse. A clear NOE enhancement is observed for most 31P resonances. Compare with Figure 1A. (D) Spectrum obtained with a combination of 1H CW pulses 1440 ms prior to 31P excitation, and WALTZ4 1H decoupling during 50% of the acquisition time. The inset is an enlargement of the resonance region of α‐ATP and NAD(H). imP, immobile phosphates; PME, phosphomonoesters; Pi, inorganic phosphate; PDE, phosphodiesters; PCr, phosphocreatine; NAD(H), nicotineamide adenine dinucleotide
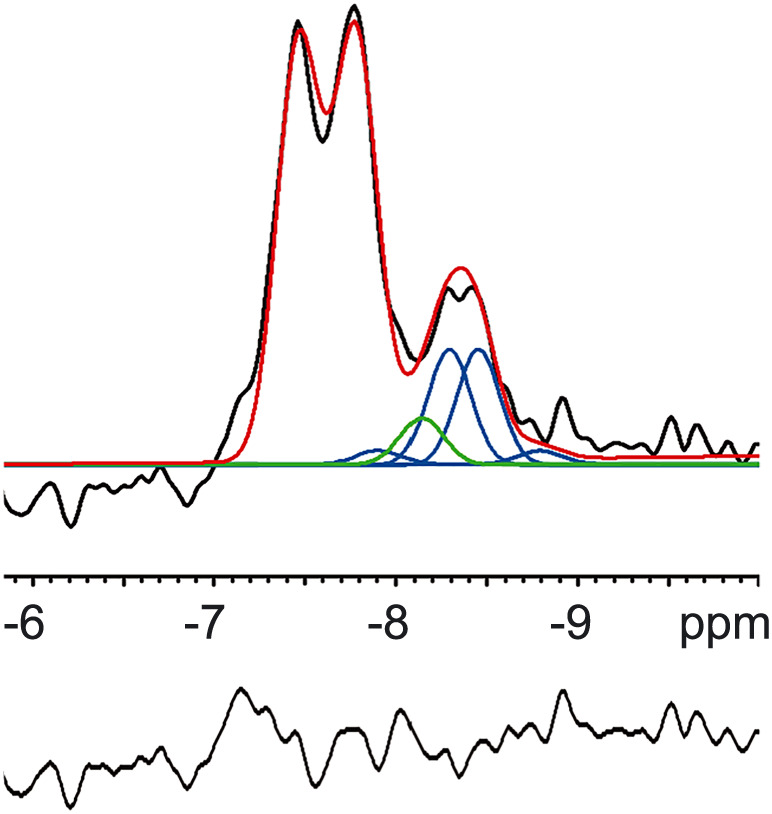
For the 1H decoupled spectra of 20 voxels in the occipito‐temporal‐parietal (OTP) region of the brain (vide infra) of six volunteers we determined an average SNR for PCr of 51.4 ± 10.6 and for α‐ATP of 13.8 ± 1.8. Variations in SNR can be attributed to different distances between voxels and coil elements. The high SNR achieved with the receive array coil also facilitated the observation of a small phosphate peak resolved at about 0.4 to 0.6 ppm downfield from the intracellular Pi peak (Piin) (Figure 2), which has been assigned to extracellular phosphate (Piex). 20 , 22 From the chemical shifts of Piex and Piin in spectra of different voxels, we calculated a pH of between 7.3 and 7.5 and of ~ 7.0, respectively.
FIGURE 2.
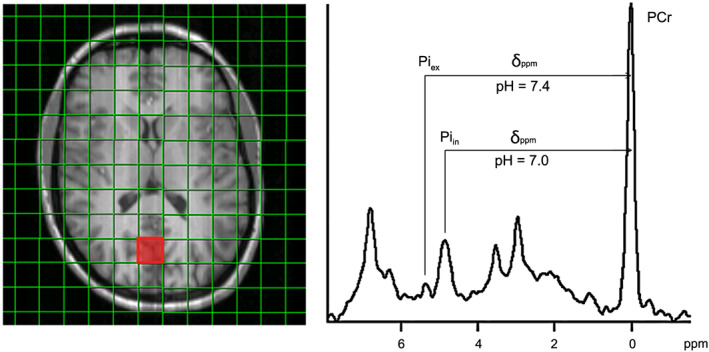
Inorganic phosphate resonances assigned to intracellular phosphate (Piin) and extracellular phosphate (Piex) and the calculated corresponding pH values of these tissue compartments. The voxel location of the displayed 1H‐decoupled spectrum is indicated with a red square
As a result of 1H decoupling, the linewidths of peaks of phosphates that are J‐coupled with protons are decreased. In Table 1 we present an overview of the average fitted linewidths in native 31P MRSI data without 1H irradiation and in 1H‐decoupled spectra as determined for 20 nominal voxels in six volunteers (Figure 3). The average linewidth of PCr was 7.3 ± 2.9 Hz and did not change when 1H decoupling was applied, whereas the linewidths of the 31P resonances for PE, PC, GPE, GPC and α‐ATP, of which the phosphates are coupled to protons, decreased by 8.2 (PE and PC), 11.8 (GPE and GPC) and 4.9 Hz (α‐ATP).
TABLE 1.
Average linewidths (± SD) of fitted metabolites in 31P MRSI spectra in the brain at 3 T (Hz) without and with 1H decoupling. Voxel locations of included spectra are indicated in Figure 3. The phosphocholine (PC) and phosphoethanolamine (PE) linewidths were linked in the prior knowledge set, and are therefore equal. The same holds for glycerophosphocholine (GPC) and glycerophosphoethanolamine (GPE)
| Native MRSI | 1H‐decoupled | |||
|---|---|---|---|---|
| Linewidth (Hz) | Linewidth (Hz) | |||
| PE and PC | 22.8 | (± 2.3) | 14.6 | (± 5.6) |
| Pi | 15.5 | (± 4.1) | 15.5 | (± 5.1) |
| GPE and GPC | 22.6 | (± 2.7) | 10.8 | (± 5.0) |
| imP | 62.6 | (± 17.6) | 69.2 | (± 12.3) |
| PCr | 7.3 | (± 2.9) | 7.3 | (± 2.8) |
| γ‐ATP | 19.3 | (± 1.6) | 19.1 | (± 2.5) |
| α‐ATP | 17.2 | (± 3.1) | 12.3 | (± 2.8) |
| β‐ATP | 30.1 | (± 7.0) | 29.1 | (± 4.1) |
Abbreviations: ATP, adenosine triphosphate; imP, immobile phosphates; MRSI, magnetic resonance spectroscopic imaging; PCr, phosphocreatine; Pi, inorganic phosphate
FIGURE 3.
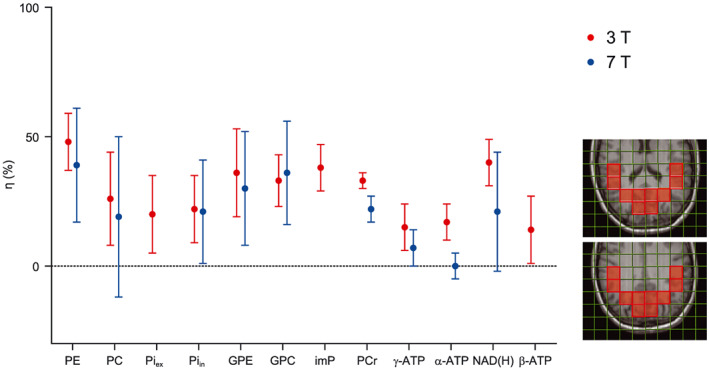
NOE enhancement factors of 31P metabolites at 3 T (red). For comparison, NOE enhancement factors at 7 T, reported by Lagemaat et al 21 are displayed in blue. All evaluated voxels (OTP region) are projected on the T1‐weighted anatomical MR images (right)
3.2. Signal enhancement by 1H‐31P NOE
Next to the use of a 31P receive array, the SNR can also be enhanced by the 1H‐31P NOE. An example of an NOE‐enhanced spectrum is displayed in Figure 1C. We characterized typical NOE enhancement factors for all detectable metabolites at 3 T. When applying CW saturation at the water frequency for 1.5 seconds prior to the acquisition, we observed average 1H‐31P NOE enhancements ranging from 48 ± 11% for PE and 33 ± 3% for PCr to 15 ± 9% for γ‐ATP for selected voxels in the OTP region (Figure 3). The enhancement factor of total NAD(H) is reported, as the resonances of NAD+ and NADH are difficult to analyze separately without 1H decoupling. A complete overview of averaged values from six volunteers is presented in Table 2. A comparison of our NOE data with those previously obtained at 7 T shows that the enhancements are similar or slightly higher 21 (Figure 3). As we averaged voxels with an overlapping effective voxel size, reported SDs at 3 T are relatively small.
TABLE 2.
Overview of average steady‐state nuclear Overhauser effect (NOE) enhancements (% ± SD) in the occipito–temporal–parietal (OTP) region of the brain at 3 T
| Metabolite | 1H‐31P NOE enhancement (%) | |
|---|---|---|
| PE | 48 | (± 11) |
| PC | 26 | (± 18) |
| Piex | 20 | (± 15) |
| Piin | 22 | (± 13) |
| GPE | 36 | (± 17) |
| GPC | 33 | (± 10) |
| imP | 38 | (± 9) |
| PCr | 33 | (± 3) |
| yATP | 15 | (± 9) |
| aATP | 17 | (± 7) |
| NAD(H) | 40 | (± 9) |
| bATP | 14 | (± 13) |
Abbreviations: ATP, adenosine triphosphate; GPC, glycerophosphocholine; GPE, glycerophosphoethanolamine; imP, immobile phosphates; PC, phosphocholine; PCr, phosphocreatine; PE, phosphoethanolamine; Piex, extracellular inorganic phosphate; Piin, intracellular inorganic phosphate; NAD(H), nicotinamide adenine dinucleotide (oxidised and reduced)
Because the combined coil setup allows application of rectangular 31P excitation pulses while preserving a homogeneous excitation profile, RF power deposition is low. Therefore, we were able to apply WALTZ4 1H decoupling pulses in combination with CW 1H‐31P NOE pulses, without exceeding SAR limits at a TR of 2 seconds. 14 An example of a 1H‐decoupled spectrum with NOE enhancement is shown in Figure 1D.
In 1H‐decoupled 31P spectra with NOE enhancement (n = 4), we were able to separately assess the resonances for NAD+ and NADH (Figure 4). From the integral of these metabolite resonances we determined an average cellular redox state NAD+/NADH of 5.7 ± 0.9 for the selected voxels indicated in Figure 3. We also calculated the tissue concentrations of both metabolites using α‐ATP = 3.0 mM as an internal reference, 22 and taking into account the number of contributing phosphate groups (1:2) as well as the determined NOE enhancements of α‐ATP (17%) and NAD(H) (40%). We found tissue concentrations of 0.41 ± 0.03 and 0.07 ± 0.01 mM for NAD+ and NADH, respectively.
FIGURE 4.
Example of the α‐ATP and NAD(H) region of an in vivo 31P MR spectrum obtained from a voxel in the occipital region of the human brain at 3 T. The spectrum (black) was filtered with a 2 Hz exponential filter. Relative peak heights of NAD+ were fixed according to. 19 Chemical shift of the NAD(H) resonances were fixed with respect to the α‐ATP chemical shift. Linewidths of NAD(H) were equal to the linewidth of α‐ATP. The fitting result is shown in red. The resonances of α‐ATP, NAD+ (blue) and NADH (green) could be spectrally resolved when NOE‐enhancement and 1H‐decoupling were applied and prior knowledge of the NAD+ and NADH resonances was implemented in their fitting. The bottom line (black) shows the fitting residue
Proton irradiation by 1H decoupling also saturates proton spins of nearby 31P nuclei. At short TRs, this can also induce NOE enhancement. 15 , 23 For PCr, a resonance that is not influenced in shape by decoupling, we observed a NOE enhancement of 17 ± 4% due to decoupling at a TR of 2 seconds, while the 31P signals of other metabolites did not show significant average enhancements.
3.3. T1 relaxation times
Knowledge of T1 relaxation times of 31P spins is useful to understand their biophysical properties and to optimize pulse sequence TRs. However, for the human brain at 3 T there is little 31P T1 data available. Therefore, we determined T1 values for 31P spins of phosphorylated compounds observed in 31P spectra from an occipital voxel (inset, Figure 5) by saturation recovery experiments in six volunteers. Normalized data from all volunteers and the curves of the corresponding averaged T1s are displayed in Figure 5. For PC and NAD(H) the fit of the recovery curves had a poor quality (R2 < 0.7), probably because of their low SNR signals at short TRs, which are then difficult to fit properly next to the larger peaks of PE and α‐ATP. Therefore, these T1 curves were not evaluated. T1 curves of all other metabolites were successfully fitted (for α‐ATP: n = 6; and for Piex: n = 4) and resulted in the mean T1 relaxation times as presented in Table 3. Interestingly, the T1 values for Piin and Piex are significantly different (Table 3).
FIGURE 5.
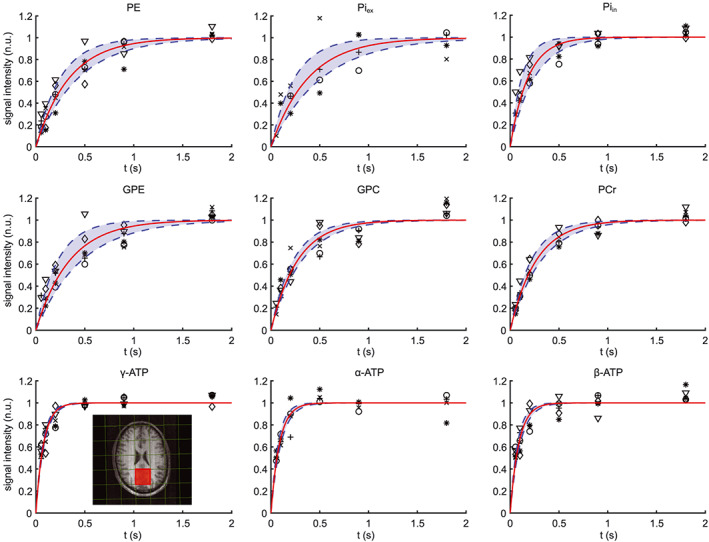
31P signal intensity as a function of TR and fit to determine mean T1 times of 31P spins of nine metabolites in the human brain at 3 T. Markers indicate data points from six volunteers, normalized to the fitted magnetization at thermal equilibrium (M0). Average fit of signal curves are displayed in red, ± the standard deviation (blue area). The inset shows the voxel for which the T1 measurements were performed (red). n.u., normalized units
TABLE 3.
Overview of T1 relaxation times (in seconds) of 31P spin systems of metabolites in the occipito–temporal–parietal (OPT) region of the human brain at field strengths of 1.5–9.4 T. The results of the current study are in bold, which includes the averages of data from 6 or 4(†) volunteers. T1 s of Piex and Piin were significantly different (unpaired Student's t‐test: P = 0.015). T1 values of PC and NAD(H) were not included because in short‐TR spectra the fitting of these resonances could not be performed reliably. Below 3 T no separate T1 times are reported for PE and PC, Piex and Piin, GPE and GPC
| Reference | B 0, T | n | Method | PE | PC | Piex | Piin | GPE | GPC | PCr | γ‐ATP | α‐ATP | NAD+ | β‐ATP | |
|---|---|---|---|---|---|---|---|---|---|---|---|---|---|---|---|
| Luyten et al 24 | 1.5 | ns | IR | ISIS | 2.74 (± 1.04) | 1.47 (± 0.12) | 1.64 (± 0.08) | 3.29 (± 0.53) | 1.36 (± 0.30) | 0.97 (± 0.12) | 1.03 (± 0.36) | ||||
| Roth et al 25 | 1.5 | ns | IR | ISIS | 1.42 (± 0.43) | 1.45 (± 0.26) | 1.32 (± 0.14) | 3.14 (± 0.47) | 0.65 (± 0.15) | 0.85 (± 0.21) | 0.80 (± 0.16) | ||||
| Hubesch et al 26 | 2.0 | 3 | FIR | ISIS | 1.70 (± 0.20) | 1.40 (± 0.40) | 1.30 (± 0.10) | 2.70 (± 0.20) | 0.60 (± 0.00) | 1.00 (± 0.20) | 0.70 (± 0.10) | ||||
| Merboldt et al 27 | 2.0 | 6 | PS | STEAM | 4.00 (± 20%) | 2.50 (± 20%) | 2.00 (± 20%) | 3.00 (± 20%) | 0.70 (± 20%) | 0.70 (± 20%) | 1.00 (± 20%) | ||||
| Klomp et al 28 | 3.0 | 5 | IR | ISIS | 6.67 (± 0.47) | 5.27 (± 1.40) | 7.75 (± 0.94) | 7.03 (± 0.51) | |||||||
| Peeters et al | 3.0 | 6 | PS | SI | 3.42 (± 0.93) | 3.82 (± 1.40)† | 1.84 (± 0.65) | 3.44 (± 1.21) | 2.72 (± 0.45) | 2.66 (± 0.52) | 0. 80 (± 0.08) | 0.88 (± 0.14)† | 0.89 (± 0.14) | ||
| Lu et al 29 | 4.0 | 12 | IR | SC | 4.36 (± 0.25) | ||||||||||
| Chu et al 30 | 4.1 | 5 | IR | SI | 1.59 (± 0.16) | 2.39 (± 0.01) | 0.79 (± 0.11) | ||||||||
| Ren et al 31 | 7.0 | 6 | IR | SC | 6.33 (± 1.10) | 4.31 (± 1.04) | 5.80 (± 1.07) | 3.70 (± 0.46) | 6.79 (± 0.95) | 5.82 (± 0.88) | 3.39 (± 0.17) | 1.70 (± 0.15) | 1.35 (± 0.14) | 2.07 (± 0.13) | 1.13 (± 0.09) |
| Lei et al 32 | 7.0 | 9 | IR | SC | 4.78 (± 0.99) | 3.19 (± 0.49) | 4.06 (± 1.21) | 4.01 (± 1.28) | 3.37 (± 0.29) | 1.27 (± 0.22) | 1.26 (± 0.07) | 1.02 (± 0.12) | |||
| Lu et al 29 | 7.0 | 10 | IR | SC | 3.54 (± 0.21) | ||||||||||
| Pohmann et al 33 | 9.4 | 5 | IR | CH‐AC | 5.13 (± 0.52) | 3.02 (± 0.42) | 3.24 (± 0.26) | 4.17 (± 0.29) | 4.27 (± 0.25) | 2.50 (± 0.03) | 1.46 (± 0.16) | 0. 99 (± 0.13) | 1.52 (± 0.58) | ||
Acquisition methods: IR, inversion recovery; FIR, fast inversion recovery; PS, progressive saturation. Volume selection methods: ISIS, image‐selected in vivo spectroscopy; STEAM, stimulated echo acquisition mode; SI, spectroscopic imaging; SC, surface coil; CH‐AC, two channels of an array coil; n indicates the number of included subjects; ns, not specified.
We compared the T1 relaxation times of this study to values obtained at field strengths from 1.5 to 9.4 T as reported by others 24 , 25 , 26 , 27 , 28 , 29 , 30 , 31 , 32 , 33 , 34 (Table 3) and concluded that all our T1 values are within the range that could be expected from these data. For example, for PCr we found an average T1 of 2.66 ± 0.52 seconds (n = 6), while reported values range from 3.29 seconds at 1.5 T to 2.55 seconds at 9.4 T (Table 3).
4. DISCUSSION
In this work we employed a custom‐built coil setup consisting of a double tuned 1H/31P birdcage transmit/receive coil and a 31P eight‐channel receive‐array insert to demonstrate that, by combining 1H decoupling and 1H‐31P NOE enhancement, high quality whole‐brain 31P MRSI data can be obtained in a clinically feasible measurement time of 13 minutes and within SAR limits. With this setup we determined the 31P resonance linewidth decrease by 1H decoupling, 1H‐31P NOE enhancement and T1 relaxation times of 31P spins of metabolites in the OTP region of the healthy human brain at 3 T. Previously, we reported that with this receive array coil, an average SNR gain factor of 1.4 can be obtained for the whole brain, up to a factor of 3.2 in superficial brain areas. 14 As a result of the improvements in linewidth and SNR we were able to determine, at 3 T with 31P MRSI, the redox state of the brain from the NAD+/NADH ratio, and to observe a peak for Piex.
As there is little data available on T1 relaxation times of 31P spin systems of brain metabolites at 3 T, 28 we determined these times for nearly all detectable metabolites in the 31P spectrum. To obtain spectra with good SNR, we performed progressive saturation experiments in a relatively large MRSI voxel containing both white and gray matter. Our T1 times are comparable with those in a study performed at 2 T also using progressive saturation. 27 We compared our T1 values with those obtained at different field strengths (Table 3). Some variations in T1 values may occur due to the use of different acquisition sequences, number of subjects, and data postprocessing. 34 , 35 In addition, different localization procedures were followed including the use of surface coils only. 29 , 32 Nevertheless, no specific decrease for the T1 values of any of the human brain 31P metabolite spins as a function of field strength is observed up to 9.4 T (Figure 6, Table 3). For example, the average T1 (± SEM) of PCr at 1.5–2.0 T is 3.0 ± 0.1 seconds, at 3.0–4.1 T it is 3.3 ± 0.5 seconds, and at 7.0–9.4 T it is 3.1 ± 0.3 seconds. And for α‐ATP spins the average T1 is 0.9 ± 0.1 seconds at 1.5–2.0 T and 1.1 ± 0.2 seconds at 7.0–9.4 T. A similar observation was made earlier, 36 but a more recent report on PCr and ATP in human and rat brain suggested a decrease in T1 from 4 to 16.4 T. 29
FIGURE 6.
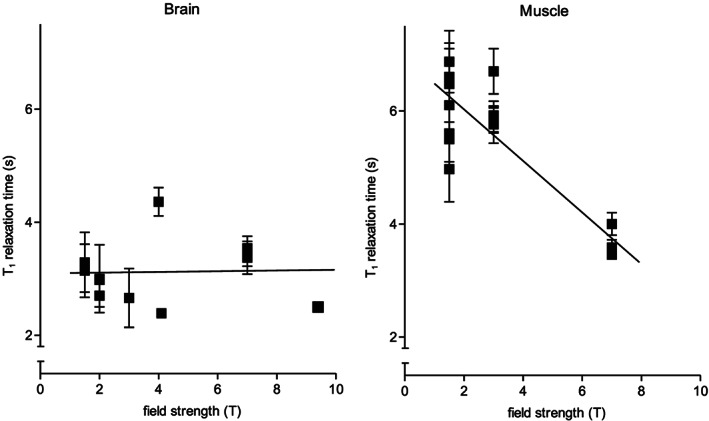
T1 relaxation times of PCr as a function of the main magnetic field strength from 1.5 to 9.4 T in the occipito–temporal–parietal (OTP) region of the human brain (left) and from 1.5 to 7 T in the human tibialis anterior and gastrocnemius muscle (right). For convenience, we performed linear regression, which is indicated by solid lines (brain: slope = 0.006 s/T; and muscle: slope = −0.456 s/T, P (slope ≠ 0) < 0.001)
These observations are in contrast to the reported T1 values of 31P spins of all phosphorylated metabolites for which resonances are observed in 31P MR spectra of skeletal muscles. At 1.5 T these spin systems have longer T1 values than the corresponding spin systems in the brain, and they decline significantly at increasing field strengths up to 7 T. For example, the reported T1 relaxation time of PCr in human calf muscle or tibialis anterior is 5.0–6.9 seconds at 1.5–3 T and decreases to 3.5–4.0 seconds at 7 T (Figure 6). 24 , 25 , 35 , 37 , 38 , 39 , 40 , 41
The T1 times of metabolite 31P spin systems are considered to be determined by dipolar and chemical shift anisotropy (CSA) relaxation mechanisms. 1 As CSA relaxation is proportional to the square of the magnetic field strength and dipolar relaxation decreases as a function of the field strength, it is generally assumed that in T1 relaxation of 31P spins in muscles that CSA becomes dominant from 1.5 to 7 T. 35 This is clearly not the case in the brain. In general, T1 relaxation of 31P spins is a complicated function of rotational correlation times, dipolar relaxation rates, CSA relaxation and chemical exchange rates. 42 If we assume that the rotational correlation time is comparable for all metabolites, then dipolar relaxation is most likely the dominant contribution to the T1 times of 31P spins in brain. Or a balance exists between decreasing dipolar and increasing CSA relaxation rates between 1.5 and 9.4 T, resulting in virtually unaffected T1 values for this range of field strengths.
As T1s of polyphosphates (eg, ATP) are much shorter than those of monophosphates (PME, PDE) at 7 T, it was suggested that the mechanism of 31P‐31P dipolar interactions rather than CSA is important in T1 relaxation of brain metabolite 31P spins at this field strength. 31 In addition, trace amounts of divalent paramagnetic ions such as Mn2+ can form complexes with ATP, which could also contribute to the shorter T1 values of its phosphates. 1 Because the γ‐phosphate of γ‐ATP is in chemical exchange with those of PCr and Piin, the T1 relaxation times of each of these 31P components will be the fractional weighted average of the T1 values and relative tissue levels of the exchanging partners, which is different between brain and muscle.
Because there is also limited quantitative steady‐state 1H‐31P NOE enhancement data available for 31P spins in the brain at 3 T, we also determined these. The steady‐state NOE enhancement was largest for PME and PDE (up to ~ 50%), whereas the effect on ATP was the smallest (~ 15%). Interestingly, NOE values at 3 T were comparable with those at 7 T, ie, for most evaluated metabolites we found similar to slightly higher enhancements. 21 , 32 Moreover, NOE enhancement of PCr in our study is comparable with the measured enhancement at 1.5 T (~ 30%). 23 As these NOEs depend on dipolar relaxation, this would imply that T1 values of 31P metabolites essentially remain the same between 1.5 and 7 T, as was concluded above. In muscles, the 1H‐31P NOE enhancement of PCr decreases from 64–75% at 1.5–3 T to 35% at 7 T, 38 , 43 indicating that in muscles CSA is important. In confirmation we observed a decrease in 31P‐31P NOE of ATP phosphates in skeletal muscles from 3 to 7 T (unpublished results). All these observations strongly indicate that CSA plays a dominant role in T1 relaxation of 31P metabolite spins in muscle but not in the brain with increasing field strength.
NOE enhancement can increase the reproducibility of measuring 31P resonances, 21 but, as for T1 relaxation times, has to be taken into account in the quantification of metabolite ratios or tissue levels, in particular if NOEs are expected to be affected by changes in tissue condition.
By means of 1H decoupling the linewidth of resonances of proton‐coupled phosphates measured at 3 T decreased, roughly in agreement with the value of the three‐bond 1H‐31P J‐coupling of the compounds involved. 1 This decoupling also increased the SNR of the compound resonances. A higher main magnetic field is commonly expected to improve spectral resolution and SNR. The field strength dependence of spectral resolution in 31P MRS of the brain has been studied in detail by Lu et al. 29 The linewidth we find for PCr at 3 T (~ 0.14 ppm, 7.3 Hz) fits to the field strength dependency presented in that study, in which the PCr linewidth in ppm is shown to decrease to ~ 0.1 ppm in the occipital brain region at 7 T. For the two resolved 31P‐31P coupled resonances of α‐ATP, we find for each peak a linewidth of ~ 17 Hz at 3 T. At field strengths of 4 T or higher these are not resolved anymore because the absolute linewidths exceed the 31P‐31P J‐coupling constant of 16–17 Hz. 44 If we take a coupling constant of 16 Hz into account, the total linewidth of the α‐ATP peak is ~ 33 Hz, which is in agreement with the data reported in Lu et al. 29 Even although linewidths in ppm, and thus spectral resolution, improve somewhat at 7 T and higher field strengths compared with 3 T, 29 all resonances identified in spectra at 7 T can also be separately assessed at 3 T using 1H decoupling. For example, resonances for PE, PC and GPE and GPC are well resolved, and we also show that at sufficient SNR an additional phosphate peak can be detected at ~ 5.3 ppm. This Piex is assumed to arise from an extracellular compartment (eg, blood) and may be employed to assess brain diseases. 20 , 45 We observed that the T1 of Piin is shorter than that of Piex, which has been attributed to the involvement of Piin in chemical exchange with the γ‐ATP phosphate, which is subjected to efficient dipolar relaxation. 31
It has been demonstrated that NADH and NAD+ can be separately quantified at 4 T using 1H decoupling, with the suggestion that this should also be possible at 3 T. 2 Indeed, we observed that the two 31P doublets of NAD+ can be analyzed separately from the 31P peak of NADH at 3 T when employing 1H decoupling and NOE, even for MRSI with voxel volumes that are several times smaller than the detection volume employed in the study at 4 T. With the assumptions of equal linewidths and fixed chemical shift difference between NAD+ and NADH, our calculated NAD+ and NADH tissue concentrations and redox ratios are comparable with those observed at 4 and 7 T. 2 , 31 These concentrations, and that of Piex, can be determined more accurately by measuring larger voxels for better SNR, as is commonly done in studies at higher fields. 2 , 20 NAD(H) quantification could be further refined by including resonances of uridine diphosphate glucose (UDPG), of which one phosphate co‐resonates with those of the NAD(H) phosphates. 46 , 47 However, larger voxels and/or longer measurement times than employed in the current 3 T study are needed for proper detection of the UDPG signals.
A potential problem for quantitation of the GPC and GPE resonance at 3 T is a broad signal from immobile phosphates centered at ~ 2.25 ppm. This signal broadens at higher fields to become part of the spectral baseline, but its visibility may be of interest in certain conditions. 48 As its linewidth is much larger than that of the other 31P resonances, it is easy to separate it from these resonances by either fitting or filtering.
The increased intrinsic SNR of fields higher than 3 T is obviously an advantage, but the assumed additional benefit of shorter T1s and thus faster repetition times does not seem to count for 31P MRS of the brain, at least up to 7 T. Additionally, NOE effects at 3 T are comparable with those at 7 T. 21 , 32 Furthermore, inhomogeneous 1H transmit fields may complicate the application of 1H‐31P NOE and 1H decoupling techniques for the whole brain at higher fields, and SAR limitations may require longer repetition times for additional 1H irradiation. Therefore, we conclude that when the best possible spatial resolution is not a premium requirement for localized 31P MRS, its performance at 3 T using a phased array receive with 1H decoupling and NOE is an excellent and more accessible alternative to 31P MRS at 7 T and higher. Further improvements of 31P MRSI are expected to be possible, eg, by speeding up data acquisition using compressed sensing methods, and by advanced data reconstructions. 49 , 50
ACKNOWLEDGEMENTS
The study was partly funded by the provinces Overijssel and Gelderland with EFRO 2011‐020637. We thank Prof. C. W. Hilbers for valuable discussions and E. W. J. Phillips for assistance with the calculation of effective voxel volumes.
Peeters TH, van Uden MJ, Rijpma A, Scheenen TWJ, Heerschap A. 3D 31P MR spectroscopic imaging of the human brain at 3 T with a 31P receive array: An assessment of 1H decoupling, T1 relaxation times, 1H‐31P nuclear Overhauser effects and NAD+ . NMR in Biomedicine. 2021;34:e4169. 10.1002/nbm.4169
REFERENCES
- 1. de Graaf RA. In Vivo NMR Spectroscopy: Principles and Techniques. Third ed. Chichester, England: John Wiley & Sons Ltd; 2018. [Google Scholar]
- 2. Lu M, Zhu X‐H, Chen W. In vivo 31 P MRS assessment of intracellular NAD metabolites and NAD+/NADH redox state in human brain at 4 T. NMR Biomed. 2016;29:1010‐1017. [DOI] [PMC free article] [PubMed] [Google Scholar]
- 3. Hattingen E, Bähr O, Rieger J, Blasel S, Steinbach J, Pilatus U. Phospholipid metabolites in recurrent glioblastoma: in vivo markers detect different tumor phenotypes before and under antiangiogenic therapy. PLoS ONE. 2013;8:e56439. [DOI] [PMC free article] [PubMed] [Google Scholar]
- 4. Pettegrew JW, Panchalingam K, Klunk WE, McClure RJ, Muenz LR. Alterations of cerebral metabolism in probable Alzheimer's disease: a preliminary study. Neurobiol Aging. 1994;15:117‐132. [DOI] [PubMed] [Google Scholar]
- 5. Rango M, Bonifati C, Bresolin N. Parkinson's disease and brain mitochondrial dysfunction: a functional phosphorus magnetic resonance spectroscopy study. J Cereb Blood Flow Metab. 2006;26:283‐290. [DOI] [PubMed] [Google Scholar]
- 6. Grond J, Gerson JR, Laxer KD, Hugg JW, Matson GB, Weiner MW. Regional distribution of interictal 31P metabolic changes in patients with temporal lobe epilepsy. Epilepsia. 1998;39:527‐536. [DOI] [PMC free article] [PubMed] [Google Scholar]
- 7. Weber‐Fahr W, Englisch S, Esser A, et al. Altered phospholipid metabolism in schizophrenia: a phosphorus 31 nuclear magnetic resonance spectroscopy study. Psychiatry Res Neuroimaging. 2013;214:365‐373. [DOI] [PubMed] [Google Scholar]
- 8. Rijpma A, van der Graaf M, Meulenbroek O, Olde Rikkert MGM, Heerschap A. Altered brain high‐energy phosphate metabolism in mild Alzheimer's disease: a 3‐dimensional 31P MR spectroscopic imaging study. NeuroImage Clin. 2018;18:254‐261. [DOI] [PMC free article] [PubMed] [Google Scholar]
- 9. Oz G, Alger JR, Barker PB, et al. Clinical proton MR spectroscopy in central nervous system disorders. Radiology. 2014;270:658‐679. [DOI] [PMC free article] [PubMed] [Google Scholar]
- 10. van de Bank BL, Orzada S, Smits F, et al. Optimized 31P MRS in the human brain at 7 T with a dedicated RF coil setup. NMR Biomed. 2015;28:1570‐1578. [DOI] [PMC free article] [PubMed] [Google Scholar]
- 11. Greenman RL, Rakow‐Penner R. Evaluation of the RF field uniformity of a double‐tuned 31P/1H birdcage RF coil for spin‐echo MRI/MRS of the diabetic foot. J Magn Reson Imaging. 2005;22:427‐432. [DOI] [PubMed] [Google Scholar]
- 12. Matson GB, Vermathen P, Hill TC. A practical double‐tuned 1H/31P quadrature birdcage headcoil optimized for 31P operation. Magn Reson Med. 1999;42:173‐182. [DOI] [PubMed] [Google Scholar]
- 13. Avdievich NI, Hetherington HP. 4 T Actively detuneable double‐tuned 1H/31P head volume coil and four‐channel 31P phased array for human brain spectroscopy. J Magn Reson. 2007;186:341‐346. [DOI] [PMC free article] [PubMed] [Google Scholar]
- 14. van Uden MJ, Peeters TH, Rijpma A, Rodgers CT, Heerschap A, Scheenen TWJ. An 8‐channel receive array for improved 31 P MRSI of the whole brain at 3 T. Magn Reson Med. 2019;82:825‐832. [DOI] [PMC free article] [PubMed] [Google Scholar]
- 15. Luyten PR, Bruntink G, Sloff FM, et al. Broadband proton decoupling in human 31P NMR spectroscopy. NMR Biomed. 1989;1:177‐183. [DOI] [PubMed] [Google Scholar]
- 16. Bachert‐Baumann P, Ermark F, Zabel HJ, Sauter R, Semmler W, Lorenz WJ. In vivo nuclear Overhauser effect in 31P‐(1H) double‐resonance experiments in a 1.5‐T whole‐body MR system. Magn Reson Med. 1990;15:165‐172. [DOI] [PubMed] [Google Scholar]
- 17. Pohmann R, Von Kienlin M. Accurate phosphorus metabolite images of the human heart by 3D acquisition‐weighted CSI. Magn Reson Med. 2001;45:817‐826. [DOI] [PubMed] [Google Scholar]
- 18. Brown MA. Time‐domain combination of MR spectroscopy data acquired using phased‐array coils. Magn Reson Med. 2004;52:1207‐1213. [DOI] [PubMed] [Google Scholar]
- 19. Lu M, Zhu XH, Zhang Y, Chen W. Intracellular redox state revealed by in vivo 31P MRS measurement of NAD+ and NADH contents in brains. Magn Reson Med. 2014;71:1959‐1972. [DOI] [PMC free article] [PubMed] [Google Scholar]
- 20. Ren J, Shang T, Sherry AD, Malloy CR. Unveiling a hidden 31P signal coresonating with extracellular inorganic phosphate by outer‐volume‐suppression and localized 31P MRS in the human brain at 7 T. Magn Reson Med. 2018;80:1289‐1297. [DOI] [PMC free article] [PubMed] [Google Scholar]
- 21. Lagemaat MW, van de Bank BL, Sati P, Li S, Maas MC, Scheenen TW. Repeatability of 31P MRSI in the human brain at 7 T with and without the nuclear Overhauser effect. NMR Biomed. 2016;29:256‐263. [DOI] [PMC free article] [PubMed] [Google Scholar]
- 22. Du F, Zhu XH, Qiao H, Zhang X, Chen W. Efficient in vivo 31P magnetization transfer approach for noninvasively determining multiple kinetic parameters and metabolic fluxes of ATP metabolism in the human brain. Magn Reson Med. 2007;57:103‐114. [DOI] [PubMed] [Google Scholar]
- 23. Murphy‐Boesch J, Stoyanova R, Srinivasan R, et al. Proton‐decoupled 31P chemical shift imaging of the human brain in normal volunteers. NMR Biomed. 1993;6:173‐180. [DOI] [PubMed] [Google Scholar]
- 24. Luyten PR, Groen JP, Vermeulen JWAH, den Hollander JA. Experimental approaches to image localized human 31P NMR spectroscopy. Magn Reson Med. 1989;11:1‐21. [DOI] [PubMed] [Google Scholar]
- 25. Roth K, Hubesch B, Meyerhoff DJ, et al. Noninvasive quantitation of phosphorus metabolites in human tissue by NMR spectroscopy. J Magn Reson. 1989;81:299‐311. [Google Scholar]
- 26. Hubesch B, Sappey‐Marinier D, Roth K, Meyerhoff DJ, Matson GB, Weiner MW. P‐31 MR spectroscopy of normal human brain and brain tumors. Radiology. 1990;174:401‐409. [DOI] [PubMed] [Google Scholar]
- 27. Merboldt KD, Chien D, Hanicke W, Gyngell ML, Bruhn H, Frahm J. Localized P‐31 NMR‐spectroscopy of the adult human brain in vivo using stimulated‐echo (steam) sequences. J Magn Reson. 1990;89:343‐361. [Google Scholar]
- 28. Klomp DWJ, Wijnen JP, Scheenen TWJ, Heerschap A. Efficient 1H to 31P polarization transfer on a clinical 3 T MR system. Magn Reson Med. 2008;60:1298‐1305. [DOI] [PubMed] [Google Scholar]
- 29. Lu M, Chen W, Zhu XH. Field dependence study of in vivo brain 31P MRS up to 16.4 T. NMR Biomed. 2014;27:1135‐1141. [DOI] [PMC free article] [PubMed] [Google Scholar]
- 30. Chu WJ, Mason GF, Hetherington HP. Phosphorus metabolic differences in gray and white matter: 31P NMR spectroscopic imaging studies of human brain at 4 T. In: Proceedings of the 5th Annual Meeting of ISMRM,. Vancouver, Canada; 1997.
- 31. Ren J, Sherry AD, Malloy CR. 31 P‐MRS of healthy human brain: ATP synthesis, metabolite concentrations, pH, and T 1 relaxation times. NMR Biomed. 2015;28:1455‐1462. [DOI] [PMC free article] [PubMed] [Google Scholar]
- 32. Lei H, Zhu X‐H, Zhang X‐L, Ugurbil K, Chen W. In vivo 31P magnetic resonance spectroscopy of human brain at 7 T: an initial experience. Magn Reson Med. 2003;49:199‐205. [DOI] [PubMed] [Google Scholar]
- 33. Pohmann R, Raju S, Scheffler K. T1 values of phosphorus metabolites in the human visual cortex at 9.4 T. In: Proc Intern Soc Magn Reson Med. Paris; 2018:3394.
- 34. Bojorquez JZ, Bricq S, Acquitter C, Brunotte F, Walker PM, Lalande A. What are normal relaxation times of tissues at 3 T? Magn Reson Imaging. 2017;35:69‐80. [DOI] [PubMed] [Google Scholar]
- 35. Bogner W, Chmelik M, Schmid AI, Moser E, Trattnig S, Gruber S. Assessment of 31 P relaxation times in the human calf muscle: a comparison between 3 T and 7 T in vivo. Magn Reson Med. 2009;62:574‐582. [DOI] [PubMed] [Google Scholar]
- 36. Qiao H, Zhang X, Zhu XH, Du F, Chen W. In vivo 31P MRS of human brain at high/ultrahigh fields: a quantitative comparison of NMR detection sensitivity and spectral resolution between 4 T and 7 T. Magn Reson Imaging. 2006;24:1281‐1286. [DOI] [PMC free article] [PubMed] [Google Scholar]
- 37. Buchthal SD, Thoma WJ, Taylor JS, Nelson SJ, Brown TR. In vivo1 values of phosphorus metabolites in human liver and muscle determined at 1.5 T by chemical shift imaging. NMR Biomed. 1989;2:298‐304. [DOI] [PubMed] [Google Scholar]
- 38. Brown TR, Stoyanova R, Greenberg T, Srinivasan R, Murphy‐Boesch J. NOE enhancements and T1 relaxation times of phosphorylated metabolites in human calf muscle at 1.5 Tesla. Magn Reson Med. 1995;33:417‐421. [DOI] [PubMed] [Google Scholar]
- 39. Thomsen C, Jensen KE, Henriksen O. In vivo measurements of T1 relaxation times of 31P‐metabolites in human skeletal muscle. Magn Reson Imaging. 1989;7:231‐234. [DOI] [PubMed] [Google Scholar]
- 40. Newcomer BR, Boska MD. T1 measurements of 31P metabolites in resting and exercising human gastrocnemius/soleus muscle at 1.5 Tesla. Magn Reson Med. 1999;41:486‐494. [DOI] [PubMed] [Google Scholar]
- 41. Parasoglou P, Xia D, Chang G, Regatte RR. 3D‐mapping of phosphocreatine concentration in the human calf muscle at 7 T: comparison to 3 T. Magn Reson Med. 2013;70:1619‐1625. [DOI] [PMC free article] [PubMed] [Google Scholar]
- 42. Nabuurs C, Huijbregts B, Wieringa B, Hilbers CW, Heerschap A. 31P saturation transfer spectroscopy predicts differential intracellular macromolecular association of ATP and ADP in skeletal muscle. J Biol Chem. 2010;285:39588‐39596. [DOI] [PMC free article] [PubMed] [Google Scholar]
- 43. Rink K, Berger MC, Korzowski A, et al. Nuclear‐Overhauser‐enhanced MR imaging of 31P‐containing metabolites: multipoint‐Dixon vs. frequency‐selective excitation. Magn Reson Imaging. 2015;33:1281‐1289. [DOI] [PubMed] [Google Scholar]
- 44. Jung WI, Staubert A, Widmaier S, et al. Phosphorus J‐coupling constants of ATP in human brain. Magn Reson Med. 1997;37:802‐804. [DOI] [PubMed] [Google Scholar]
- 45. Novak J, Wilson M, MacPherson L, Arvanitis TN, Davies NP, Peet AC. Clinical protocols for 31P MRS of the brain and their use in evaluating optic pathway gliomas in children. Eur J Radiol. 2014;83:e106‐e112. [DOI] [PMC free article] [PubMed] [Google Scholar]
- 46. de Graaf RA, De Feyter HM, Brown PB, Nixon TW, Rothman DL, Behar KL. Detection of cerebral NAD+ in humans at 7 T. Magn Reson Med. 2017;78:828‐835. [DOI] [PMC free article] [PubMed] [Google Scholar]
- 47. Xin L, Ipek Ö, Beaumont M, et al. Nutritional ketosis increases NAD+/NADH ratio in healthy human brain: an in vivo study by 31P‐MRS. Front Nutr. 2018;5:1‐8. [DOI] [PMC free article] [PubMed] [Google Scholar]
- 48. van der Kemp WJ, Stehouwer BL, Runge JH, et al. Glycerophosphocholine and glycerophosphoethanolamine are not the main sources of the in vivo 31P MRS phosphodiester signals from healthy fibroglandular breast tissue at 7 T. Front Oncol. 2016;6:29. [DOI] [PMC free article] [PubMed] [Google Scholar]
- 49. Nassirpour S, Chang P, Kirchner T, Henning A. Over‐discretized SENSE reconstruction and B 0 correction for accelerated non‐lipid‐suppressed 1 H FID MRSI of the human brain at 9.4 T. NMR Biomed. 2018;31:e4014. [DOI] [PubMed] [Google Scholar]
- 50. Santos‐Díaz A, Noseworthy MD. Comparison of compressed sensing reconstruction algorithms for 31P magnetic resonance spectroscopic imaging. Magn Reson Imaging. 2019;59:88‐96. [DOI] [PubMed] [Google Scholar]