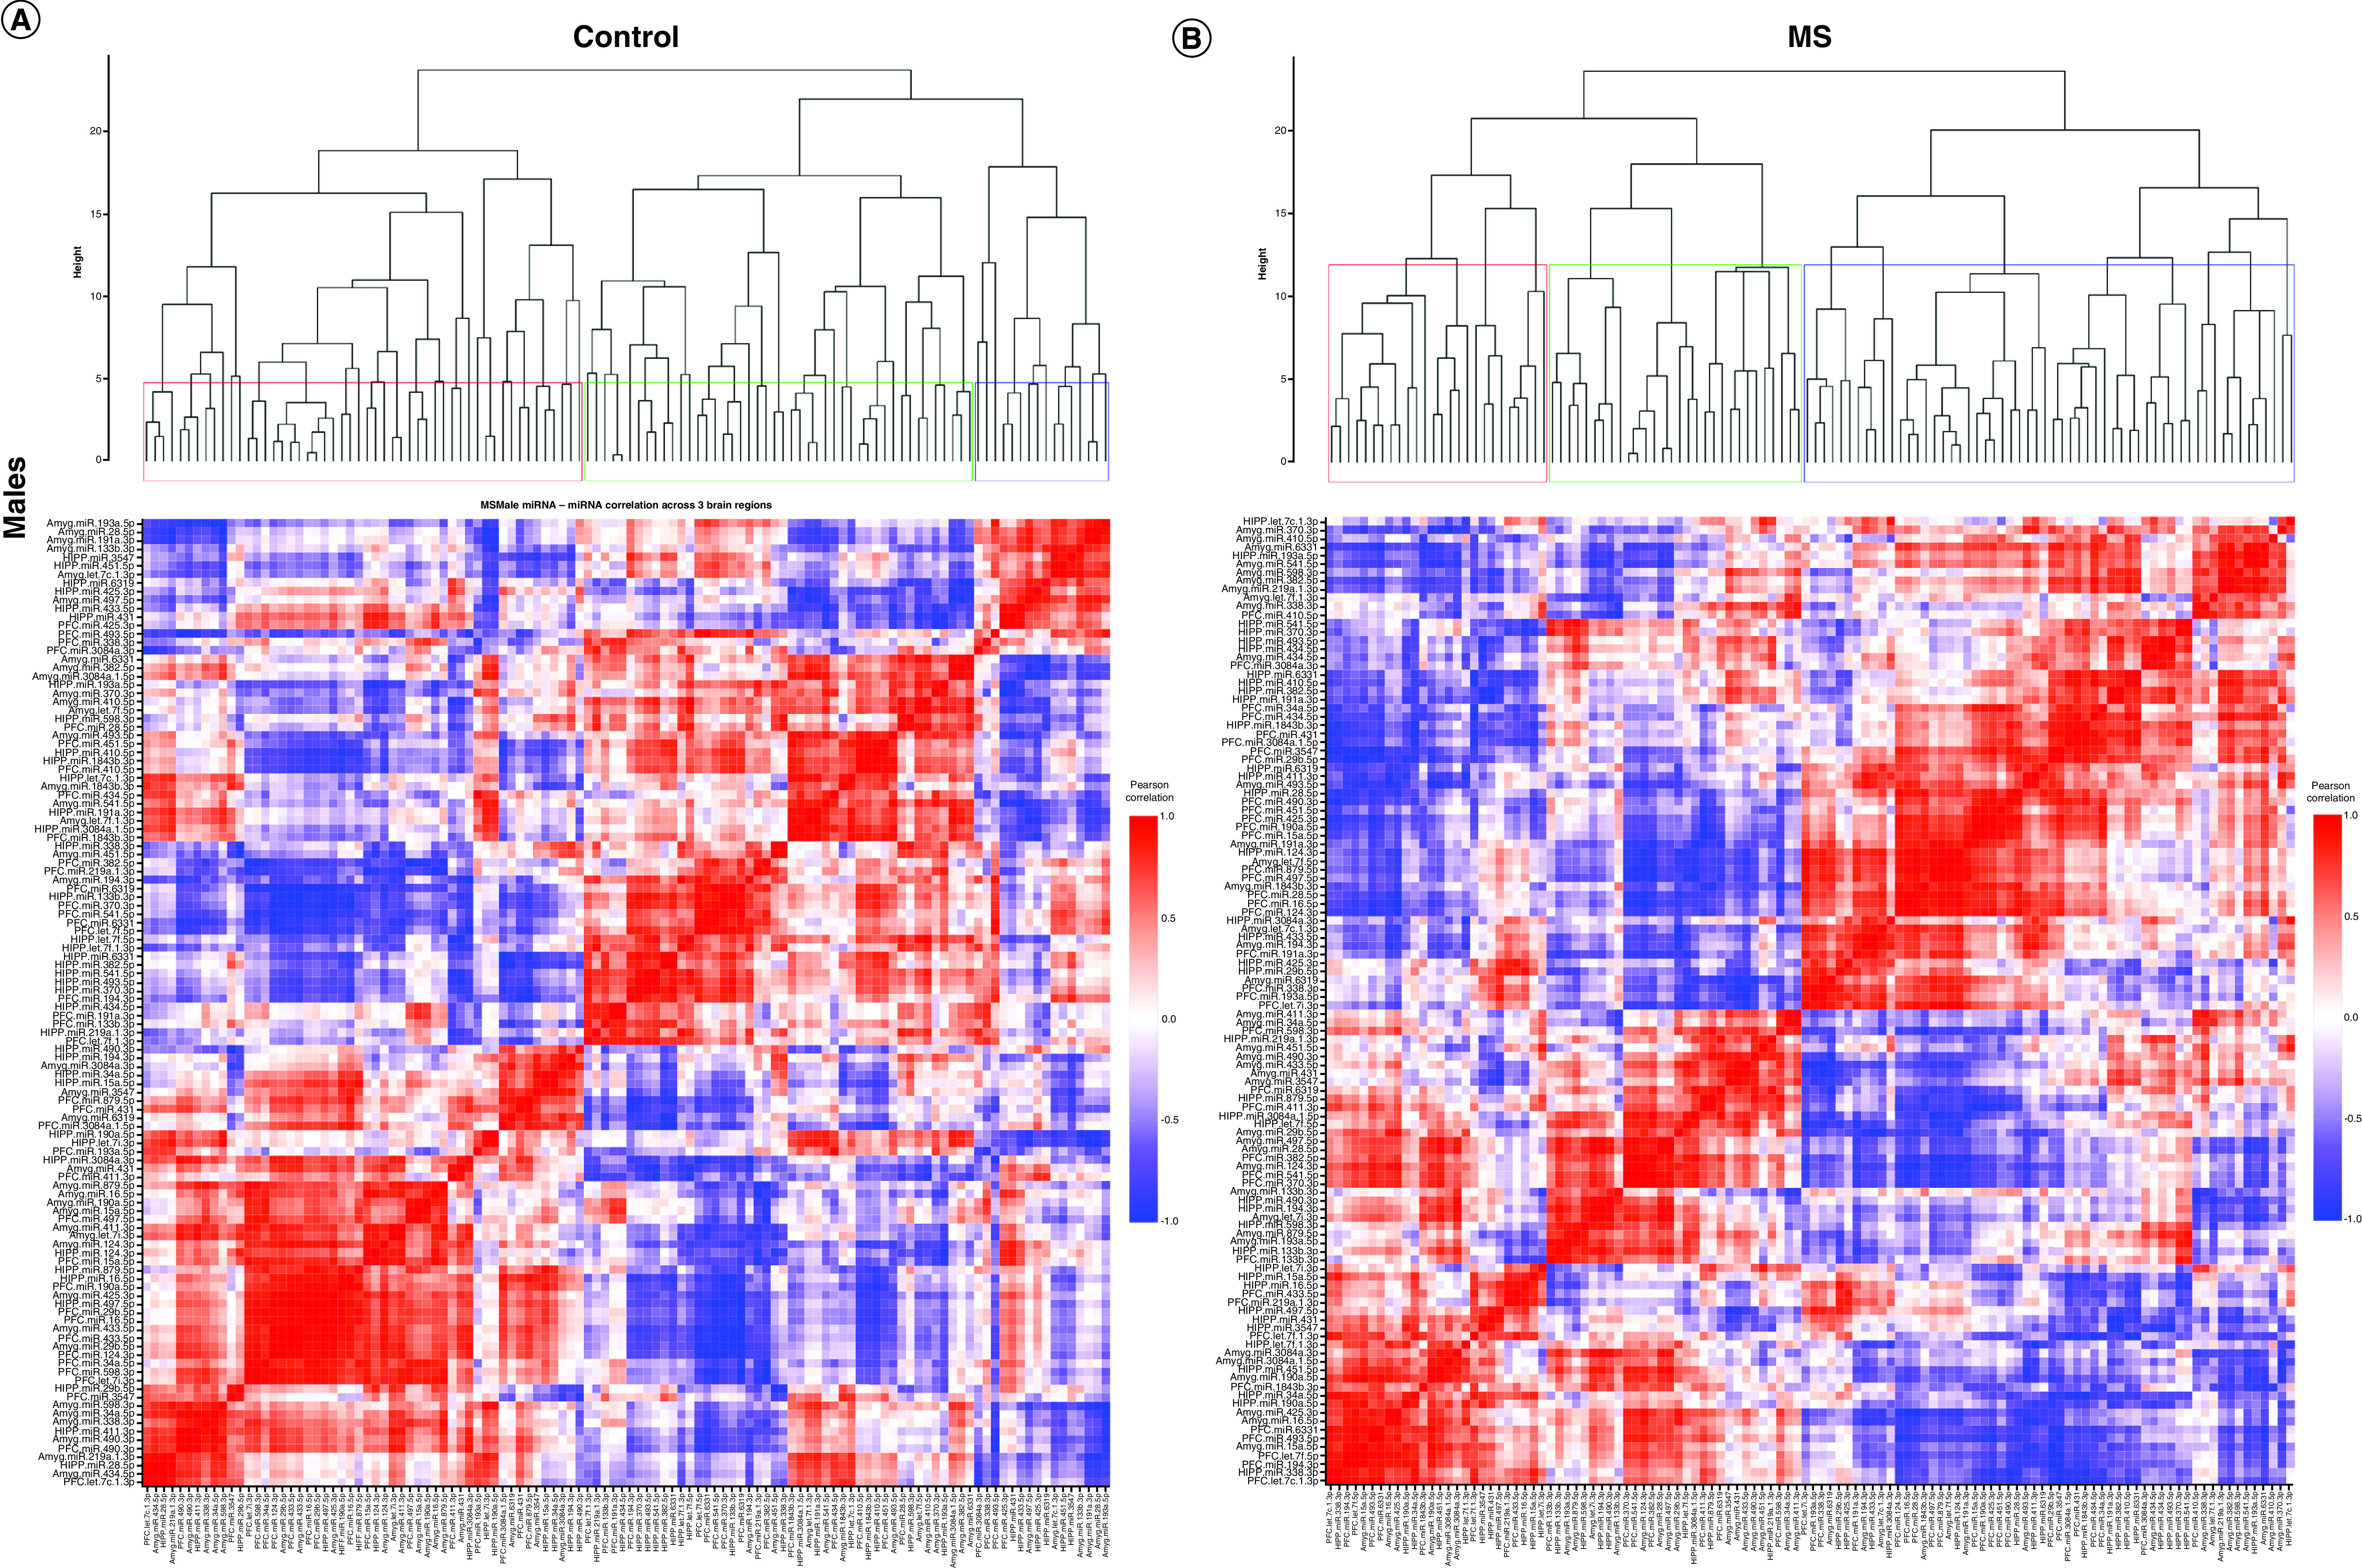
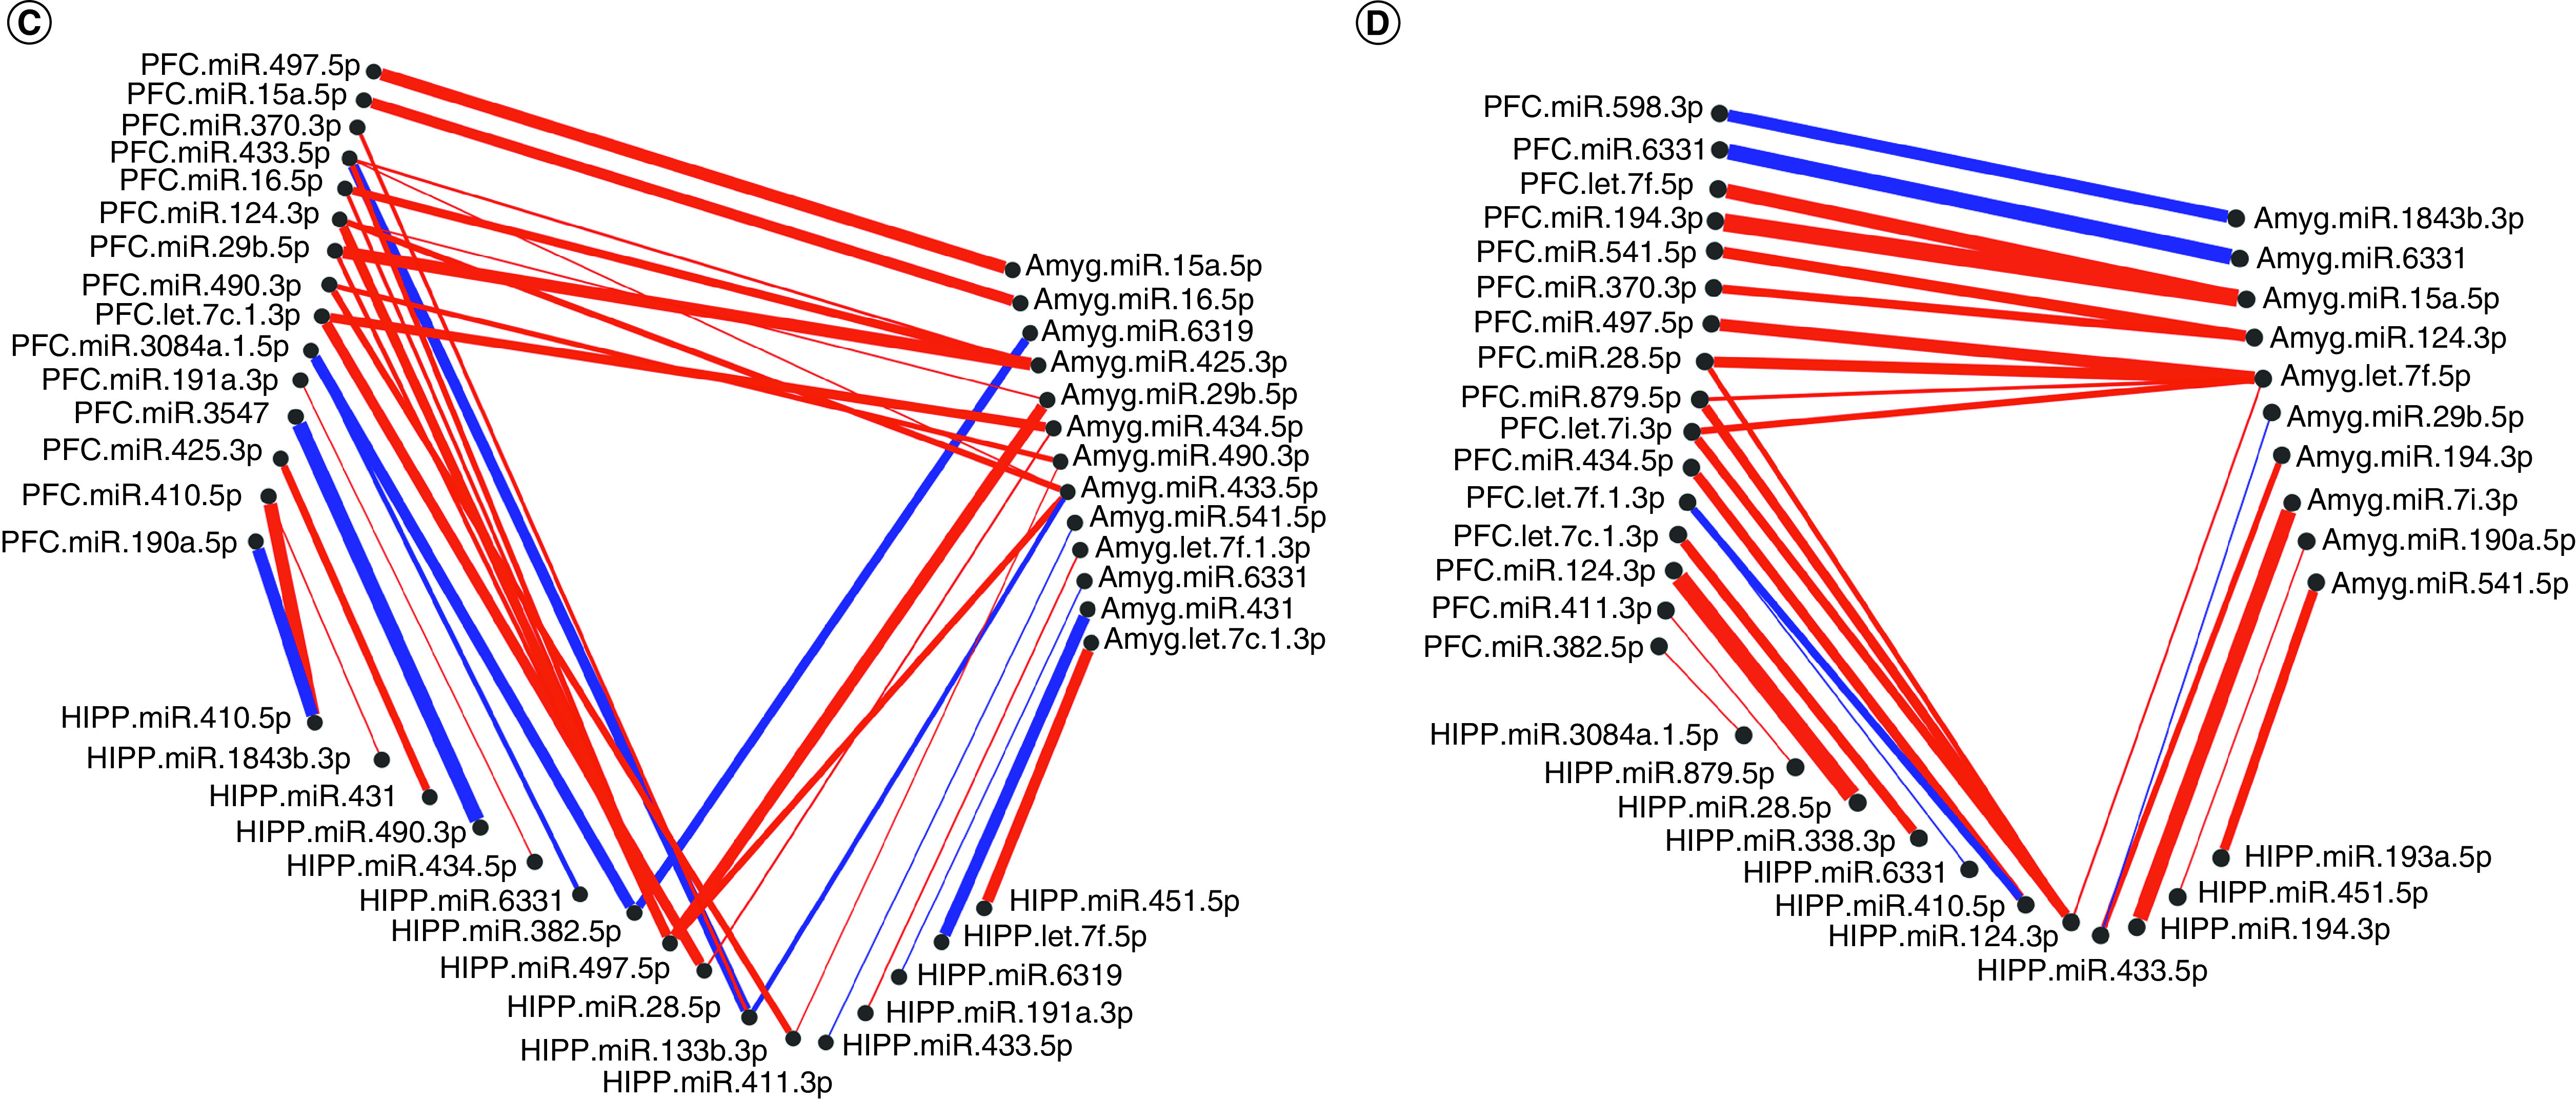
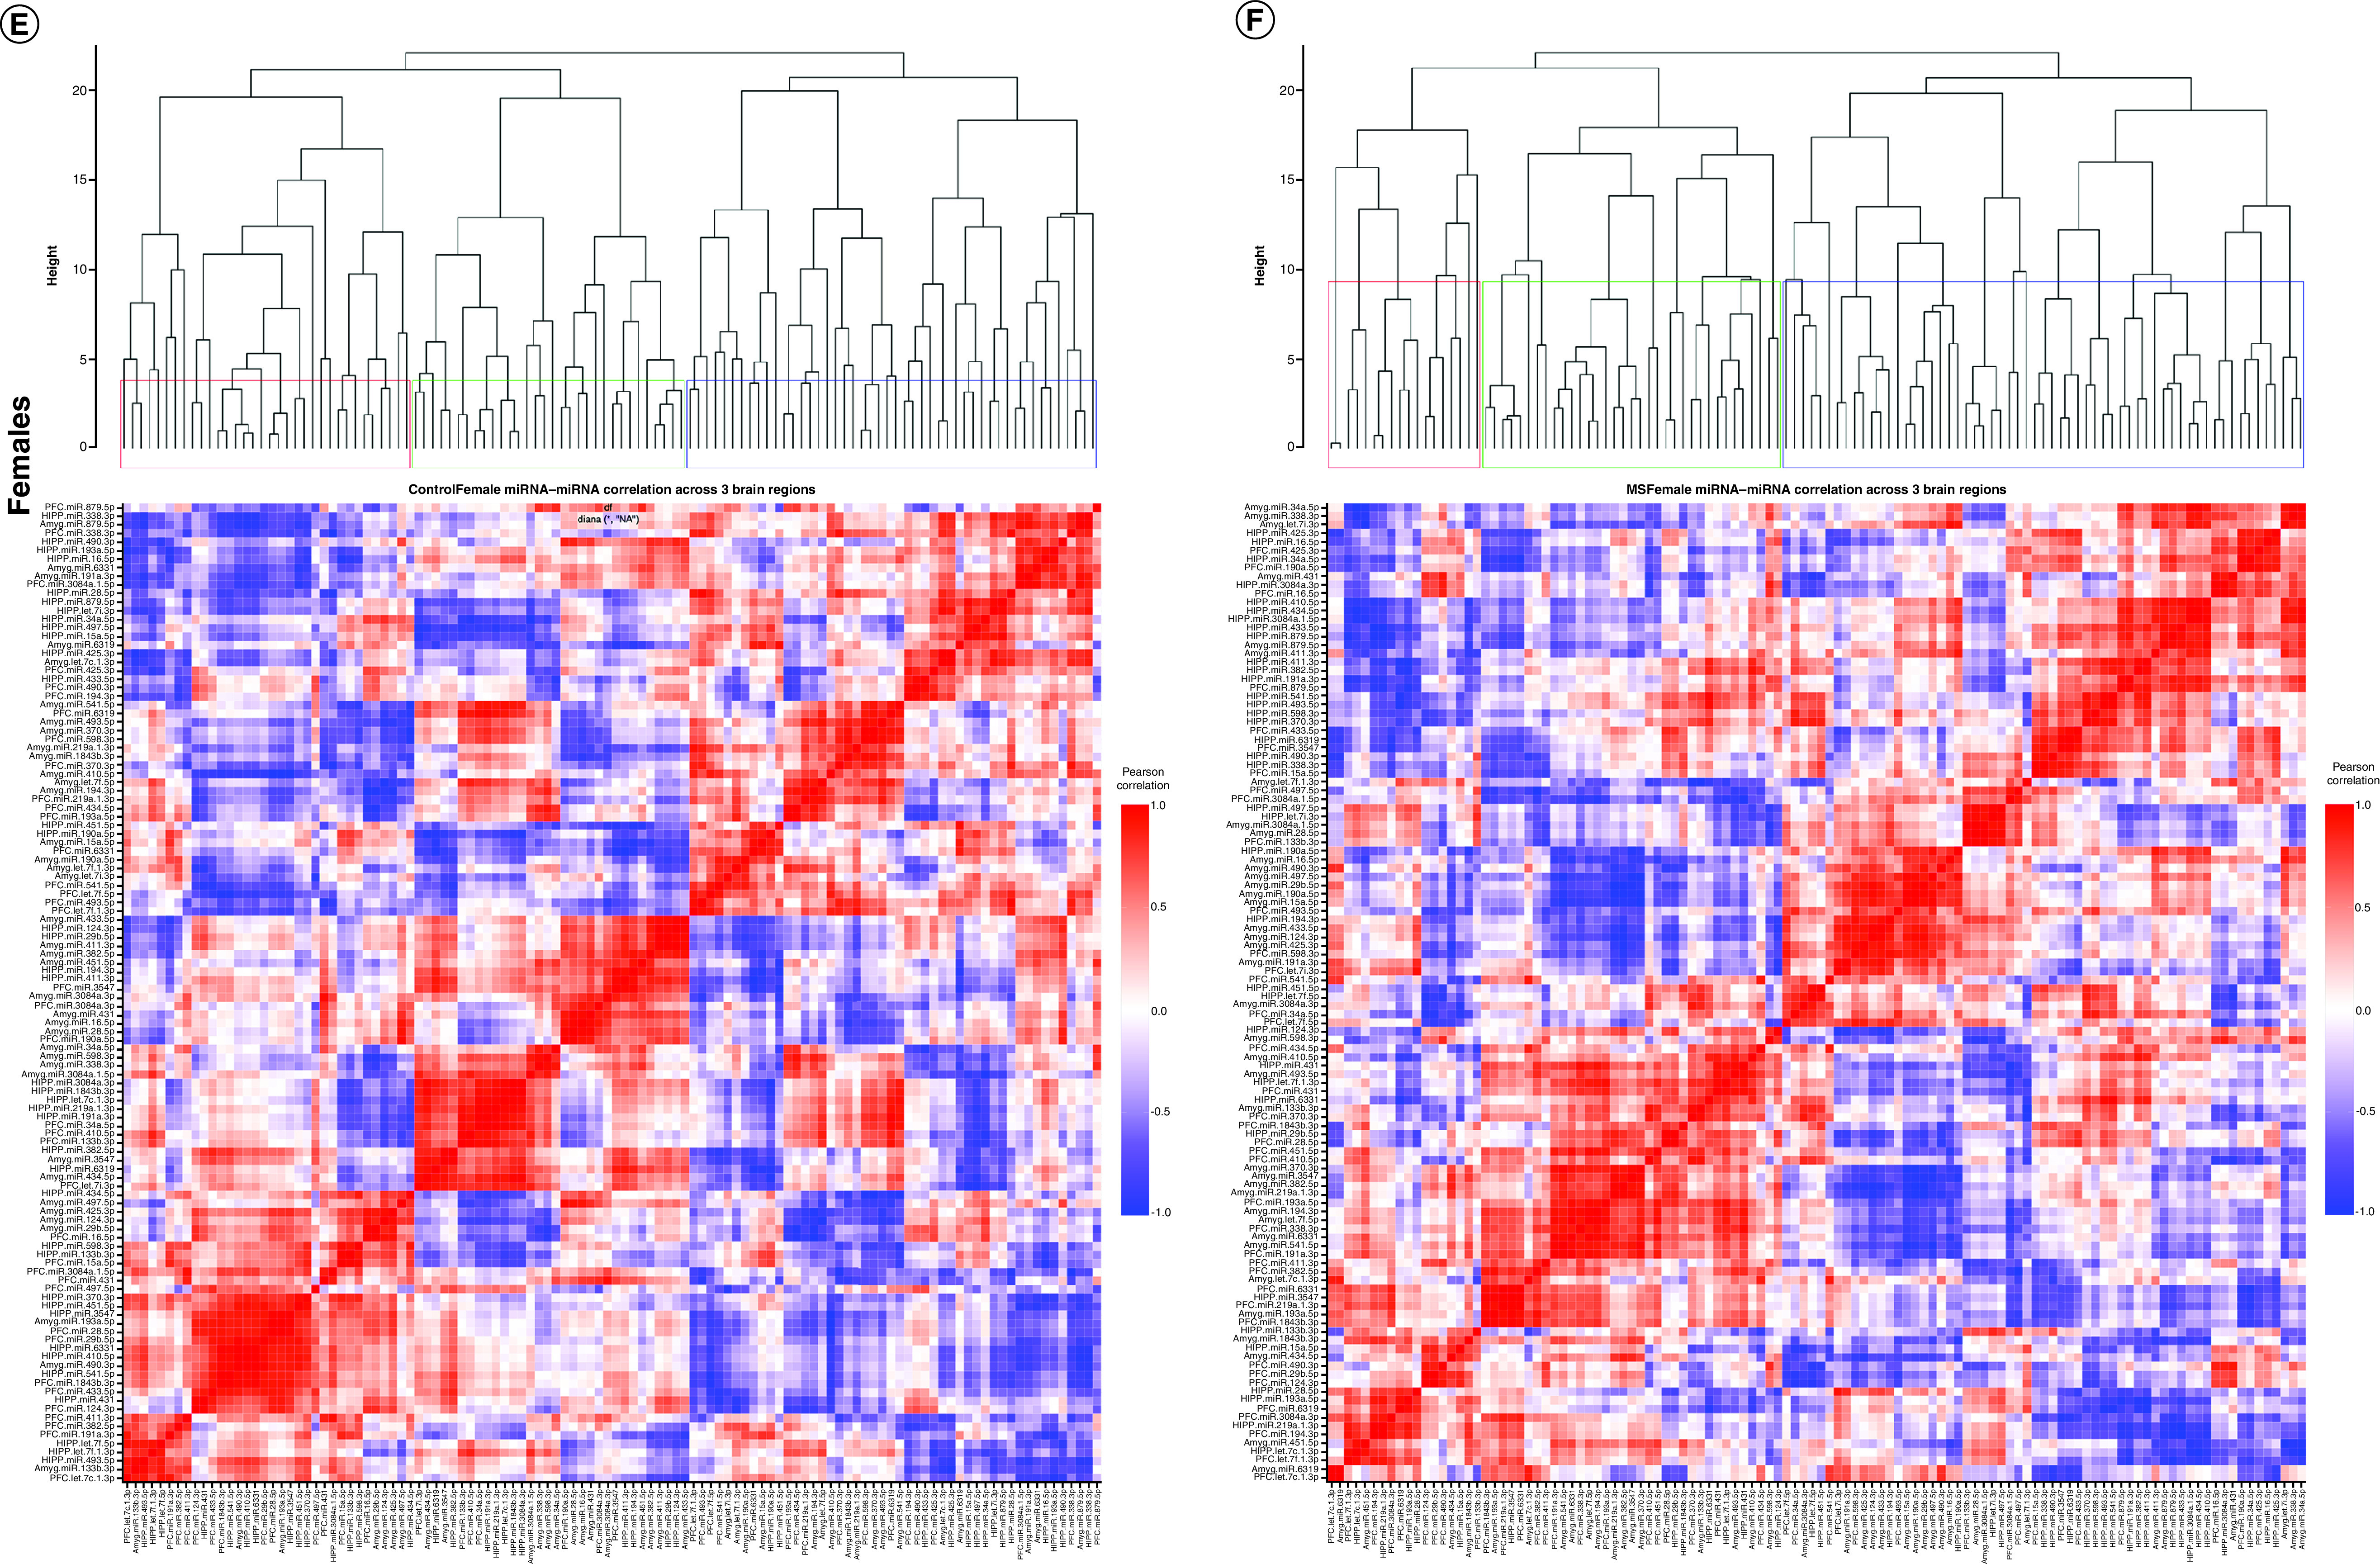
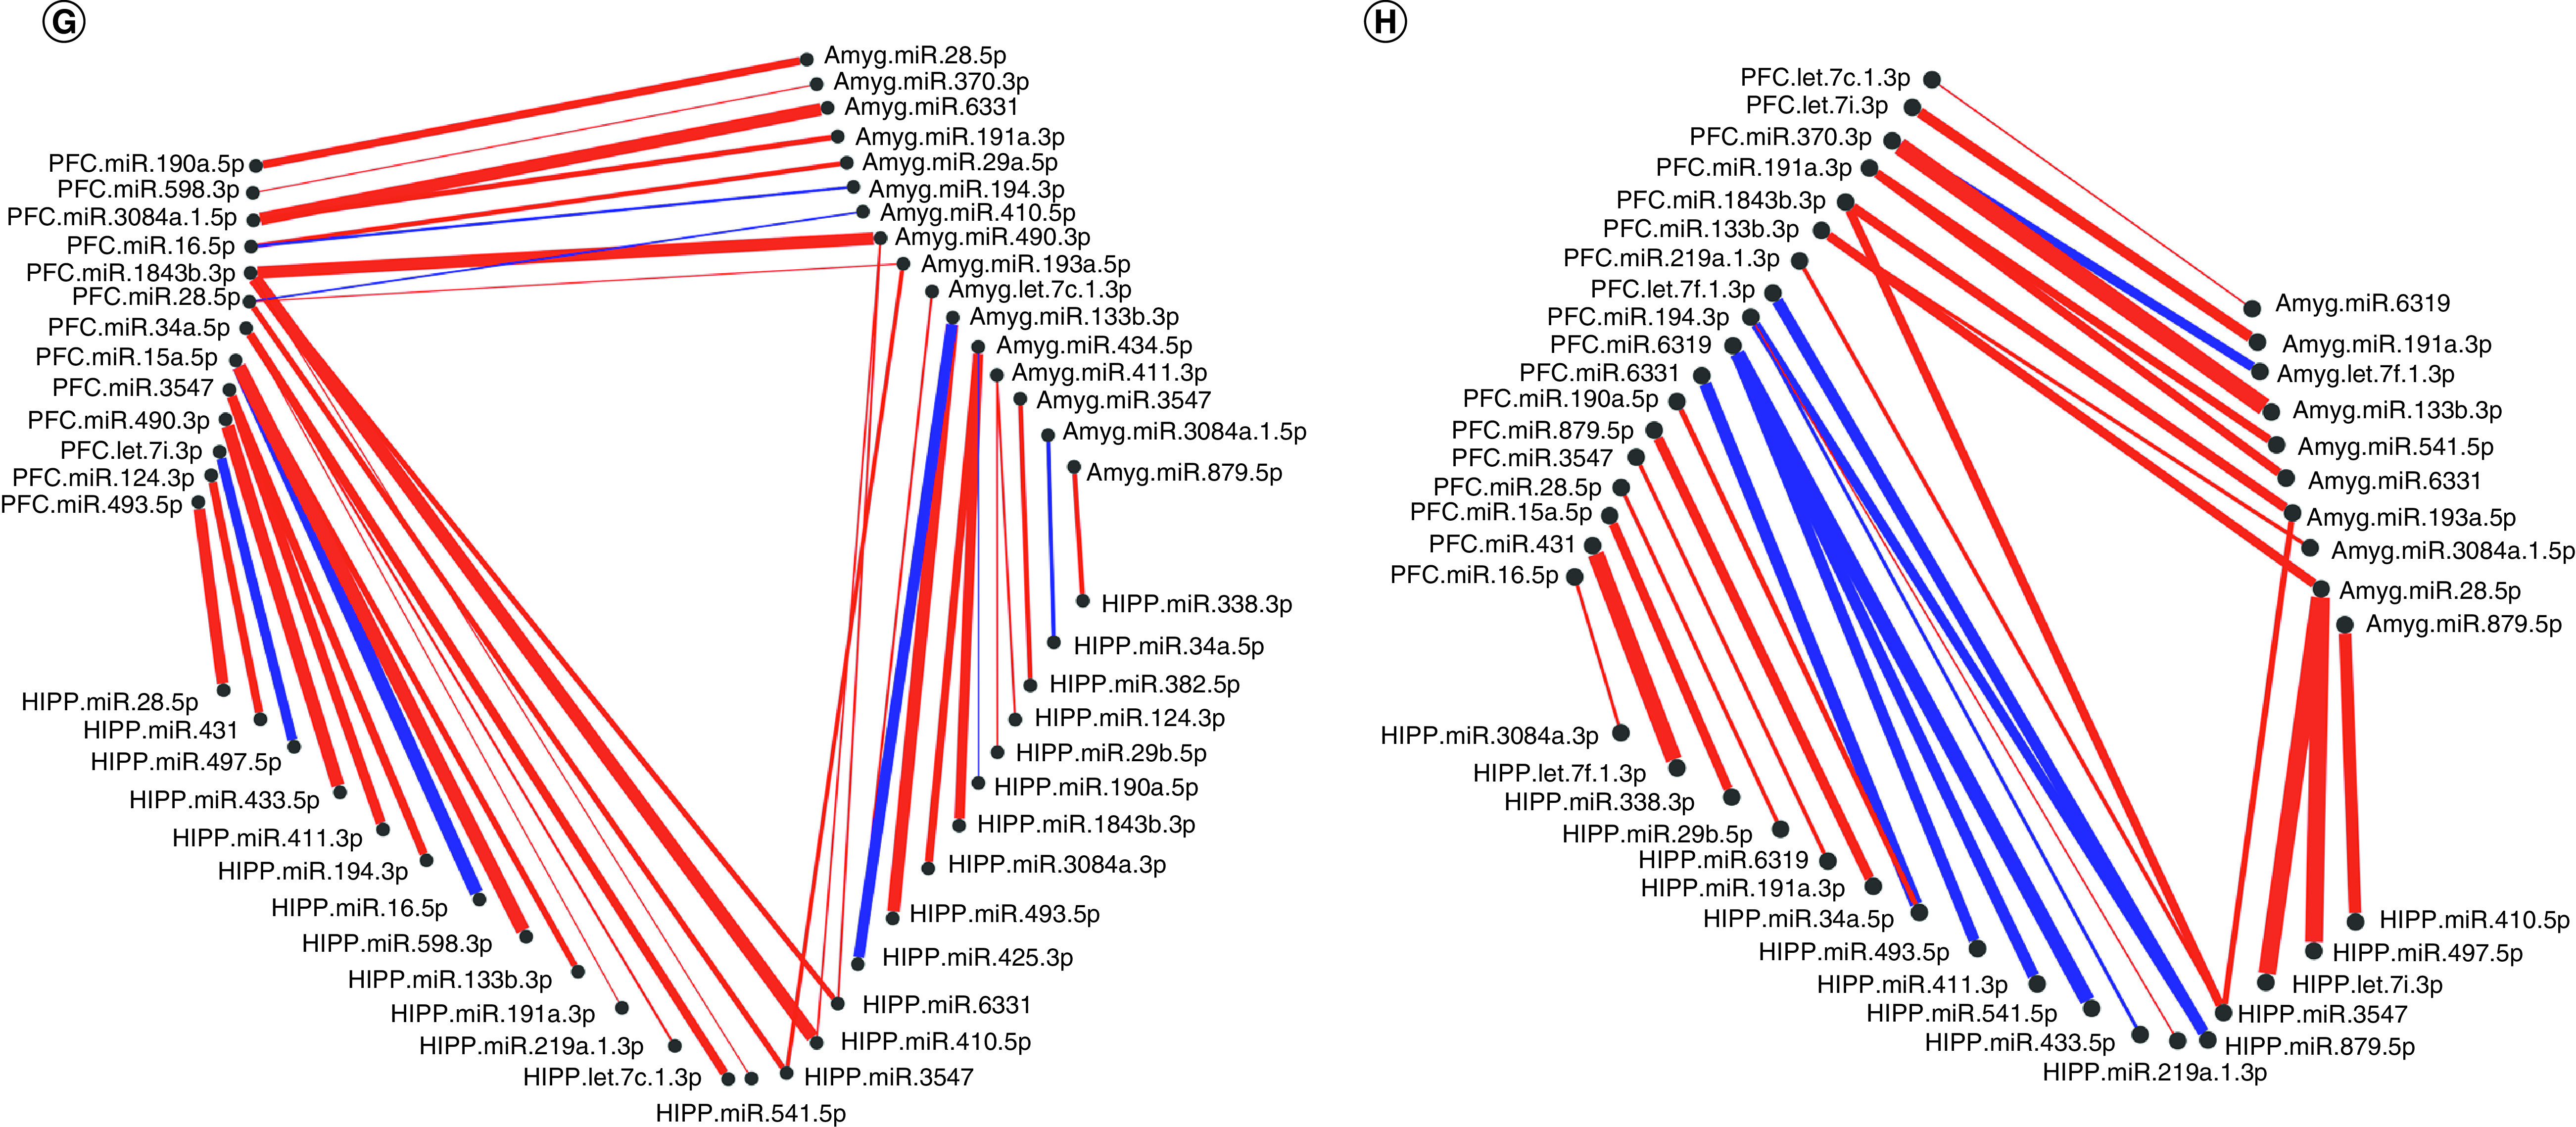
Figure 3. . Correlated miRNA–miRNA expression dendrograms and heat maps across three brain regions by maternal separation and sex.


Significantly altered interaction effect miRNAs across the prefrontal cortex, amygdala and hippocampus were included in this correlation and hierarchical clustering analysis in R. Correlation heat maps for (A) male controls, (B) male MS, (E) female controls and (F) female MS animals show patterns of miRNA–miRNA correlation across the brain; each of the k = 3 clusters is marked by a colored outline in the dendrogram and height is an arbitrary unit estimating the distance between different clusters. For each group – (C) male controls, (D) male MS, (G) female controls and (H) female MS – significantly correlated miRNAs (false discovery rate <0.05) were narrowed to look across regions. Positive correlations are shown in red and negative correlations in blue; thicker lines indicate a more significant correlation.
MS: Maternal separation.
