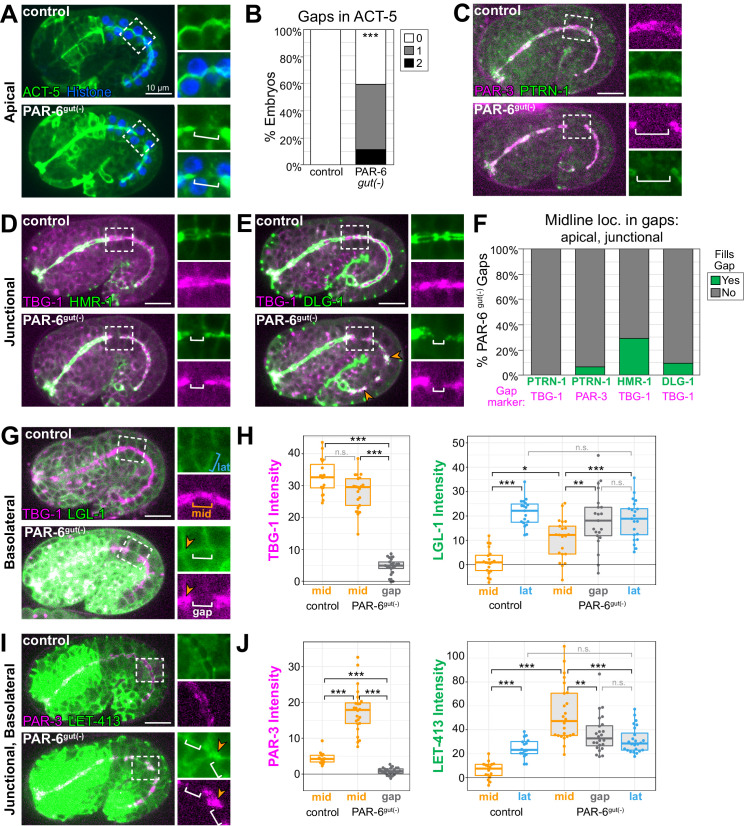
Figure 5. Midline gaps in apical and junction proteins overlap and fail to exclude basolateral proteins in PAR-6gut(-) embryos.
(A, C–E, G, I) Lateral live images of 1.5- to 1.8-fold-stage embryos of indicated genotypes expressing indicated markers. Maximum intensity Z-projections (0.5–3.5 μm) capture the intestinal midline, except LGL-1 which is a single Z-slice, and LET-413, which is a minimum intensity Z-projection (1.5–2 μm). 2× magnified images of boxed region highlighting midline gaps are shown at right. White brackets indicate midline gap. Orange arrowheads indicate colocalization of indicated markers. Note that DLG-1::GFP contrast and brightness in (E) was increased in inset PAR-6gut(-) image to visualize gap. (B) Graph showing percent of embryos with indicated number of YFP::ACT-5 gaps. Control: n = 19 embryos, PAR-6gut(-): n = 27. Statistical analysis: Student’s t-test. Difference from control indicated with asterisks. (F) Graph showing the percent of midline gaps (magenta) in PAR-6gut(-) embryos to which the indicated protein (green) localized. PTRN-1::GFP/TBG-1::mCherry: n = 0/23 gaps, 18 embryos; PTRN-1::GFP/PAR-3::tagRFP: n = 5/86 gaps, 35 embryos; HMR-1::GFP/TBG-1::mCherry: n = 9/31 gaps, 37 embryos; DLG-1::mNG/TBG-1::mCherry: n = 3/31 gaps, 23 embryos. Microtubule-organizing center (MTOC) gaps were not observed in control par-6(+) embryos (n ≥ 15 embryos per genotype). (H, J) Graphs showing signal intensity at lateral surfaces (blue), the apical midline (orange), and at midline gaps (white) in control and PAR-6gut(-) intestines for indicated markers. LGL-1::GFP/TBG-1::mCherry in PAR-6gut(-): n = 16 anterior gaps, 14 embryos; LGL-1/TBG-1 in controls: n = 0 anterior gaps, 19 embryos; LET-413::GFP/PAR-3::tagRFP in PAR-6gut(-): n = 21 anterior gaps, 15 embryos; LET-413/PAR-3 in controls: n = 0 anterior gaps, 19 embryos. Midline gap localization of LET-413 and LGL-1 was scored only for anterior cells (int1-4). Statistical analysis: Student’s t-test with Bonferroni correction. All experiments used ifb-2p::zif-1 to drive E8 onset of degradation except (A) and (B), which used elt-2p::zif-1 to drive degradation at E4. Scale bars = 10 μm. *p<0.05, **p<0.01, ***p<0.001.

