Abstract
Spleen Tyrosine Kinase (SYK) is a critical immune signaling molecule and therapeutic target. We identified damaging monoallelic SYK variants in six patients with immune deficiency, systemic disease such as colitis, arthritis and skin inflammation, and diffuse large B cell lymphomas. The SYK variants increased phosphorylation and enhanced downstream signaling indicating gain-of-function. A knock-in (SYKS544Y) mouse model of a patient variant (p.S550Y) recapitulated aspects of the human disease that could be partially treated with a SYK inhibitor or transplantation of bone marrow from wildtype mice. Our studies demonstrate that SYK gain-of-function variants result in a potentially treatable form of inflammatory disease.
MAIN
Immunoreceptors, including B cell receptors, T cell receptors and Fc-receptors signal through cytosolic immunoreceptor tyrosine-based activation motifs (ITAMs) that are rapidly tyrosine phosphorylated to recruit and activate kinases with tandem SH2 domains 1. These kinases are (1) the ζ-chain-associated protein kinase of 70 kDa (ZAP70), which is primarily expressed in T cells and natural killer cells, and (2) the spleen tyrosine kinase (SYK), which is primarily expressed in mononuclear phagocytes (MNPs), B cells and, to a lesser extent, the intestinal epithelium. SYK is also involved in signaling cascades from receptors without ITAMs, including C-type lectin receptors, Toll-like receptors and integrins 1,2. Global knockout of Syk in mice is perinatally lethal 3,4. Chimeric mice carrying a Syk-deficient hematopoietic system are protected from autoantibody-mediated arthritis and have a block in B cell development at the pro-B to pre-B cell transition 5. Loss-of-function biallelic variants in ZAP70 result in human immunodeficiency characterized by a selective T cell defect (OMIM 269840) 6, while pathogenic variation of SYK has not been described in humans. In this study we identify monoallelic gain-of-function variants in SYK that result in immunodeficiency and systemic inflammatory disease in humans and show that the expression of one of these variants in a mouse model replicates major aspects of the human immunopathology.
RESULTS
Clinical characteristics of two unrelated families with very-early-onset multi-organ inflammation
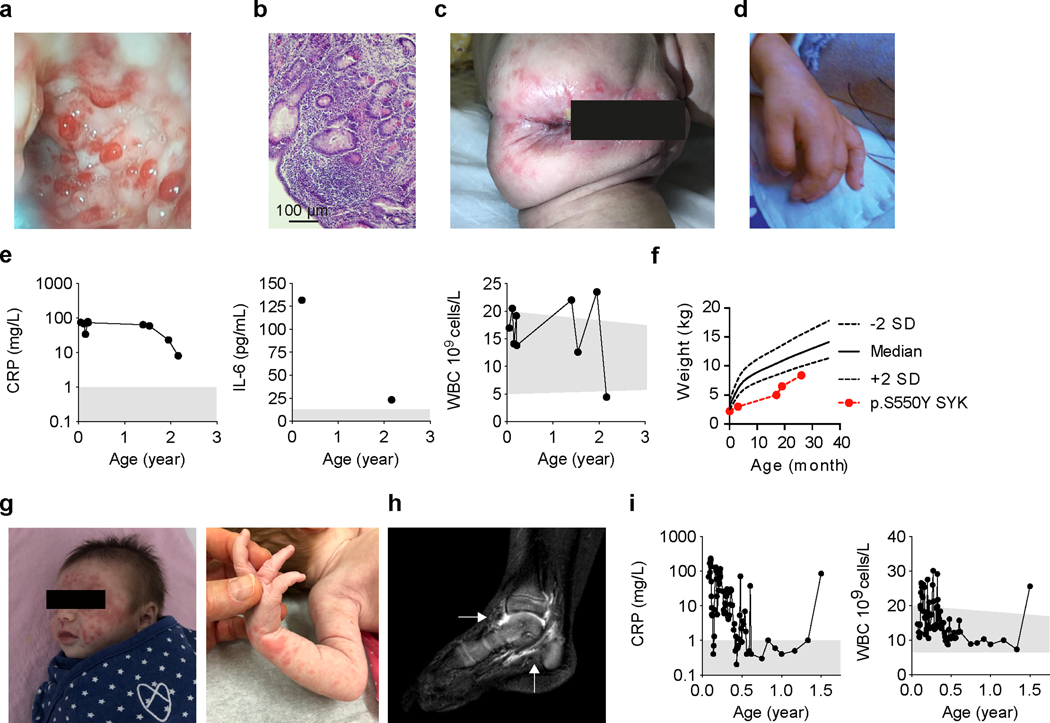
Patient 1, a female infant of Chinese ancestry born to healthy non-consanguineous parents, presented at 2 weeks of age with fever, whole body rash and non-bloody diarrhea (5–8 times per day). Colonoscopy at 17 months of age revealed multiple ulcers in the colon (Fig. 1a) with histologic features consistent with chronic colitis (Fig. 1b). She also developed perianal fistulas (Fig. 1c) and arthritis indicated by joint pain and swelling of her hands (Fig. 1d). Laboratory tests showed normal white blood cell (WBC) counts but elevated C-reactive protein (CRP), high level of serum Interleukin (IL)-6, and reduced serum levels of immunoglobulin (Ig) M and IgG (Fig. 1e and Supplementary Table 1). She had significant growth failure (Fig. 1f) and recurrent infections. The patient passed away before her 3rd birthday due to complications from an infection.
Figure 1. Clinical phenotype and identification of variants in SYK.
(a) Colonoscopy of Patient 1 showed multiple ulcers in the colon at 17 months of age. (b) Histological analysis showing active intestinal inflammation including focal distortions of crypts and increased cellular infiltration in the lamina propria (clinical data, n=1). Clinical features in Patient 1 included (c) perianal disease and (d) edematous hand swelling (n=1). (e) Patient 1 laboratory tests showed elevated CRP, WBC counts and elevated serum IL-6. (f) Growth chart at different ages using weight versus age percentile based on World Health Organization criteria 36. (g) Vasculitis rash observed in Patient 2. (h) Sagittal post-gadolinium T1-weighted fat-suppression magnetic resonance imaging of the right ankle demonstrating synovitis of the tibiotalar and subtalar joints (indicated by white arrows) of Patient 2. (i) Patient 2 laboratory tests showed episodes of increased CRP and WBC counts. Grey areas indicate healthy donor control ranges.
Patient 2, a female infant of reported Ashkenazi Jewish ancestry born to non-consanguineous parents, presented at two weeks of age with whole body rash, generalized vasculitis (Fig. 1g) and diarrhea. Colonoscopy at four weeks of age revealed ulcers in the cecum with features of chronic inflammation. By 15 months of age, she developed arthritis (Fig. 1h) with worsening colitis and multiple episodes of elevated CRP and WBC counts (Fig. 1i and Supplementary Table 2). Her father (Patient 3, age 35) had a similar disease that started at two weeks of life and was characterized by oral ulcers, fever, rash, diarrhea and failure to thrive. As a child he was diagnosed with an undefined immunodeficiency with reduced CD4+ T cell counts and low immunoglobulins (Supplementary Table 3) and was advised against using live vaccines. Currently, he continues to have bowel and skin symptoms with recurrent joint swelling associated with elevated CRP. Patients 2 and 3 both have reduced memory B cells (Supplementary Table 4).
Identification of monoallelic SYK variants in an immune dysregulation syndrome
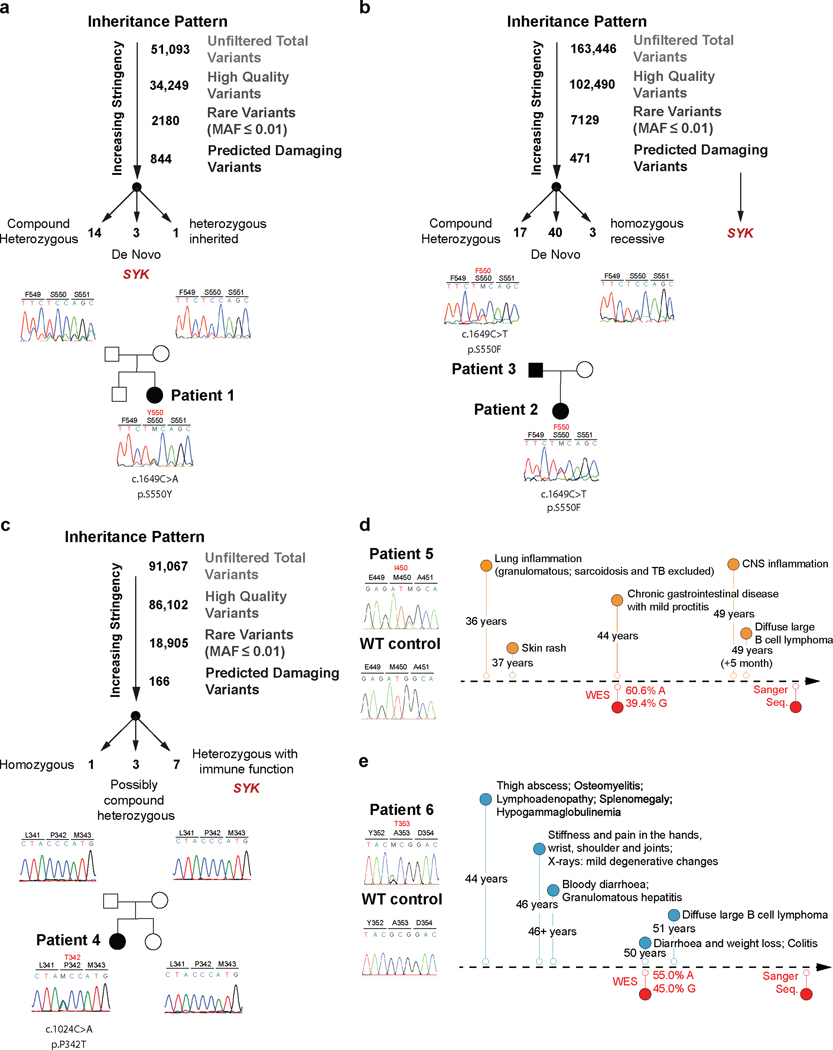
Analysis of whole exome sequencing of DNA samples from these two families did not identify any known monogenic inborn errors of immunity (Extended Data Fig. 1a and 1b). However, monoallelic variants affecting amino acid 550 in the Spleen Tyrosine Kinase (SYK) gene were nominated as a potential candidate in all three patients based on the gene’s known biological function and damaging scores (Table 1; Patient 1 de novo c.1649C>A, NM-003177.6; p.S550Y; Patients 2 and 3 c.1649C>T, NM-003177.6; p.S550F; Fig. 2a and 2b). We next screened for additional SYK variants in a number of patient registries and found 3 additional patients with potential monoallelic damaging variants in evolutionary conserved residues of SYK (p.P342T, p.A353T and p.M450I). The p.P342T variant identified in Patient 4 was de novo (Extended Data Fig. 1c and Supplementary Table 5); however, the inheritance patterns of Patient 5 and 6 (SYK variants p.A353T and p.M450I respectively) were unknown as they were sequenced as singletons with no parental DNA available (Extended Data Fig. 1d and 1e).
Table 1.
Genetic and clinical characteristics of patients with monoallelic SYK variants
| Patient 1 | Patient 2 | Patient 3 | Patient 4 | Patient 5 | Patient 6 | |
|---|---|---|---|---|---|---|
| p.S550Y | p.S550F | p.S550F | p.P342T | p.M450I | p.A353T | |
| Variant Annotation | ||||||
| Chromosome | 9 | 9 | 9 | 9 | 9 | 9 |
| positon (GRCh38) | 90887816 | 90887816 | 90887816 | 90874692 | 90877739 | 90874725 |
| nt ref | C | C | C | C | G | G |
| nt alt | A | T | T | A | A | A |
| dbSNP151 | . | . | . | . | rs1304839707 | rs200167353 |
| pos (GRCh37) | 93650098 | 93650098 | 93650098 | 93636974 | 93640021 | 93637007 |
| 1000Gp3_AF | . | . | . | . | . | . |
| ESP6500_AA_AF | . | . | . | . | . | . |
| ExAC_AF | . | . | . | . | . | 2.47E-05 |
| gnomAD_exomes_AF | . | . | . | . | 7.95E-06 | 1.99E-05 |
| COSMIC | 8 | |||||
| CADD_phred | 28.3 | 29.7 | 29.7 | 25.5 | 26.3 | 27.3 |
| SIFT_pred | damaging | damaging | damaging | damaging | damaging | tolerated |
| Polyphen2_HDIV_pred | damaging | damaging | damaging | damaging | tolerated | damaging |
| LRT_pred | damaging | damaging | damaging | damaging | damaging | damaging |
| MutationTaster_pred | damaging | damaging | damaging | damaging | damaging | damaging |
| PROVEAN_pred | damaging | damaging | damaging | damaging | tolerated | tolerated |
| MetaSVM_pred | damaging | damaging | damaging | damaging | tolerated | tolerated |
| M-CAP_pred | damaging | damaging | damaging | damaging | damaging | damaging |
| fathmm-MKL_coding_pred | damaging | damaging | damaging | damaging | damaging | damaging |
| Clinical presentation | ||||||
| Age at sampling (years) | 2 | 0.5 | 35 | 31 | 34 | 44 |
| Age of diagnosis | 2 weeks | 2 weeks | 2 weeks | 12 years | 34 years | 44 years# |
| Intestinal inflammation | + | + | + | + | + | + |
| Skin inflammation | + | + | + | + | + | – |
| Joint inflammation | + | + | + | – | – | + |
| Lung inflammation | – | + | – | – | + | + |
| CNS inflammtion | – | – | – | + | + | – |
| Liver inflammation | – | – | – | – | – | + |
| Recurrent infections | + | + | + | + | + | + |
| Hypogammaglobineamia | + | + | +* | + | + | + |
| Diffuse large B cell lymphoma (DLBCL) | – | – | – | – | + | + |
| Therapy (in chronological order first used) | ||||||
| ABX | ANAK | ABX | IVIG | IVIG | IVIG | |
| 5ASA | CSTD | IVIG | CSTD | CSTD | ABX | |
| CSTD | TACRO | RITUX | CYCA | RITUX | RITUX | |
| IVIG | RITUX | AZA | CHOP | CHOP | ||
| THAL | TRIAM | RITUX | ABX | |||
| VEDO | ||||||
Therapy: ABX, antibiotics; 5ASA, 5-aminosalicylic acid-based therapy; ANAK, anakinra; AZA, azathioprine; CSTD, corticosteroid (intravenous and/or oral); CYCA, cyclosporine A; CHOP, cyclophosphamide, doxorubicin hydrochloride (hydroxydaunorubicin), vincristine sulfate (Oncovin), and prednisone; IVIG, intravenous immunoglobulins; RITUX, rituximab; TACRO, oral tacrolimus; THAL, thalidomide; TRIAM, intra-articular triamcinolone; VEDO, Vedolizumab
Patient 3 had documented hypogammaglobinemia as a child.
Patient 6 was diagnosed at 34 years of age but had lifelong infections.
nt: nucleotide; ref: reference strand; alt: alternate strand; pos: position; AF: allele frequency; pred: prediction
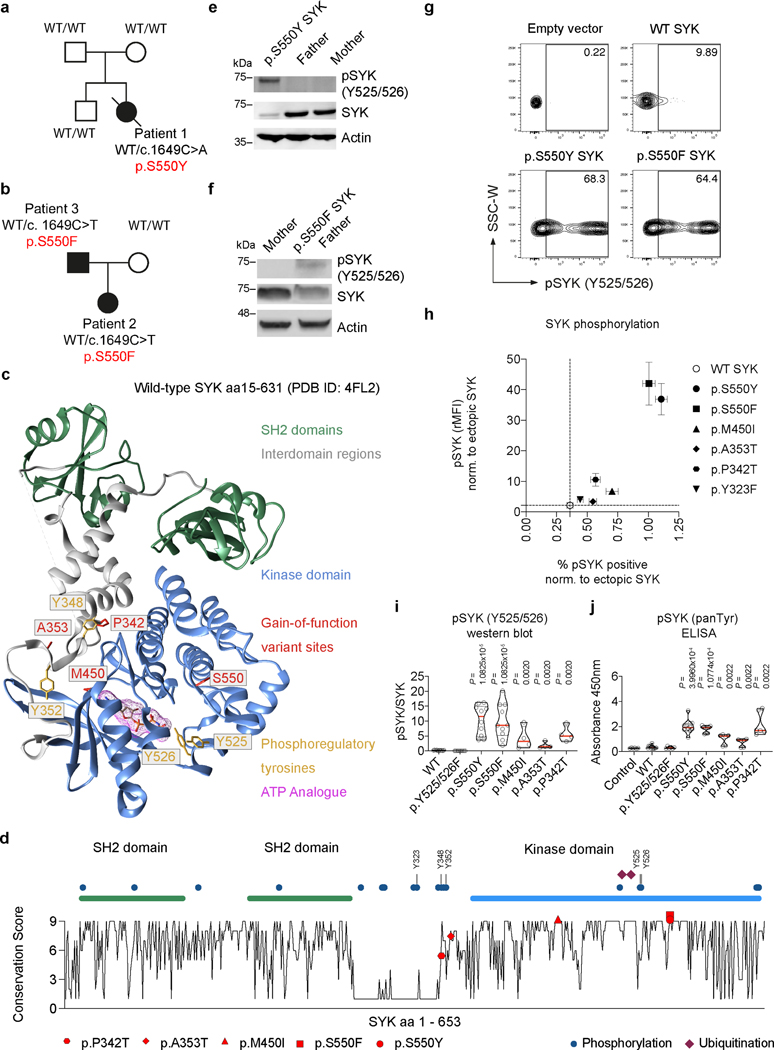
Figure 2. Functional characterization of SYK variants.
(a and b) Pedigree and SYK variant in Patients 1 to 3. (c) Structural model of wild-type human SYK (PDB ID: 4FL2), highlighting the sites of SYK gain-of-function variants (p.P342T, p.A353T, p.M450I, p.S550F and p.S550Y), the ATP binding pocket (occupied by an ATP analogue), and key phosphoregulatory tyrosine residues that determine SYK activity. (d) Graphical illustration of SYK sequence conservation (black line) based on ConSurf conservation score (see Methods). Domain structure, phosphorylation sites (blue dots), ubiquitination sites (dark red squares) and positions of identified patient variants (coloured triangles) are indicated. (e and f) Total and phosphorylated SYK expression in PBMC from family 1 and 2 by western blot (representative blots are shown of 3 independent repeats). (g) Contour plot presentation of pSYK (Y525/526) expression in HEK293 cells transfected with an empty vector, wild-type SYK or mutated p.S550Y or p.S550F SYK assessed by intracellular staining and flow cytometry. (h) SYK phosphorylation in wild-type SYK or mutated SYK assessed by intracellular staining and flow cytometry. Data are shown as normalised relative mean fluorescence intensity (rMFI) of pSYK (Y525/526) to ectopically expressed SYK (y-axis) and normalised % of pSYK positive cells (x-axis) to ectopically expressed SYK; (mean±SD; n of independent experiments/n of cell culture replicates: eV(8/30), WT(8/24), p.S550Y(8/28), p.S550F(6/21), p.M450I(8/28), p.A353T(8/30), p.P342T(8/30), p.Y323F(3/12)). (i) Quantification of western blot analysis of total and phosphorylated levels of SYK (Y525/526) in HEK293 cells according to Extended Data Fig. 4g. (j) SYK phosphorylation (panTyr) in HEK293 cells expressing an empty vector (Control), wild-type SYK (WT) or the diverse range of SYK variants identified in patients as measured by ELISA. i and j: quartiles and median; n of independent experiments: WT(10), p.Y525/526F(10) p.S550Y(10), p.S550F(10), p.M450I(4), p.A353T(4), p.P342T(4). Mann-Whitney test.
We compared clinical phenotypes of all six patients bearing SYK variants (detailed clinical history and laboratory values available in Table 1 and Supplementary Information - Supplementary Tables 1-5 and Extended Data Fig. 2a-c). Patients 1–3 with the variants affecting p.S550 presented as infants, while Patients 4–6 had a later disease onset. All patients had recurrent infections and dysgammaglobulinemia, Patients 2 and 3 had B cells defects, and Patients 1 and 4 had decreased ratios of CD4+ and CD8+ T cells. All Patients had inflammation in multiple tissues including bowel (Patients 1–6), skin (Patients 1–5), joints (Patients 1–3 and 6), lung (Patients 2, 5, 6), central nervous system (Patients 4 and 5) and granulomatous liver disease (Patient 6). Patients 5 and 6 developed diffuse large B cell lymphoma years after their initial presentation of inflammatory disease (both germline SYK variants were confirmed by sequencing of buccal samples; Extended Data Fig. 1d and 1e). Taken together, we conclude that all six individuals are manifesting an autosomal dominant syndrome of immune dysregulation, multi-organ inflammation, and lymphoma predisposition, caused by monoallelic variants in SYK.
SYK variants demonstrates a gain-of-function
All the putatively pathogenic SYK variants, validated by Sanger sequencing, were novel or very rare, located in highly conserved regions (Extended Data Fig. 2d) and predicted to be damaging with CADD scores7 greater than 25 (Table 1). While p.S550 is located close to two essential activation loop tyrosine residues but distant from the ATP-binding pocket, p.M450 is located closely to the ATP-binding pocket of SYK. The p.P342T and p.A353T variants are located in the linker region (interdomain B) that maintains SYK in an auto-inhibited conformation (Fig. 2c and 2d). With the exception of T342 in the moth Amyelois transitella, none of the identified missense amino acids are present in SYK homologs, suggestive of evolutionary exclusion (Extended Data Fig. 2e).
To determine the functional consequences of the SYK monoallelic variants, we first examined SYK phosphorylation in patient resting peripheral blood mononuclear cells (PBMC), where monocytes and B cells are the primary cells expressing SYK. In the steady-state, monocytes and B cells are not expected to have active, phosphorylated SYK. In contrast to healthy family controls, PBMC from Patients 1 and 3 showed spontaneous tyrosine phosphorylation of Y525/526 SYK, tyrosine residues known to regulate auto-phosphorylation and activation 1 (Fig. 2e and 2f, Source Data – Fig. 2), despite a decrease in SYK expression. Likewise, intestinal biopsy samples from Patient 1 demonstrated increased phospho-SYK (Extended Data Fig. 3a and 3b). These data pointed towards constitutive activation of the SYK p.S550 variants.
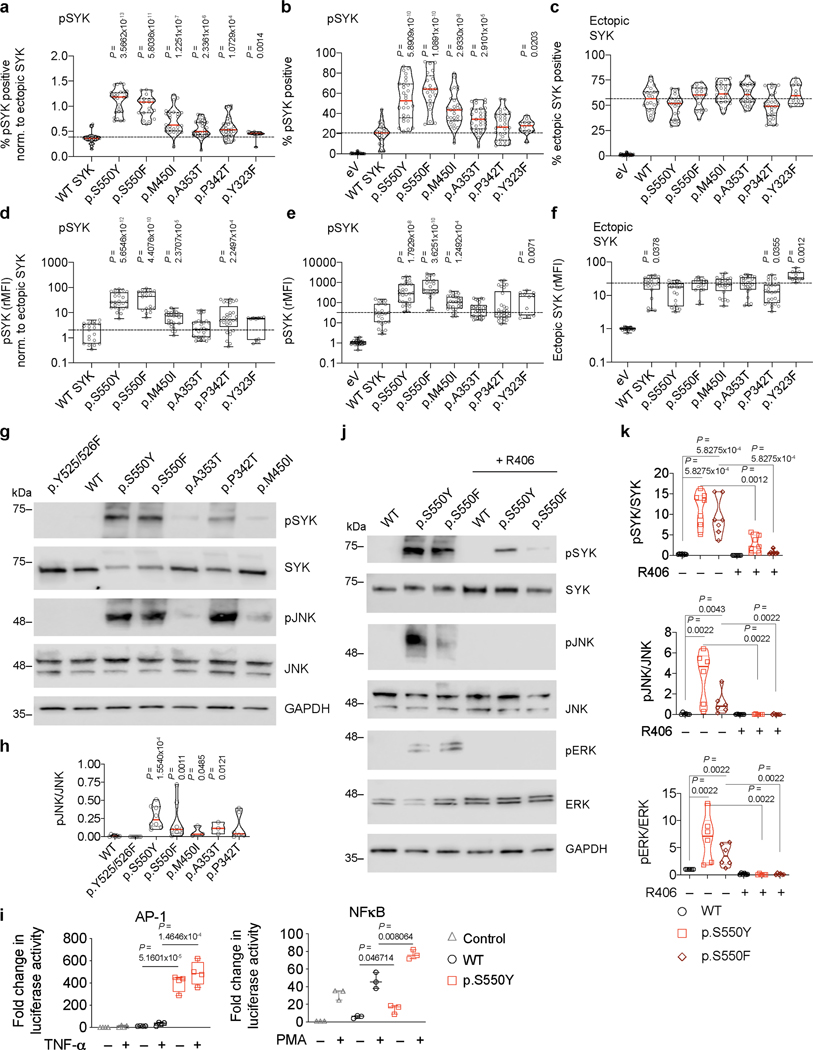
To examine whether this is a feature of all the putative pathogenic alleles, we individually expressed wild-type (WT) and each variant form of SYK at comparable levels by transfection into HEK293 cells that do not express the kinase endogenously. Using 3 independent methods (flow cytometry, western blotting, and ELISA) we found that the p.P342T, p.A353T, p.M450I, p.S550Y, and p.S550F SYK variants all showed significantly increased phosphorylation of Y525/526 compared to WT SYK and a Y525F/Y526F inactive SYK negative control (Fig. 2g-j, Extended Data Fig. 4a-h, Source Data – Extended Data Fig. 4). A putative gain-of-function variant shown previously in rat cells 8 (p.Y323F) was used as a positive control and showed increased Y525/526 phosphorylation of SYK in flow cytometry assays, although to a much lesser extent than the variants identified in our patients (Fig. 2h, Extended Data Fig. 4a-f, and data not shown). Thus, the patient-identified SYK variants all lead to constitutive SYK activation, consistent with gain-of-function.
Expression of constitutively active SYK variants in HEK293 cells drove downstream signaling as revealed by increased phosphorylation of extracellular signal–regulated kinases (ERK) and c-Jun N-terminal kinases (JNK), which was not observed in cells expressing the Y525F/Y526F inactive or WT forms of SYK (Extended Data Fig. 4g and 4h, Source Data – Extended Data Fig. 4). In addition, when stimulated with TNFα to engage the TNF receptor or phorbol-12-myristate-13-acetate (PMA) to activate protein kinase C, cells expressing p.S550Y SYK showed exaggerated AP-1 and NF-κB activity compared to WT SYK (Extended Data Fig. 4i). These results demonstrate that patient SYK variants caused elevated tonic (ligand-independent) signaling and augmented well-defined receptor-mediated signaling pathways.
Small molecule inhibitors of SYK have been developed including fostamatinib. R406, the active metabolite of fostamatinib, attaches to the ATP-binding pocket of SYK and sterically competes with free ATP to inhibit SYK kinase activity9. This region of SYK has been structurally solved using the ATP analogue ANP in the 4FL2 structure outlined in Figure 2c 10,11. To corroborate that the p.S550 variants lead to SYK activation, we treated cells expressing the SYK p.S550Y or p.S550F variants with R406. In both cases, R406 inhibited SYK Y525/526 phosphorylation and reduced downstream signaling including the phosphorylation of JNK and ERK (Extended Data Fig. 4j and 4k, Source Data – Extended Data Fig. 4).
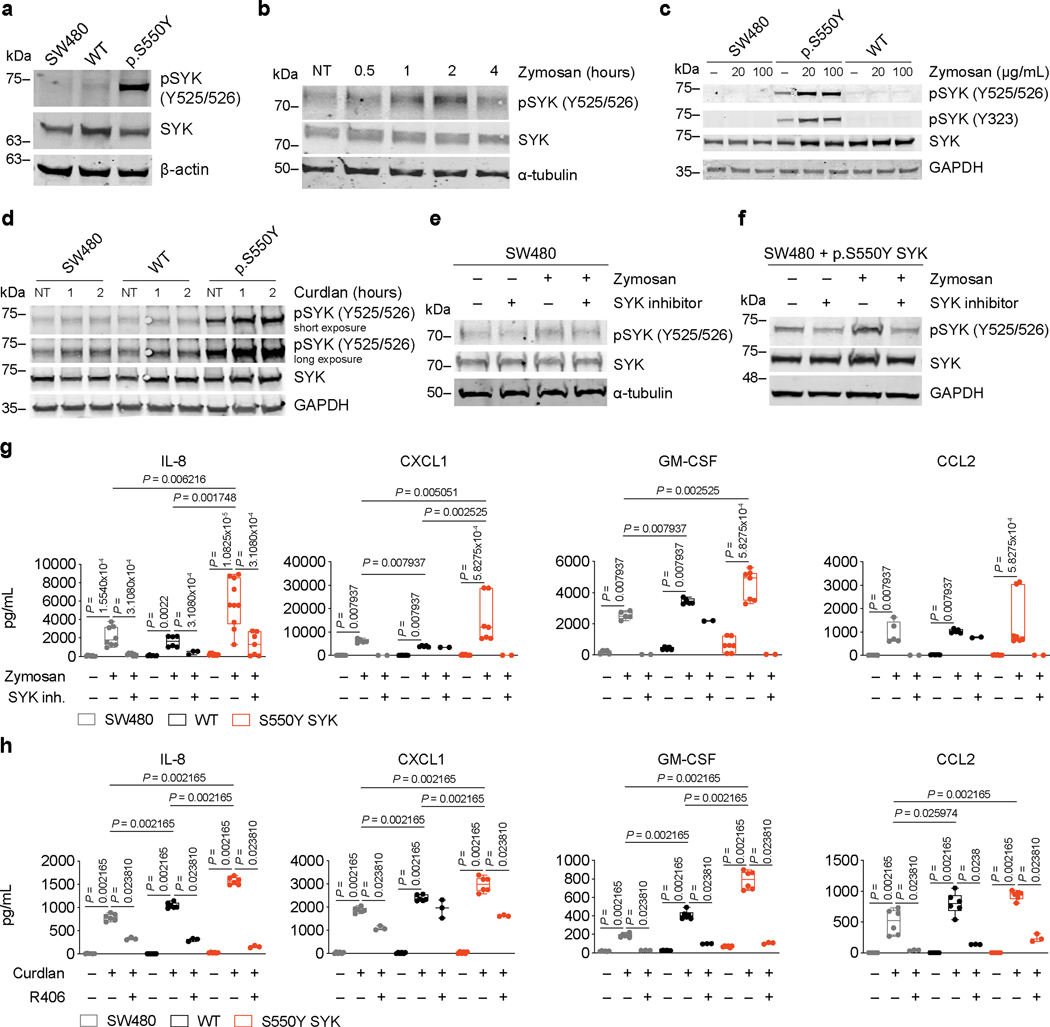
The hyperactivation of SYK caused by p.S550 variants was not only observed in HEK293 cells. When expressed in human SW480 colonic epithelial cells, the p.S550Y SYK variant also showed increased phosphorylation at Y525/526 (Extended Data Fig. 5a, Source Data – Extended Data Fig. 5). Human intestinal epithelial cells can respond to microbial-associated molecular patterns (MAMPs) including bacterial and fungal cell wall components (e.g., β1–3 glucans, Extended Data Fig. 5b, Source Data – Extended Data Fig. 5). MAMPs can be shared between pathogens and the normal microbiome, and therefore signaling responses must be tailored appropriately or otherwise lead to autoinflammation. Accordingly, intestinal epithelial cells express low levels of pattern recognition receptors at their surface like Dectin-1 which recognize the exposed β1–3 glucans of microbes. We therefore stimulated SW480 cells expressing WT or the p.S550Y SYK variant with zymosan (prepared from the cell walls of the yeast S. cerevisiae) or curdlan (derived from the cell walls of A. faecalis, a gram-negative bacterium) which both contain exposed β1–3 glucans. We found that, in addition to increasing phosphorylation of SYK Y525/526 at baseline, the p.S550Y expressing SW480 cells showed heightened, sustained and robust signaling in response to zymosan and curdlan (Extended Data Fig. 5c and 5d, Source Data – Extended Data Fig. 5). The heightened responses of the p.S550Y expressing cells to β1–3 glucan was sufficient to increase their secretion of inflammatory cytokines into the medium including IL-8, CXCL-1 and GMCSF as compared to controls. Importantly, treating the SW480 cells expressing the WT or p.S550Y forms of SYK with SYK inhibitors inhibited β-glucan induced SYK phosphorylation and respectively ablated the release of cytokines and chemokines (Extended Data Fig. 5e-h, Source Data – Extended Data Fig. 5). Thus, gain-of-function SYK variants result in amplified inflammatory cytokine and chemokine production and release.
p.S550Y SYK gain-of-function leads to memory/effector expansion of peripheral CD8+ T cells and CD4+ Th17 and Th1 cells
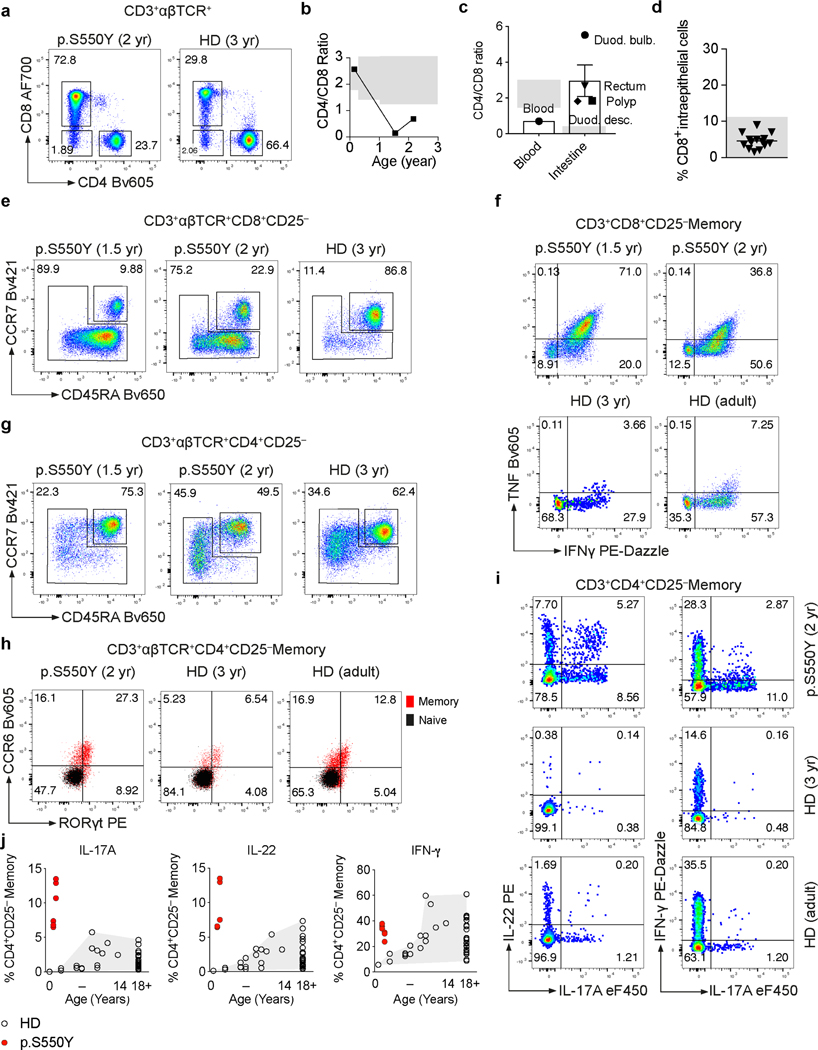
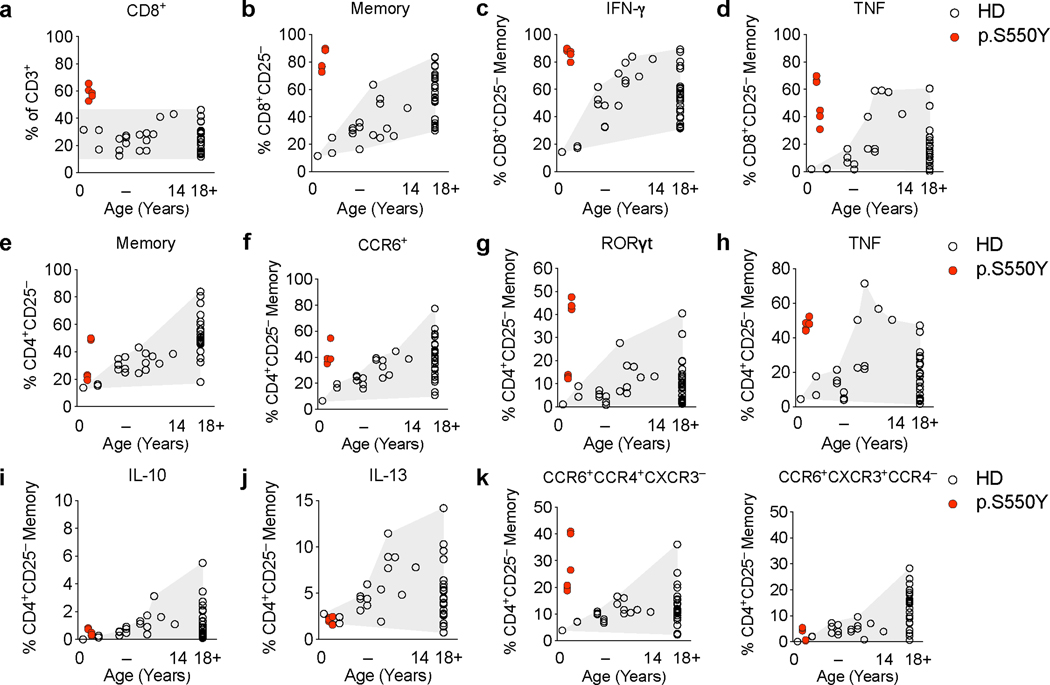
Chronic relapsing inflammatory conditions such as rheumatoid arthritis, spondyloarthritis, psoriasis, and inflammatory bowel disease are associated with changes in the peripheral CD8+ and CD4+ T cell populations. In particular, a skewed and increased frequency of pro-inflammatory Th17 and Th1 effector cells reflects underlying inflammation in these conditions driven by innate immune and epithelial cells 12–14. Thus, while SYK is not expressed in T cells, we postulated that multiorgan inflammation observed in patients with gain-of-function variants in SYK would produce secondary alterations in the T cell compartment (Extended Data Fig. 6 and 7; gating strategies outlined in Supplementary Fig. 1-3). We found that in Patient 1, the ratio of CD4+ to CD8+ αβTCR+ T cells decreased at 1.5 years and 2 years of age (Extended Data Fig. 6a-d and Extended Data Fig. 7a). The peripheral CD8+ T cells largely consisted of bona fide effector/memory type cells in this patient (Extended Data Fig. 6e and Extended Data Fig. 7b) as they produced high levels of IFN-γ and TNFα upon stimulation with PMA and ionomycin (Extended Data Fig. 6f, Extended Data Fig. 7c and 7d). The CD4+ memory T cell frequencies in this patient were also increased relative to naïve T cells (Extended Data Fig. 6g and 7e) and showed a high frequency of CCR6+ and RORγt+ cells that produced elevated IL-17A, IL-22, IFN-γ- and TNFα but not IL-10 or IL-13 (Extended Data Fig. 6h-j and Extended Data Fig. 7f-j). Indeed, the peripheral blood T cells in this patient were CCR6+CCR4+CXCR3– Th17-enriched but not CCR6+CXCR3+CCR4– Th1/Th17-enriched (Extended Data Fig. 7k).
Constitutive activation of SYK mice causes immune dysregulation
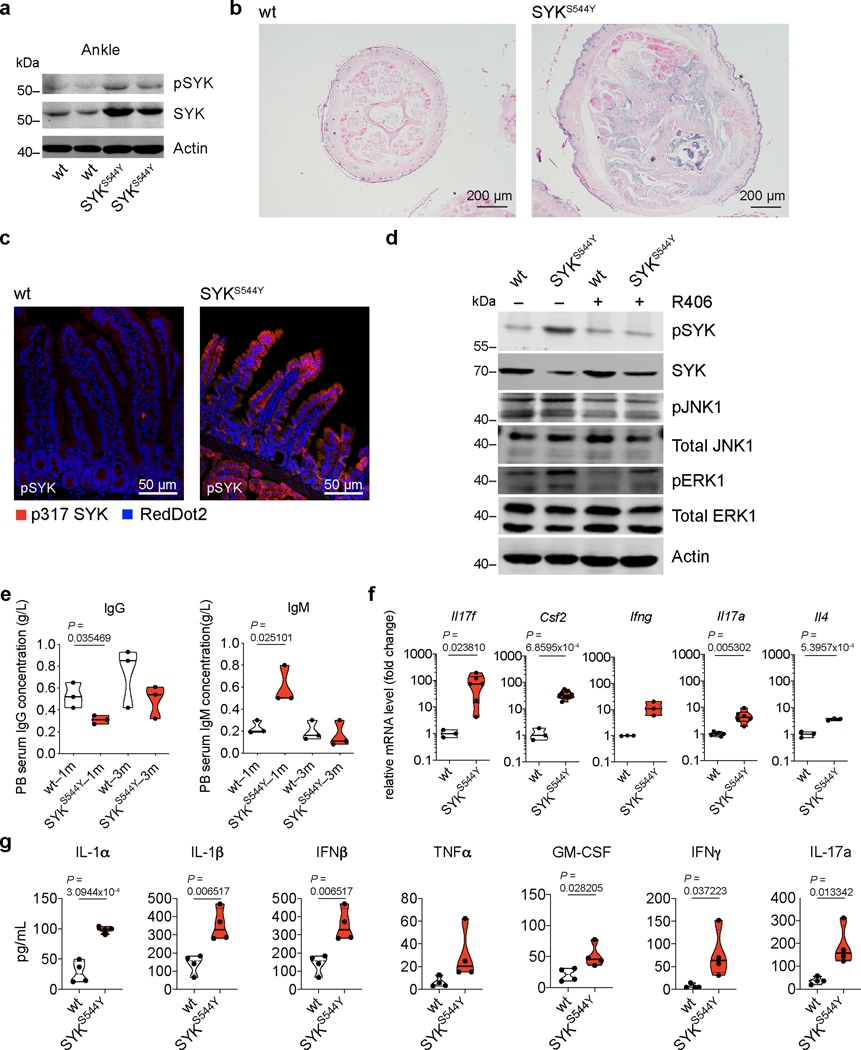
To further investigate the effects of the SYK variants and establish a model for intervention, targeted editing of the human SYK S550 equivalent was performed in mice using a CRISPR/Cas9 approach 15 (see Supplementary Fig. 4 and 5 for nucleotide and amino acid alignment of the human SYK p.S550Y and the corresponding mouse SYK p.S544Y and Sanger validation). The heterozygous SYKS544Y mice spontaneously developed arthritis as indicated by paw swelling (Fig. 3a), an increased arthritis clinical score (Fig. 3b), age-dependent reduced capacity in a functional grip assay (Fig. 3c), and bone erosion assessed by microCT (Fig. 3d) whereas none of those phenotypes were observed in wild-type littermates. Consistent with our studies in cell lines, western blot analysis of ankle joint tissues showed increased SYK phosphorylation in the SYKS544Y mice (Extended Data Fig. 8a, Source Data – Extended Data Fig. 8). Furthermore, SYKS544Y mice showed significantly reduced tail length while the tail diameter was significantly increased (Fig. 3e). MicroCT analysis of wild-type and SYKS544Y mice tails revealed substantial bone erosion (Fig. 3f). Histologic inspection of tail cross-sections revealed pronounced signs of arthritis and immune cell infiltration and neuroinflammation (Extended Data Fig. 8b). Additionally, SYKS544Y mice showed prominent intestinal epithelial cell SYK phosphorylation (Extended Data Fig. 8c). Bone marrow derived dendritic cells from SYKS544Y mice showed increased SYK Y525/526 phosphorylation and activation of downstream signaling that was inhibited by R406 (Extended Data Fig. 8d; Source Data – Extended Data Fig. 8). The mice had decreased IgG levels and increased IgM titers similar to patients identified with SYK gain-of-function variants (Extended Data Fig. 8e). Furthermore, SYKS544Y mice showed elevated transcription of Il17f, Csf2, Ifng, Il17a and Il4 in whole blood (Extended Data Fig. 8f) and increased serum inflammatory cytokines (Extended Data Fig. 8g).
Figure 3. Phenotype of SYKS544Y mouse model.
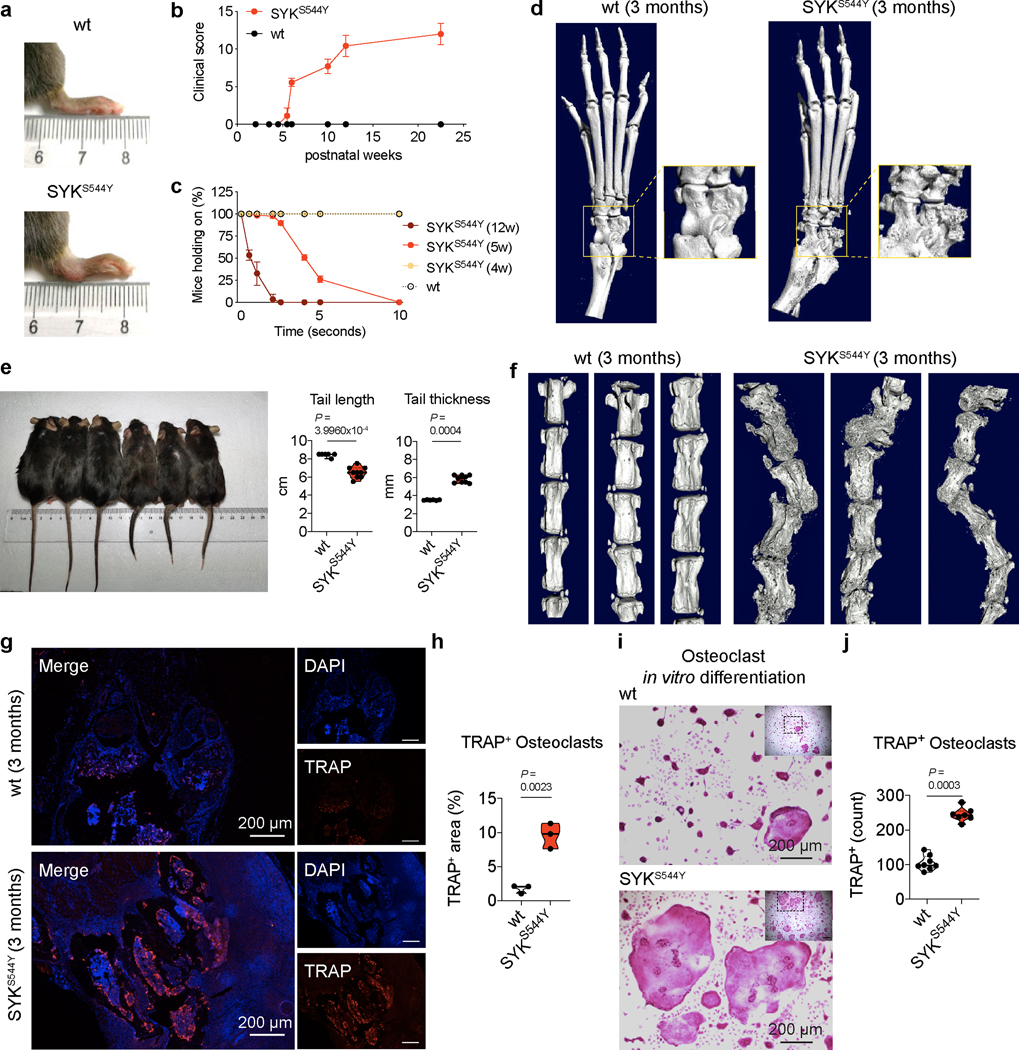
(a) Photographs of the hind limb of wild-type (top, n=6) and SYKS544Y (bottom, n=6) mice at the age of 3 months. (b) Quantification of arthritis severity by clinical score at the indicated age (n=7). (c) Percentages of mice that were able to hold on to the grid at the indicated time points after the grid was flipped over. The experiment was repeated 15–20 times per mouse (n=5). (d) Representative micro-CT images of the ankle joints of wild-type (left, n=6) and SYKS544Y (right, n=6) mice at the age of 3 months. Boxed areas show higher digital magnifications. (e) Photograph and quantification of wild-type (left) and SYKS544Y (right) mice tails at the age of 3 months. Wild-type: n=6; SYKS544Y n=9. Mann-Whitney test. (f) Micro-CT image of the tails of wild-type (left, n=3) and SYKS544Y (right, n=3) mice at the age of 3 months. (g) Representative image of immunofluorescence-based analysis of Tartrate-resistant acid phosphatase (TRAP) expression in wild-type (top) and SYKS544Y (bottom) mice ankle tissue. (h) Quantification of the TRAP+ area in wild-type (top) and SYKS544Y (bottom) mice ankle tissue according to (g) (n=3; unpaired t-test). (i) Representative TRAP staining of bone marrow derived macrophages wild-type and SYKS544Y mice cultured with M-CSF (10 ng/mL) and RANKL(50 ng/mL)for 8 days. (j) Quantification of counts of in vitro generated TRAP+ osteoclasts according to (i). Mature osteoclasts were identified as multinucleated (>3 nuclei) TRAP+ cells. Wild-type: n=8; SYKS544Y n=7. Mann-Whitney test. b and c: mean±SD. e, h and j: quartiles and median.
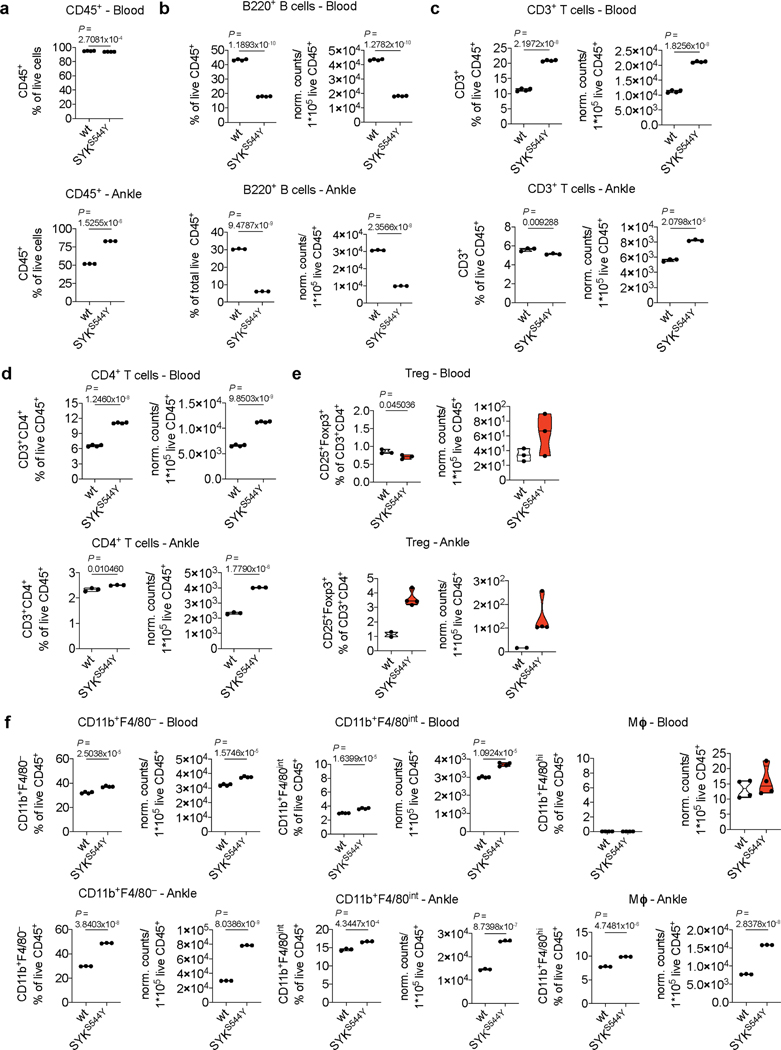
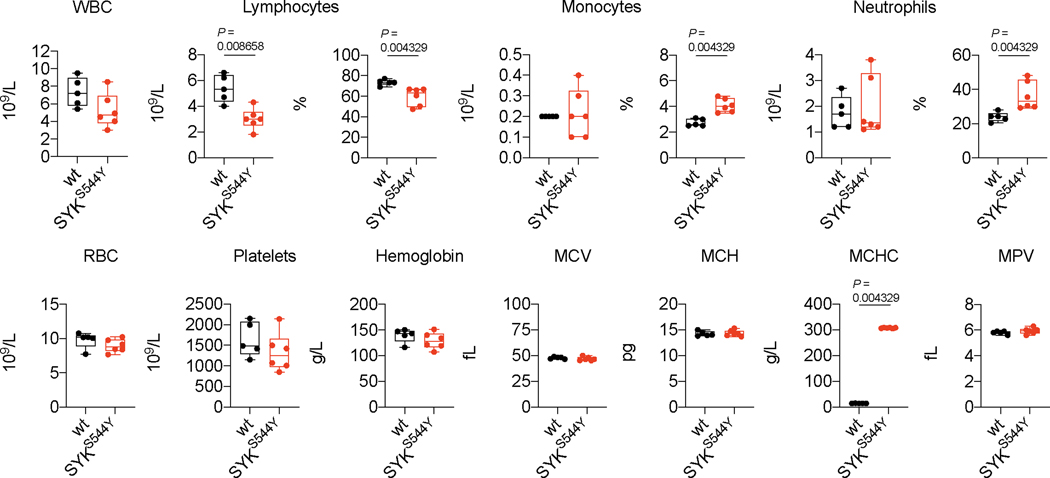
Next, we analysed the cellular composition of immune cell infiltrates in the affected ankles of SYKS544Y mice. We determined the frequencies of CD45+ cells, B cells, CD3+ T cells, CD4+ T cells, regulatory T cells (CD3+CD4+Foxp3+CD25+), CD11b+F4/80– and CD11b+F4/80int mononuclear phagocytes (MNP) and macrophages (CD11b+F4/80hi) in the ankles as compared to blood (flow cytometry gating strategy outlined in Supplementary Fig. 6 and 7). Interestingly, while CD45+ cells where slightly decreased in circulation, their frequencies were markedly increased in ankle tissue of SYKS544Y mice compared to wild-type mice (Extended Data Fig. 9a). B cells frequencies and normalised counts were significantly reduced in both circulation and tissue consistent with a defect in immunoglobulin generation. CD3+ T cells frequencies were increased in blood but reduced in tissue, while their normalized counts increased in both compartments. CD4+ T cells instead showed a proportional and normalised absolute increase in blood and tissue. Regulatory T cells showed reduced frequencies in blood but increased frequencies in inflamed tissue. MNPs (CD11b+F4/80– and CD11b+F4/80int) and macrophages were significantly increased in inflamed ankles of SYKS544Y mice (Extended Data Fig. 9b-f). Full blood counts revealed reduced lymphocytes frequencies and counts in SYKS544Y mice. Monocytes and neutrophils counts did not show significant differences in circulation while their frequencies were increased as a result of proportional changes in lymphocytes, in particular the reduction in B cells (Extended Data Fig. 10). While some of the cytokines that we found elevated in SYKS544Y mice have specific functions linked to Th1 and Th17 subsets (e.g., IL-1α/β, IFNγ, IL-17a, IL-17f, GM-CSF), they also influence the polarization and inflammatory phenotypes of innate immune cells.
To investigate the cause of the pronounced defect in bone homeostasis observed in ankles and tails of SYKS544Y mice, we next analysed the presence of osteoclasts. To detect osteoclasts, we stained the ankle joints for Tartrate-resistant acid phosphatase (TRAP), a metalloprotein enzyme expressed by osteoclasts and involved in bone degradation. The joints of SYKS544Y mice showed significantly increased signals for TRAP+ cells, suggestive of an accumulation of osteoclasts at the site of inflammation (Fig. 3g and 3h). Osteoclasts can be differentiated ex vivo by culturing bone marrow-derived macrophages in RANKL. We found that SYKS544Y mice generated 2.5-fold higher numbers of TRAP+ multinucleated osteoclasts that ultimately covered a 5-fold greater surface area in such experiments (Fig. 3i and 3j). These results suggest a central role of dysregulated osteoclast differentiation and potentially their hyperactivation in the development of the erosive arthritis observed in the SYK gain-of-function mice and patients.
Treatment of SYKS544Y ameliorates the disease phenotype
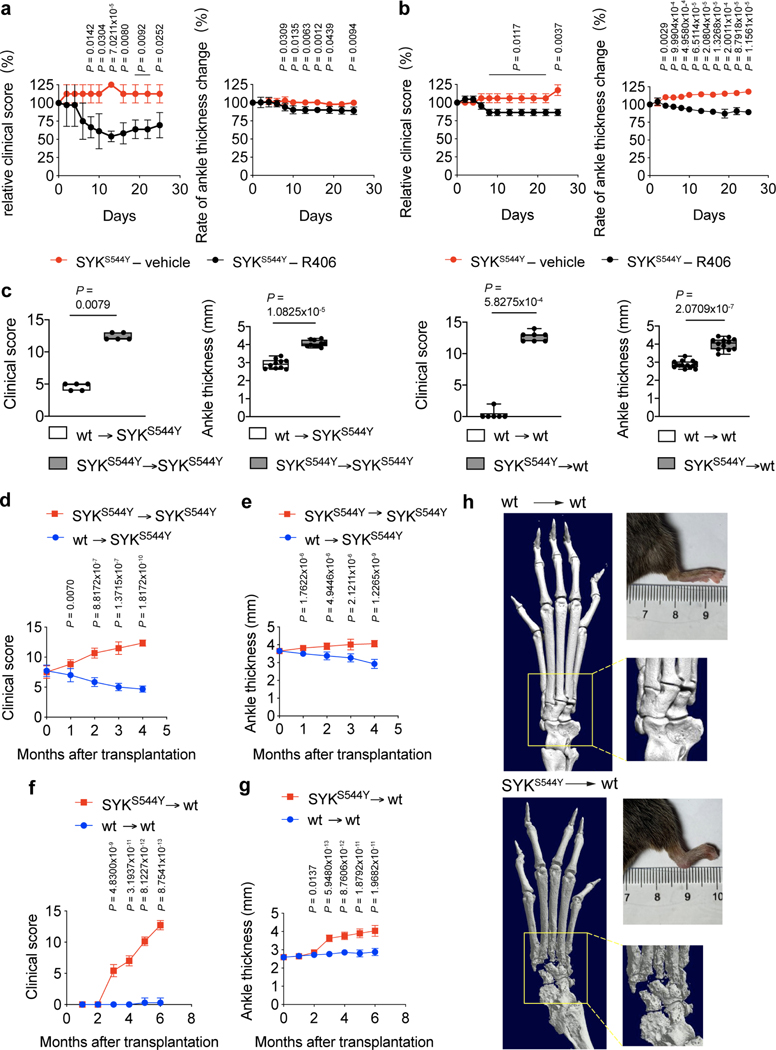
The SYK gain-of-function mouse model allowed us to establish an experimental system to test compounds that could ameliorate disease. We treated the SYKS544Y mice with SYK specific inhibitor R406 and found that treatment reduced symptoms of arthritis including ankle thickness and disease activity scores in young (1-month old, Fig. 4a) and adult (3-month-old, Fig. 4b) animals. As our data suggests that SYK plays a role in both mucosa and innate immune compartments, we performed bone marrow transplantation experiments to determine if the disease was driven by cells of the hematopoietic lineage. Indeed, when SYKS544Y irradiated mice were transplanted with wild-type bone marrow there was a dramatic resolution of disease symptoms (Fig. 4c, 4d and 4e). Conversely, irradiated WT mice transplanted with SYKS544Y bone marrow developed severe erosive arthritis as assessed by microCT (Fig. 4c and 4f-4h).
Figure 4. Treatment and bone marrow transplant experiments in SYKS544Y mice.
(a and b) Relative change of clinical score (left) and ankle thickness (right) of SYK inhibitor-treated (R406) (a) 1-month-old mice (n=3) and (b) 3-months-old mice (n=3). Unpaired t-test. (c) Change of clinical score and ankle thickness in 10-weeks-old irradiated (7.5 Gy) wild-type or SYKS544 mice transplanted with SYKS544 bone marrow or wild-type (age=4 months) bone marrow. Numbers of mice from left to right: n=5; n=10; n=6; n=12. Mann-Whitney test. (d and e) Change of (d) clinical score (n=6) and (e) ankle thickness (n=10) in 10-weeks-old irradiated (7.5 Gy) SYKS544 mice transplanted with SYKS544 bone marrow or wild-type (age=4 months) bone marrow over time. (f and g) Change of (f) clinical score (n=7) and (g) ankle thickness (n=12) in 10-weeks-old irradiated (7.5 Gy) wild-type mice transplanted with wild-type or SYKS544 bone marrow (age = 4 months). Unpaired t-test. (h) Micro-CT image of the ankle joints of wild-type (left) and SYKS544Y (right) mice 6 months after bone marrow transplantation (boxed areas show higher digital magnifications), and photographs of the hind limb of wild-type (left panel upper right) and SYKS544Y (right panel upper right) mice 6 months after bone marrow transplantation. Line plots indicate mean±SD. Box and whiskers plots indicate median and interquartile range and minimum to maximum range.
DISCUSSION
SYK is a critical signaling molecule and a therapeutic target for autoimmune disease and cancer. Here we report causal SYK variants in humans with immune dysregulation and inflammation. Functional studies demonstrate that the observed monoallelic variants are gain-of-function, causing constitutive activation of SYK and downstream signaling associated with an augmented response to immunoreceptor engagement. In patients this constitutive SYK activation results in immune defects and varying degrees of inflammation in intestinal, skin, joint, liver and nervous system tissues, as well as lymphoma predisposition. SYK plays a complex role in a number of cellular processes including adaptive and innate immunity in both bone marrow derived and epithelial cells 1. While we provide functional insight into the role of SYK gain-of-function variants in human disease, specifically joint disease, the underlying function of activated SYK in the pathogenesis of disease in other tissues and/or disease processes is not yet fully understood.
Constitutive phosphorylation and activation of SYK has been observed in autoimmune disease 16. Our data support the role of SYK activation in the initiation of arthritis, as we found that SYKS544Y gain-of-function mice developed severe erosive arthritis. SYKS544Y mice had increased counts of multinucleated osteoclasts following in vitro differentiation from bone marrow derived macrophages in the presence of M-CSF and RANKL. These data are complementary to a recent report on the role of osteoclasts in erosive arthritis where osteoclast-specific and hematopoietic-specific knockout of Syk resulted in a reduction of bone resorption and increased trabecular bone mass in mice 17. In SYKS544Y mice ankles we found a marked infiltration of integrin alpha M+ (CD11b+) MNPs that may contribute to the substantial increase in the number of osteoclasts in the joints of the SYKS544Y gain-of-function mice and provide a potential mechanism for erosive arthritis. Indeed, CD11b has been identified as an osteoclastogenesis promoting factor through SYK-dependent signaling in MNPs 18.
In addition to its role in MNPs and osteoclasts, we also found that the inflamed joints of SYKS544Y mice showed a marked cellular infiltration of macrophages and T lymphocytes, suggesting that these immune cells contribute to disease. The mechanism by which constitutive activation of SYK in macrophages and monocytes leads to erosive arthritis in mice and patients is not clear. Given the function of SYK in signaling from immunoreceptors, integrins, and Toll-like receptors (TLRs) 1,2, it is possible that elevated signaling from TLRs in phagocytes of the joints leads to a feed-forward mechanism whereby elevated inflammatory cytokine production subsequently recruits monocytes to the joint fluid.
The majority of patients with SYK gain-of-function variants had mild and/or intermittent intestinal disease. Similarly, SYKS544Y mice did not develop spontaneous intestinal inflammation. These findings would suggest that while active SYK in the intestinal epithelium can prime inflammatory responses, it may not be sufficient to cause colitis. Instead, intestinal dysbiosis combined with SYK hypersensitivity may drive the inflammatory disease as suggested by our human intestinal epithelial cell experiments using microbial-associated molecular patterns from both bacterial and fungal cell wall components. Interestingly, we found an extreme expansion of CD4+ Th17 and Th1 and CD8+ effector/memory cells in Patient 1 that may reflect and contribute to Patient 1’s severe disease course. Due to the lack of comparable samples in other patients with gain-of-function variants in SYK, this finding awaits further replication. While the original driver of intestinal inflammation remains to be identified, the SYK inhibitor fostamatinib does lead to reduced disease severity of intestinal inflammation in rodent models of colitis 19,20, suggesting that it may be a treatment for at least a subset of patients with SYK-driven colitis.
SYK knockout studies in mice have revealed its critical role in normal embryonic development 3,4 and function as a pro-survival factor in B cells during pro- to pre-B cell transition and mature B cell generation 5. We demonstrate that SYK gain-of-function variants results in reduced B cells and dysgammaglobulinemia in mice and humans. Hyperactivation of SYK in murine B cells has been associated with terminal differentiation and apoptosis by suppression of anti-apoptotic BCL-2 and induction of BLIMP-1 21. Importantly in B cell malignancy, SYK hyperactivation, in combination with anti-apoptotic factors such as BCL-2 21 or c-MYC 22, suggests that SYK may act as a tumor promoter. Indeed, we identified diffuse large B cell lymphomas (DLBCL) at a comparatively young age in two of the four adult patients (P5 and P6) with pathogenic SYK variants. Whereas SYK hyperphosphorylation has been identified as a key therapeutic checkpoint in patients with lymphoma, mutations in SYK are rare and occur in less than 3% of patients with this disease 23. However, in DLBCL, CD79B and MYD88 mutations in the BCR and TLR signaling pathways are frequently observed. These mutations drive pro-survival signaling via hyperphosphorylation of SYK 24,25. Furthermore, the SYK variant identified in Patient 6 (p.A353T) is present in the COSMIC database 26 of somatic cancer mutations (8 counts: 5 large intestine, 2 liver, 1 prostate) and reported in 7 out of 122 tumour cell lines, making it one of the most prevalent tyrosine kinase mutations observed 27. The loss of SYK in myeloid cells (LysMCre+/–Sykfl/fl) has also been shown to protect against fungal induced colorectal cancer 28, indicating that the divergent roles of SYK in cancer pathogenesis29 are likely due to cell-specific SYK signaling and potential secondary hits. Overall, these data suggest that patients with suspected SYK gain-of-function variants should be regularly screened for hematological malignancies.
We showed that treating SYKS544Y mice with the SYK inhibitor R406 reduced ankle thickness and clinical arthritis scores. Although fostamatinib failed in an initial trial of rheumatoid arthritis patients that were not responsive to a biologic agent, a subsequent meta-analysis concluded that fostamatinib was effective 30,31. In patients with polygenic forms of Th17- and Th1-driven tissue inflammation, including arthritis 31–33, our findings support the pharmacological inhibition of SYK. Our data also point to alternative treatment strategies that target molecules downstream of SYK signaling 34,35. Finally, the mouse data presented here indicate that allogeneic haematopoietic stem cell transplantation is a potential treatment option for patients with SYK gain-of-function variants. However, as SYK has known epithelial expression and the SYK variants identified here were shown to result in hyperactivated epithelial SYK signaling, tissue-specific inflammation may not be amenable to transplant.
Overall, our study highlights that the steady-state control of SYK phosphorylation is critical to maintaining immune homeostasis.
MATERIALS AND METHODS
Subjects/Ethics Approval:
Experiments were carried out with Research Ethics Board (REB) approval from the Hospital for Sick Children, the Henan Children’s Hospital, the Oxford IBD cohort study (Rare disease subproject), Ludwig Boltzmann Institute for Rare and Undiagnosed Diseases and Genomics England Research Consortium. Informed written consent to participate in research was obtained from patient/families and controls.
Whole exome sequencing (WES) and variant analysis:
WES was performed as previously described 37,38, with minor changes. Briefly, reads were aligned to GRCh37, variants were called following the GATK 39 best practice pipeline and VEP 40 was used for annotation. Common variants were filtered using maf >0.01 in 1,000 Genomes 41, gnomAD (v2.1), and dbSNP build 149. Internal cohort frequency was used to remove recurrent variants.
DNA purification from buccal swabs – Patient 5 and 6:
Genomic DNA was purified from buccal swab samples according to the QIAamp® DNA Mini Kit (Qiagen) and amplified by PCR (35 cycles) using Phusion High-Fidelity Taq polymerase (Thermo-Fisher).
Constructs:
p3xFlag Plasmid CMV™-14 from Addgene (Cat.#: E4901) was used for the expression of SYK variants and purchased from ACGT Canada and validated by sequencing.
Cell culture and transfection:
Human embryonic kidney (HEK) 293 cells were cultured at 37°C in DMEM supplemented with 10% FBS (Gibco), penicillin (100 IU/mL) and streptomycin (100 μg/mL) (Sigma-Aldrich). HEK293 cells were seeded in 24 wells plates (Luciferase assay) or 12 wells plates (immunoblotting) and cultured for 16 to 24 hours before transfection using PolyJet (SignaGen) and equal amounts of DNA.
Peripheral blood mononuclear cells (PBMCs) were isolated by gradient Ficoll centrifugation (Sigma-Aldrich). For the analysis of SYK and pSYK by immunoblotting PBMCs were cultured overnight in RPMI1640 supplemented with 20% FBS.
For ex vivo T cell phenotyping, PBMCs were cultured in RPMI-1640 with glutamine (Sigma-Aldrich) supplemented with 5% human serum (NHS Blood Center Oxford), 1% sodium-pyruvate, 1% non-essential amino acids (Gibco), 1% penicillin/streptomycin (Gibco), afterwards referred to as complete medium.
Generation of SYK S550Y stably expressing intestinal epithelial cells:
SW480 human colon epithelial (ATCC, Manassas, VA) were seeded in 6-well plates and the next day transfected with human WT SYK expression vector pWZL-Neo-Myr-Flag-SYK, and the SYK S550Y derivative, as well as a GFP-carrying vector, to assess transfection, using Lipofectamine 3000 (Thermo Fisher Scientific). 48 hours post transfection G418 (Enzo, 1.1 mg/mL) was added to select for stable expression. Resistant cells were maintained in the presence of G418. All cells were grown in RPMI medium, supplemented with 10% FBS, 100 units/mL penicillin G, and 100 μg/mL streptomycin (Biological Industries, Beit Haemek, Israel) and maintained in a humidified incubator at 37°C with 5% CO2.
Luciferase reporter assays:
HEK293 cells were transfected with 200 ng of expression plasmid, and 10 ng NF-κB or 100 ng AP-1 reporter plasmid (Promega). To normalize the transfection efficiency, 10 ng pRL-TK Renilla Luciferase reporter plasmid was used. After 18 hours transfection, cells were stimulated with 20 ng/mL TNF or phorbol myristate acetate (PMA) (InvivoGen), and 2 μM SYK inhibitor R406 (InvivoGen) for 16 hours before measurement. Cells were harvested using passive lysis buffer (Promega) and Luciferase assays were carried out using a dual-specific Luciferase reporter assay system (Promega) according to the instructions. Each experiment was performed in triplicate.
Immunoblotting (PBMC and HEK293):
Cell lysates were harvested after washing with ice-cold PBS and then lysed with ice-cold lysis buffer (150 mM NaCl, 50 mM HEPES, 1% Triton X-100, 10% glycerol, 1.5 mM MgCl2, 1.0 mM EGTA) supplemented with protease and phosphatase inhibitors (100 mM NaF,1 mM Na3VO4, 1 mM PMSF, 1:1000 Aprotinin, 1:1000 Leupeptin, and 1:1000 Pepsin). Lysates were separated by 4%−20% SDS-PAGE gels (Bio-Rad Laboratories), then transferred to polyvinylidene difluoride membranes using the Trans-Blot Turbo Blotting System (Bio-Rad Laboratories). Membranes were blocked with 5% skim milk diluted in PBST for 1 hour prior to incubation while shaking in individual primary antibodies overnight at 4°C. For detection blots were incubated with goat anti-mouse or goat anti-rabbit antibodies conjugated with HRP for 1 hour at room temperature and visualized using Immobilon Forte western HRP substrate (Millipore Sigma) and the Odyssey® Fc imaging system (LI-COR). (see Reporting Form for antibody details)
Cell lysis and western blot analysis of SW480 cells:
Confluent cells were solubilized in lysis buffer (50 mM HEPES(pH7.5), 150 mM NaCl, 10% glycerol, 1% Triton X, 1 mM EDTA (pH8), 1 mM EGTA(pH8), 1.5 mM MgCl2, 1 mM Na3VO4), and a protease inhibitor cocktail (539131, Calbiochem). Lysates were cleared by centrifugation (21,000 g for 10 min at 4 ºC), sample buffer was added, and lysates were boiled for 5 min. Proteins were resolved by 4–20% gradient NuSEP Tris-Glycine gels and transferred to a nitrocellulose membrane. Membranes were blocked for 1 h in TBST buffer containing 6% nonfat milk and incubated with primary antibodies according to the manufacturer’s instructions: rabbit monoclonal human SYK phosphorylated on Tyr 525/526, rabbit polyclonal human SYK phosphorylated on Tyr 323, mouse anti-human SYK monoclonal Ab, mouse anti-GAPDH, mouse anti α-tubulin, JNK, and rabbit β-actin polyclonal Ab. A 1 h incubation with fluorescent secondary antibodies (IRDye 680RD Goat anti-Mouse and 800CW Goat anti-Rabbit) was performed at room temperature in TBST. Signals were visualized using Odyssey imager.
Immunofluorescence analysis on biopsy samples:
Intestinal tissue samples from patients and controls were processed as previously described42. Paraffin was removed using xylene and dehydrated in ethanol at degraded concentrations. Antigen retrieval was performed using high pressure-cooking in 1 mM EDTA buffer at pH 9.0. Tissue sections were blocked for 1 h at room temperature with 5% BSA and 15% goat serum in 1X PBS. Slides were incubated with primary antibody overnight at 4°C. Next day, the sections were washed 3 times in PBS for 10 minutes. Tissue slides were incubated with secondary antibody for 1 hour in darkness at room temperature. The following primary antibodies were used: rabbit anti-SYK, anti-phospho SYK (Y525/526), and anti-β-catenin. Alexa Fluor 488 goat anti-mouse and Alexa Fluor 568 goat anti-rabbit were used as secondary antibodies. Nuclei were stained using Hoechst 33342 Fluorescence Stain (Thermo Scientific). Finally, mounting of stained sections were performed using Vectoshield Mounting Medium (Vector Laboratories, CA). Images of stained slides were taken on an Olympus Spinning disk confocal microscope.
Alternatively, tissue sections were collected, dewaxed and subjected to antigen retrieval using a microwave and Target Antigen Retrieval Solution according to the manufacturer’s instructions (Dako). Tissue sections were blocked with 10% (v/v) normal Goat serum before being incubated with monoclonal Mouse anti-CD8 antibody and polyclonal Rabbit anti-CD4 in combination or Mouse anti-CD68 antibody and polyclonal Rabbit anti-pSYK (Tyr 525/526) in combination. Following incubation, primary antibody labelling was detected with Goat anti-Mouse Alexa Fluor™ 647 (Life Technologies) and Goat anti-Rabbit Alexa Fluor 555 (Life Technologies). Nuclei were stained with Hoechst 33258 pentahydrate (bis-benzimide) (Life Technologies) and slides mounted with Glycerol:PBS containing N-Propyl Galate. Images were collected on an Olympus BX51 microscope.
Immunohistochemistry:
Formalin-fixed paraffin-embedded tissue were sectioned at five microns and collected onto Superfrost glass slides. Tissue sections were dewaxed in Xylene and rehydrated through graded alcohol to water. Endogenous peroxidase activity was blocked with 3% (v/v) hydrogen peroxide before masked antigens were retrieved by microwaving in Target Retrieval Solution (Dako). Endogenous Avidin and Biotin were blocked (Vector Laboratories) and the tissue sections blocked with 10% (v/v) normal horse serum for mice primary antibodies or normal Goat serum (Sigma-Aldrich) for primary antibodies raised in Rabbit. Tissue sections were incubated overnight at 4°C in a humidified environment either with Mouse anti-CD3 antibody, monoclonal Mouse anti-CD8 antibody; polyclonal Rabbit anti-CD4 or polyclonal Rabbit anti-pSYK (Tyr 525/526).
Following incubation, primary antibody labelling was detected with a Biotinylated Horse anti-Mouse IgG or a Biotinylated Goat anti-Rabbit IgG secondary antibody (Vector Laboratories). Tissue sections were then incubated with Streptavidin Horseradish Peroxidase (HRP) (Vector Laboratories) and signal detected using Diaminobenzidine (Vector Laboratories). Tissue sections were counterstained with Mayer’s Haematoxylin (Sigma-Aldrich) before being dehydrated through graded alcohol to Xylene and mounted with DPX and coverslips applied. Images were collected on an Olympus BX51 microscope.
Stimulation of chemokine secretion and quantitation by ELISA:
Cells were seeded in 12 well plates at a density of 7.5×10⁵ (SW480) cells/well. After overnight incubation, the medium was replaced with fresh medium and Zymosan (tlrl-zyn, InvivoGen, San Diego, CA) or Curdlan (C7821 Sigma-Aldrich, St. Louis, MO). To avoid possible contaminating with endotoxin, we used endotoxin-free (<0.001 EU) Zymosan or Curdlan. Where indicated the SYK inhibitors [3-(1-methyl-1H-indol-3-yl-methylene)-2-oxo-2,3-dihydro-1H-indole-5-sulfonamide], (*574711, CAS 622387–85-3 Calbiochem, Merck-Millipore, Darmstadt, Germany) and R406 (Invivogen), were added 1 hour prior to the addition of Zymosan. All treatments were performed in duplicates/triplicate. After 20 hours, supernatants were collected, and maintained at −70ºC until analysis. IL-8, CCL2, CXCL1 and GM-CSF concentrations were determined using ELISA (DY208, DY271, DY215 and DY275 respectively from R&D systems) according to the manufacturer’s instructions.
Ex vivo T cell phenotyping and analysis of cytokine production:
Expression of surface markers was analyzed by staining for 15 min at room temperature in PBS supplemented with 0.5% (v/v) human serum using the following fluorophore-conjugated antibodies: anti-CD3, anti-αβTCR, anti-CD4, anti-CD8, anti-CD14, anti-CD19, anti-CD25, anti-CD45RA, anti-CD56, anti-CCR4, anti-CCR6, anti-CCR7, anti-CXCR3. For the exclusion of dead cells during the analysis, cells were stained prior to fixation using Fixable Viability Dye eFluor® 780 (eBioscience) according to the manufacturer’s instructions.
For ex vivo intracellular cytokine staining, total PBMC were stimulated for 5 hours with PMA (0.2 μM; Sigma-Aldrich) and Ionomycin (1 μg/mL; Sigma-Aldrich) in the presence of Brefeldin A (BFA, 10 μg/mL; Sigma-Aldrich) for the final 2.5 hours of culture.
Cells were fixed and permeabilized with Cytofix/Cytoperm (BD Biosciences) according to the manufacturer’s instructions. For the exclusion of dead cells during the analysis, cells were stained prior to fixation using Fixable Viability Dye eFluor® 780 (eBioscience) following the manufacturer’s instructions. Fluorophore-conjugated anti-cytokine antibodies used for analysis include anti-IL-10, anti-IL-13, anti-IL-17A, anti-IL-22, anti-IFN-γ, and anti-TNF.
For the analysis of transcription factor expression unstimulated PBMCs were stained for surface marker and live/dead staining, fixed (1 hour at room temperature) and permeabilized (1 hour at room temperature) using the Transcription factor staining buffer set (eBioscience). Cells were subsequently stained (1 hour at room temperature) for RORγt. Data were acquired on a Becton Dickinson & Company (BD) LSRII or BD LSRFortessa and analyzed using FlowJo version 10.7.1 (BD).
For gating strategies please see Supplementary Fig. 1-3. Flow Cytometry Data were collected using BD FACS Diva software (v8.0.2) on a BD LSRII and data analyzed using FlowJo version 10.7.1 (BD).
SYK ELISA:
24–48 h after transfection of equal amounts of plasmid (400 ng), Phospho-SYK (panTyr) Sandwich ELISA Kit (#7298, CST) was used to assess SYK phosphorylation. Absorbance at 450 nm was measured using a plate reader (Molecular Devices, LLC) ~1 minute after the addition of stop solution.
Phosphoflow analysis:
HEK293 cells were plated in 96-well flat bottom plates at a density of 25000 cells/well. Following 24 hours, cells were transfected with the ratio 0.2 μg DNA/0.4 μL Lipofectamine2000 per well in Optimem media (Gibco). 24 hours post transfection cells were serum starved in DMEM for 2 hours. To exclude dead cells, cells were washed in PBS (Sigma-Aldrich) and stained on ice using the Fixable Viability Dye eFluor® 780 (eBioscience) for 15 minutes. Cells were washed with PBS plus 0.5% BSA (Sigma-Aldrich) and fixed by incubation in 3.7% formaldehyde (Sigma-Aldrich) at 37°C for 20 min. Permeabilization was performed on ice for 30 min in −20°C 90% methanol (Merck). Staining was performed for 1 hour at room temperature in PBS with 0.5% BSA using the PE-conjugated antibody pSYK (Tyr525/526) and biotinylated SYK antibody. For detection of total SYK Streptavidin-Phycoerythrin-Cy7 (PE-Cy7) was used Flow Cytometry Data were collected using BD FACS Diva software (v8.0.2) on a BD LSRII and data analyzed using FlowJo version 10.7.1 (BD).
Structural model:
The molecular structure of human SYK was retrieved from the Protein Data Bank (https://www.rcsb.org/) code 4FL2 11. Graphics were generated using UCSF Chimera (Version 1.10).
SYK conservation analysis:
The conservation of SYK across species was analysed using the ConSurfServer43,44 (version: ConSurf – 2016). For the multiple sequence alignment shown in Extended Data Fig. 2c the EMBL-EBI Clustal Omega online tool (version: 1.2.2) was used.
Generation of SYK (S544Y) mouse model:
S550 in human SYK is equivalent to mouse SYK S544 (Supplementary Fig. 4). At the nucleotide level (Supplementary Fig. 5) an S544Y model was generated by microinjection of Cas9 mRNA, sgRNA (see Supplementary Methods), and ssODNs (see Supplementary Methods) into zygotes as described previously15. Two weeks after birth, genomic DNA from the tail of the newborn F0 mice was extracted for sequencing. Mice were housed in standard cages in a specific pathogen-free facility on a 12-hour light/dark cycle with ad libitum access to food and water. All the animal experiments were performed under the regulations of the Association of Assessment and Accreditation of Laboratory Animal Care in Shanghai and were permitted by East China Normal University Center for Animal Research.
Western blot and Real-time PCR:
Ankle tissue was homogenized in liquid nitrogen and the total protein content was released in lysis buffer (50 mM Tris(pH 7.4), 150 mM NaCl, 1% Triton X-100, 1% sodium deoxycholate, 0.1% SDS, plus protease inhibitor cocktail and phosphatase inhibitor cocktail). Expression of SYK and pSYK protein was visualized by anti-SYK and anti-pSYK antibodies. For qPCR, orbital whole blood was collected, and Red Blood Cell (RBC) Lysis Buffer was used to remove RBCs. Total RNA was isolated with RNAiso Plus (TaKaRa). RT–qPCR was performed with SYBR Green (TaKaRa). For qPCR primers sequences see Supplementary Methods.
Micro Computed Tomography (Micro-CT):
Ankle joint or tails from mice were dissected, fixed in 4% paraformaldehyde-PBS at 4°C in the dark on a rolling platform overnight then washed with PBS three times (20 minutes each, and then examined by high-resolution Micro-CT (Skyscan1272). 3D reconstruction was performed using NRecon software (v1.7.0.4), and the images were processed with CTanalyser software (Bruker, v1.16.9.0).
Flow cytometry analysis:
Mouse orbital whole blood was collected into anticoagulation tubes. RBCs were depleted using RBC lysis buffer. Cells were filtered through a 40μm strainer, collected centrifugation (1800 rpm, 10 min, 4℃), and resuspended in PBS with 1% FBS.
Whole spleen was chopped into pieces and filtered through a 40 μm strainer, 2 mL trypsin was added for 3–5 minutes. The reaction was terminated by adding 4 mL DMEM + 5% FBS. RBCs were depleted using RBC lysis buffer and the cells were collected by centrifugation (1800 rpm, 10 minutes, 4℃). Cell pellets were resuspended in wash buffer (1% FBS in PBS).
Ankles were dissected and chopped into 2 mm pieces and incubated in 5 mL digestion buffer (2mg/mL Dispase II, 2mg/mL Collagenase IV) for 90 minutes. Supernatant was passed through a 100 μm strainer and centrifuged at 1200 rpm at room temperature for 5 minutes and resuspended in PBS with 1% FBS.
For flow cytometry, 1 million cells were stained with antibodies (Reporting Form) for 30 minutes at 4℃,followed by 3 washes with wash buffer and centrifugation at 1000 rpm 4℃ for 10 minutes. Finally, supernatants were discarded, and cells resuspended in 300 μL wash buffer for analysis using a LSRFortessa and FlowJov10.7.1 (BD).
For gating strategies please see Supplementary Fig. 6 and 7. Flow Cytometry Data were collected using BD FACS Diva software (v8.0.2) on a BD LSRFortessa and data analyzed using FlowJo version 10.7.1 (BD).
Assessment of arthritis:
Arthritis severity was assessed weekly for 24 weeks from 2 weeks after birth. The severity of arthritis was assessed in each mouse using an established semi-quantitative scoring system45 of 0–4. Each limb was scored as follows: 0, normal, without any macroscopic signs of arthritis; 1, mild, redness and swelling of the ankle, or apparent redness and swelling limited to individual digits, regardless of the number of affected digits; 2, moderate, redness and swelling of the ankle; 3, redness and swelling of the entire paw including digits; 4, maximally inflamed limb with involvement of multiple joints (maximum possible score 16). Ankle fore paw and hind paw thickness were measured with a Vernier caliper. Photographs were taken at 4 weeks and 3 months. To assess articular function, mice were placed on a wire grid that was flipped upside down, and the length of time the mice held on during a 20-second assessment period was recorded. This test was performed 15–20 times at the age of 4 weeks and 3 months.
Pharmacologic inhibition of SYK in vivo:
One and three months-old SYK (S544Y) mice were treated by intragastric administration with 100 μL R406 (dissolved in 5% DMSO + 95% corn oil) at 2 mg/mL twice a day (∼10 mg/kg per day), while mice in the wild-type group were treated with 100 μL vehicle (5% DMSO + 95% corn oil) daily. R406 treatment was carried out for 28 days. Arthritis clinical scores were recorded every two days using the ankle thickness and the semi-quantitative scoring system described above.
Bone marrow transplantation:
Mice were irradiated with 7.5 greys and received donor bone marrow cells (3×10⁶) by tail vein. X-rayed mice that received no BMs died in a week.
Measurement of Serum and ankle Inflammatory factors:
Orbital blood was collected and kept at room temperature for 15 min, then centrifuged at 12000 rpm for 5 minutes, prior to serum collection. Inflammatory factors were measured by Dakowei Co., Ltd. (Shanghai).
Generation of bone marrow-derived dendritic cells and macrophages:
Murine bone marrow derived DCs were generated as described previously 46. The medium was changed every other day. LPS (200 ng/mL, Sigma) was added on day 6 to induce DC maturation. SYK inhibitor R406 (Selleck, S1533) was added 30 minutes before LPS stimulation. Mature DCs in the supernatant were collected 24 hours later for WB.
Mouse bone marrow-derived macrophages were generated as previously described 47. After a 24-hour LPS stimulation, adherent mature macrophages were collected for WB analysis.
Ex Vivo Osteoclast Differentiation and TRAP staining:
Osteoclasts were differentiated from bone marrow cells as described 48,49. TRAP and ALP double-staining kit (TaKaRa, MK300) was used to detect TRAP-positive multinucleated osteoclasts according to the manufacturer’s protocol. Mature osteoclasts were identified as multinucleated (>3 nuclei) TRAP+ cells.
Immunofluorescence of mice ankle tissue:
Ankles of 3-month-old mice were fixed in 4 % PFA overnight, decalcified in 0.5 M EDTA/PBS for 3 weeks, dehydrated, paraffin wax embedded, and sectioned to 5 μm. Image J50–52 was used to calculate TRAP+ area.
Statistical analysis:
GraphPad Prism 9 Software was used to assess statistical significance by applying two-tailed unpaired t-tests and two-tailed Mann-Whitney tests as described in figure legends. P values < 0.05 were considered statistically significant. Figures only present statistically significant P values.
Data availability:
The identified SYK variants are submitted to the ClinVar database (https://www.ncbi.nlm.nih.gov/clinvar/) with IDs, SCV001450452 [c.1649C>A, p.S550Y], SCV001450453 [c.1649C>T, p.S550F], SCV001450454 [c.1024C>A, p.P342T], SCV001450455 [c.1350G>A, p.M450I], and SCV001450456 [c.1057G>A, p.A353T]. The whole exome sequencing data will not be made publicly available as they contain information that could compromise research participant privacy/consent. Information on the whole-exome sequencing raw data supporting the findings of this study is available from the corresponding authors HHU, YH, KB, and AMM upon request. Publicly available datasets/databases used in this study include the Catalogue Of Somatic Mutations In Cancer (COSMIC) database (https://cancer.sanger.ac.uk/cosmic), Kinase.com (http://www.kinase.com/human/kinome/) and the RCSB Protein Databank (PDB, https://www.rcsb.org/).
Extended Data
Extended Data Fig. 1. Genetic analysis pipeline and validation of heterozygous variants by sanger sequencing.
Variant identification pipeline and Sanger sequencing validation of WES data for (a) Patient 1 (p.S550Y), (b) Patient 2 (p.S550F) and Patient 3 (p.S550F) and (c) Patient 4 (p.P342T). (d) Chronologic disease course and Sanger sequencing validation for Patient 5 (p.M450I) and (e) Patient 6 (p.A353T).
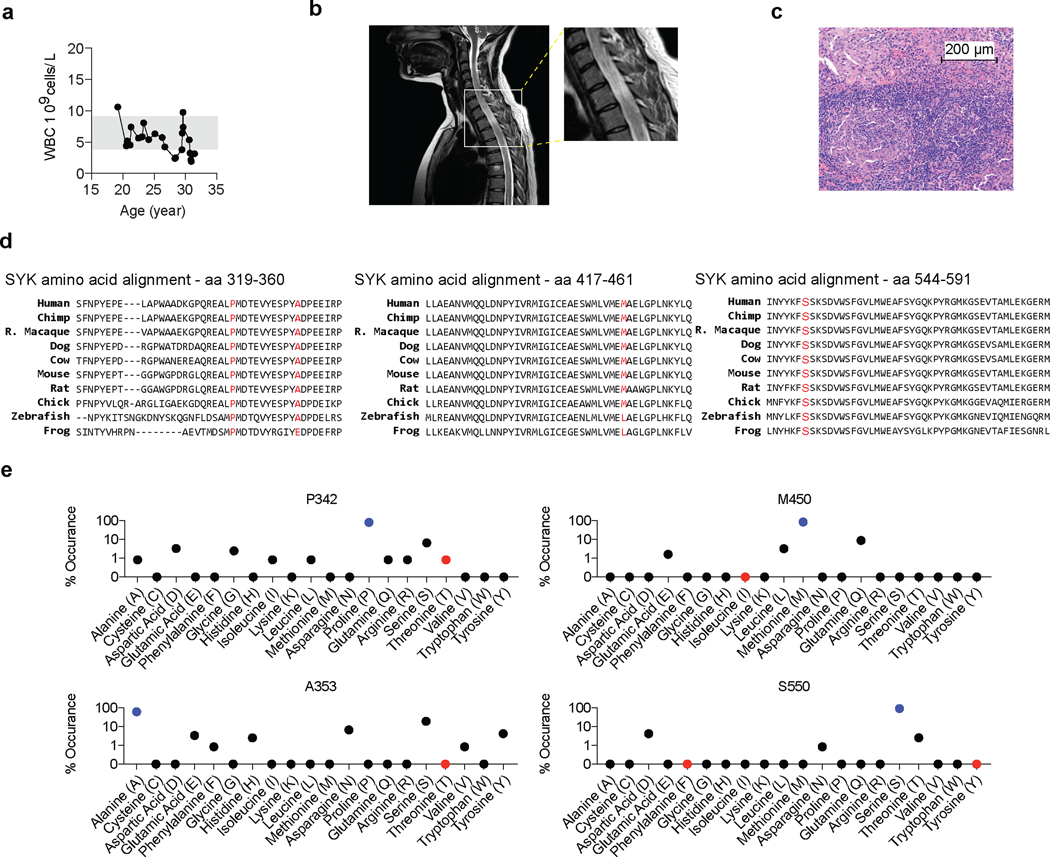
Extended Data Fig. 2. Patient 4 phenotype summary and SYK variants conservation analyses.
(a) Patient 4’s laboratory tests revealed normal white blood cell (WBC) counts. (b) Cervical and thoracic spine MRI of Patient 4 taken at 26 years of age showing a signal enhancing intramedullary space-occupying lesion through nearly the entire length of the cervical and thoracic spinal cord. One representative image out of 6 acquired images is shown. All images revealed signs of inflammation. (c) Spinal cord biopsy with prominent granulomatous inflammation (clinical data, n=1). (d) Species conservation of SYK amino acids p.P342, p.A353, p.M450, and p.S550. (e) Summary of the residue variety in % for each identified variant in SYK across 124 homologues across species following ClustalW-based multiple sequence alignment using the ConSurf server (see Methods). Human wild-type SYK residues are indicated in blue and human SYK variants in red.
Extended Data Fig. 3. SYK hyperphosphorylation in human epithelial cells.
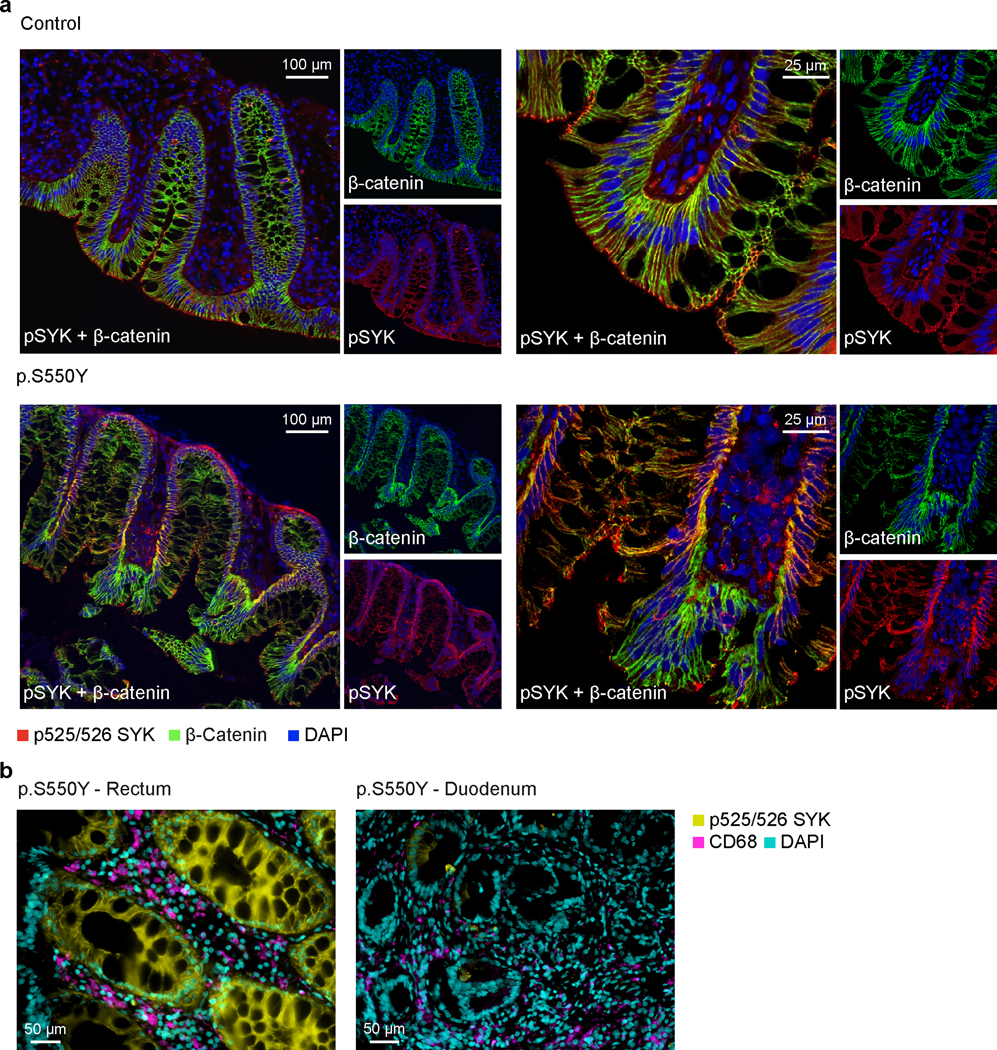
(a) SYK hyper-phosphorylation in intestinal tissue from Patient 1 compared to healthy controls. Double immunostaining of normal and p.S550Y SYK variant colon biopsy sections for pSYK (red), β-catenin (green) and merged dual labeling (yellow). The normal case demonstrated a distinctive glandular apical expression of pSYK. The fine apical signal almost reaches to the microvilli. Scattered infiltrated cells show pSYK staining in lamina propria. Unstained patches of glandular epithelium represent goblet cells. Immunostaining of β-catenin as a structural membrane marker indicates an organized glandular architecture in the normal colon section. Staining for pSYK was evident at the glandular epithelial base (membrane and cytoplasm) in colon sections of the patient. The β-catenin labeling in patient 1 intestinal biopsies presented a disorganized glandular architecture compared to the normal control. One representative image is shown out of 3 total images acquired. (b) Double immunostaining of pSYK and the myeloid marker CD68 in rectal and duodenal biopsy sections of Patient 1 illustrating strong pSYK expression in intestinal epithelial cells with moderate overlap with CD68+ myeloid cells. One representative image is shown out of 6 total images acquired from rectal biopsies and 4 images acquired from duodenal biopsies.
Extended Data Fig. 4. Comparative assays of human SYK variants and reduction of SYK phosphorylation by R406 SYK inhibitor treatment.
(a) Flow cytometry comparison of percent phosphorylated SYK (Y525/526) normalised to ectopic SYK expression in HEK293 cells. (b) Non-normalised data presentation of percent phosphorylated SYK (Y525/526). (c) Percent ectopic SYK expression in HEK293 cells following transfection. (d) Relative mean fluorescence intensity (rMFI) of phosphorylated SYK(Y525/526) normalised to ectopic SYK expression. (e) Non-normalised rMFI of phosphorylated SYK(Y525/526) and (f) rMFI of ectopic SYK (a-f: the dotted line indicates WT median; a-c: quartiles and median; d-f: median and interquartile range and minimum to maximum range; n of independent experiments/n of cell culture replicates: eV(8/30), WT(8/24), p.S550Y(8/28), p.S550F(6/21), p.M450I(8/28), p.A353T(8/30), p.P342T(8/30), p.Y323F(3/12); Mann-Whitney test). (g) Western blot analysis of SYK phosphorylation (Y525/526), total SYK expression, JNK phosphorylation (T183/Y185), total JNK expression and GAPDH expression in HEK293 cells after transfection with control, p.Y525F/Y526F mutated SYK, wild-type SYK and the range of different identified variants in SYK (p.S550Y, p.S550F, p.A353T, p.P342T and p.M450I). (h) Quantification of pJNK normalised to total JNK according to (g) (quartiles and median; n of independent experiments: WT(8), p.Y525/526F(8) p.S550Y(8), p.S550F(8), p.M450I(3), p.A353T(3), p.P342T(6); Mann-Whitney test). (i) Analysis of AP-1 (n=4) or NF-κB (n=3) activity by luciferase reporter assay in HEK293 cells following co-transfection with reporter plasmids and empty vector (Control), WT SYK or p.S550Y SYK and 24 hours stimulation with TNF (20 ng/ml) or PMA (20 ng/ml) (Min-max and median; unpaired t-test). (j) Western blot analysis of SYK phosphorylation (Y525/526), total SYK expression, JNK phosphorylation (T183/Y185), total JNK expression, ERK phosphorylation (T202/Y204), total ERK expression and GAPDH expression in HEK293 cells after transfection with wild-type SYK, p.S550Y SYK and p.S550F SYK in presence or absence of R406 SYK inhibitor (2 μM). (k) Quantification of pSYK (Y525/526) (n=7), pJNK (T183/Y185) (n=6), pERK (T202/Y204) (n=6) western blot signals normalised to the respective total protein expression according to (j) (quartiles and median; Mann-Whitney test).
Extended Data Fig. 5. SYK response to stimulation in intestinal epithelial cells.
(a) Western blot analysis of SYK and pSYK (Y525/526) in SW480 cells transfected with plasmid expressing p.S550Y SYK or WT SYK. (b) Time-course of SYK phosphorylation upon zymosan (200 μg/mL) stimulation by Western blot analysis of SYK and pSYK (Y525/526) in SW480 cells for the indicated time (NT = untreated cells). (c) Western blot analysis of SYK, pSYK (Y525/526) and pSYK (323) in SW480 cells transfected with plasmid expressing p.S550Y SYK or WT SYK left either untreated (–) or stimulated with 20 μg/mL or 100 μg/mL zymosan. (d) Western blot analysis of SYK and pSYK (Y525/526) SW480 cells transfected with plasmid expressing p.S550Y SYK or WT SYK left either untreated (NT) or stimulated with curdlan (100 μg/mL) for the indicated time. (e and f) Western blot analysis of SYK and pSYK (Y525/526) in SW480 (e) or in SW480 cells transfected with plasmid expressing p.S550Y SYK (f), upon stimulation with zymosan (200 μg/mL) for 1 hour, in the presence or absence of SYK inhibitor (5 μM, Calbiochem, #574711) added 1 hour prior to zymosan stimulation. (g) IL-8, CXCL1, GM-CSF and CCL2 secretion by 20 hours zymosan-stimulated SW480 cells expressing WT SYK or p.S550Y SYK. SYK inhibitor (5 μM, Calbiochem, #574711) was added 1 hour prior to zymosan stimulation and analysis performed by ELISA. Median and interquartile range and minimum to maximum range; n of independent experiments/n of cell culture replicates: IL-8: (3/3–10); CXCL1, GM-CSF, CCL2: (2–3/2–7); Mann-Whitney test. (h) IL-8, CXCL1, GM-CSF and CCL2 secretion by SW480 cells expressing WT SYK or p.S550Y SYK cells incubated with/without R406 (5 μM) for 60 mins prior to the addition of curdlan and analyzed by ELISA 20 hours following stimulation. Median and interquartile range and minimum to maximum range; n of independent experiments/n of cell culture replicates: 3/3–6; Mann-Whitney test.
Extended Data Fig. 6. Phenotypic and functional analysis of Patient 1 T cells.
(a) Dot plot presentation of CD4+, CD8+ and double negative (DN) T cell frequencies among CD3+αβTCR+ cells as determined by surface staining and flow cytometry of PBMC from Patient 1 at 2 years of age and a 3 year-old healthy donor (HD). (b) Kinetics of CD4/CD8 ratio based on clinical laboratory measurements. (c) CD4/CD8 ratio as estimated from patient intestinal biopsy sections stained for CD3 and CD8 by immunohistochemistry. (d) Intraepithelial CD8+ T cell counts in patient intestinal tissue sections manually counted based on CD4 and CD8 immunofluorescence staining. (e) Dot plot presentation of CD3+αβTCR+CD8+CD25– naïve and memory T cell frequencies as assessed by surface staining of CD45RA and CCR7. (f) Dot plot presentation of TNF and IFN-γ producing CD3+αβTCR+CD8+CD25– memory T cell frequencies as assessed by intracellular cytokine staining. (g) CD3+αβTCR+CD4+CD25– naïve and memory T cell frequencies as assessed by surface staining of CD45RA and CCR7 and flow cytometry analysis. (h) Dot plot presentation of CD3+αβTCR+CD4+CD25– memory CCR6+RORγt+ T cell frequencies as assessed by combined surface and intracellular staining. (i) Presentation of IL-17A, IL-22 and IFN-γ producing CD3+CD4+CD25– memory T cell frequencies. (j) Summary of IL-17A-, IL-22- and IFN-γ-producing CD3+CD4+CD25– memory T cell frequencies as assessed by intracellular cytokine staining following 5 hrs PMA (0.2 μM) and Ionomycin (1 μg/mL) stimulation. Grey areas indicate healthy donor control ranges.
Extended Data Fig. 7. Phenotypic and functional analysis of Patient 1 T cells.
(a) Summary of CD3+CD8+ T cell frequencies of adult healthy donors (HD) (HD adult: n = 26) and 9 months to 14 years old HD (HD 9 month to 14 years: n = 17) and of Patient 1 at 1.5 years and 2 years of age (n = 2, each 3 technical replicates) expressed as percent of live CD3+ T cells. (b) Summary of CD3+CD8+CD25– memory T cell frequencies as assessed by surface staining of CD45RA and CCR7. (c and d) Summary of IFN-γ- (c) and TNF-producing (d) CD3+CD8+CD25– memory T cell frequencies as assessed by intracellular cytokine staining following 5 hours PMA (0.2 μM) and Ionomycin (1 μg/mL) stimulation. (e) Summary of CD3+CD4+CD25– memory T cell frequencies as assessed by surface staining of CD45RA and CCR7. (f) Summary of CD3+CD4+CD25–CCR6+ memory T cell frequencies as assessed by surface staining. (g) Summary of CD3+CD4+CD25–RORγt+ memory T cell frequencies as assessed by combined surface and intracellular staining. (h, i and j) Summary of TNF- (h), IL-10- (i) and IL-13-producing (j) CD3+CD4+CD25– memory T cell frequencies as assessed by intracellular cytokine staining following 5 hours PMA (0.2 μM) and Ionomycin (1 μg/mL) stimulation. (k) CCR6+CCR4+CXCR3– (Th17-enriched) and CCR6+CXCR3+ CCR4– (Th1/Th17-enriched) CD3+CD4+CD25– memory T cell frequencies as assessed by surface staining and flow cytometry.
Extended Data Fig. 8. Phenotypic and functional characterization of SYKS544 mice.
(a) Immunoblot analysis of SYK and pSYK protein levels in ankle of 3 months old mice (wt: n=3; SYKS544Y: n=3). (b) Hematoxylin and eosin stain of tail tissue sections from 3 months old wild-type and SYKS544 mice showing bone erosion and immune cell infiltration (wt: n=3; SYKS544Y: n=3). (c) Hyper-phosphorylation of SYK in intestinal tissue from SYKS544 mice compared to wild-type mice (wt: n=3; SYKS544Y: n=3). (d) Western blot analysis of wild-type and SYKS544 bone marrow derived dendritic cells SYK phosphorylation (Y519/520), total SYK expression, JNK1 (T183/Y185) phosphorylation, total JNK1 expression, ERK1 phosphorylation (T203/Y205) and total ERK1 expression treated or not treated with R406 SYK inhibitor (2 μM, R406 was added 30 minutes prior to LPS (200 ng/mL) stimulation and samples collected after 24 hours) (wt: n=3; SYKS544Y: n=3). (e) Analysis of IgG and IgM in serum from wild-type and SYKS544Y mice by ELISA at indicated age (n=3; Unpaired t-test). (f) RT–qPCR analysis of Il17f (wt: n=3; SYKS544Y: n=6), Csf2 (wt: n=3; SYKS544Y: n=9), Ifng (wt: n=3; SYKS544Y: n=3), Il17a (wt: n=6; SYKS544Y: n=6) and Il4 (wt: n=3; SYKS544Y: n=3) expression in blood at the age of 3 months. Unpaired t-test. (g) Serum cytokine concentrations in wild-type and SYKS544Y mice at 3 months of age measured by ELISA (n=4; unpaired t-test). Violin plots indicate quartiles and median.
Extended Data Fig. 9. Phenotype of immune cells in circulation and tissue of a CRISPR-Cas9-knock-in SYKS544Y mouse model.
(a) Frequencies of live CD45+ cells in blood (top) and ankles (bottom) of wild-type and SYKS544Y mice (blood: n=4, ankle: n=3; unpaired t-test) at the age of 3 months. (b-f) Frequencies and normalised counts of B220+ B cells, CD3+ T cells, CD4+ T cells, Foxp3+CD25+ regulatory T cells (Treg), CD11b+F4/80– mononuclear phagocytes, CD11b+F4/80int mononuclear phagocytes and CD11b+F4/80+ macrophages (Mɸ) in blood (top) and ankles (bottom) of wild-type and SYKS544Y mice at the age of 3 months (blood: n=4, ankle: n=3; Treg-blood: n=3, Treg-ankle (wt): n=2, Treg-ankle (SYKS544Y): n=4; unpaired t-test). Normalised counts were calculated as counts/1*105 live CD45+ cells relative to the average change in live CD45+ cells comparing wild-type and SYKS544Y mice. Violin plots indicate quartiles and median.
Extended Data Fig. 10. Full blood counts of wild-type and CRISPR-Cas9-knock-in SYKS544Y mice.
Full blood counts of wild-type (n=5) and SYKS544Y (n=6) mice; Mann-Whitney test. Box plots and whiskers indicate median and interquartile range and minimum to maximum range. MCV: mean corpuscular volume; MCH: mean corpuscular haemoglobin; MCHC: mean corpuscular haemoglobin concentration; MPV: mean platelet volume.
Supplementary Material
ACKNOWLEDGEMENTS
The authors thank the patients, their families, and all healthy individuals who actively participated in this study. The authors thank Karoline Fiedler for assistance with patient related materials and Dr. Hong-Bing Shu (Wuhan University, China) for providing plasmids. We acknowledge the contribution to this research through access to the data and findings generated by the 100,000 Genomes Project. The 100,000 Genomes Project is managed by Genomics England Limited (a wholly owned company of the Department of Health). The 100,000 Genomes Project and or research infrastructure are funded by the National Institute for Health Research, National Health Service England, the Wellcome Trust, Cancer Research UK, and the Medical Research. The 100,000 Genomes Project uses data provided by patients and collected by the National Health Service as part of their care and support. We acknowledge the contribution of the Oxford IBD cohort study and the Gastrointestinal Illness Biobank, which are supported by the NIHR Biomedical Research Centre, Oxford. We acknowledge the contribution of the VEOIBD.org Consortium.
DL, ZZ, XC, and Liren W are funded by the National Key R&D Program of China (2019YFA0110802). Lin W and YH are funded by the JiuJiu Charitable Trust. Lin W was supported by Chinese Government Scholarship. CK and DK are funded by German Research Foundation CRC1054 Project A05 and the Care-for-Rare Foundation. HHU and DA are supported by the NIHR Biomedical Research Centre, Oxford. QL and DL were supported by a Crohn’s and Colitis Canada (CCC), Canadian Association of Gastroenterology (CAG), and Canadian Institute of Health Research (CIHR) Fellowship. KB is supported by a European Research Council Consolidator Grant (iDysChart, ERC grant agreement number: 820074). BG receives support through the DFG SFB1160/2_B5, under Germany’s Excellence Strategy (CIBSS – EXC-2189 – Project ID 390939984, and RESIST – EXC 2155 – Project ID 39087428); through the E-rare programme of the EU, managed by the DFG, grant code GR1617/14-1/iPAD; and througxsh the “Netzwerke Seltener Erkrankungen” of the German Ministry of Education and Research (BMBF), grant code: GAIN_ 01GM1910A. WHAK was supported by operating grants from the Canadian Institutes of Health Research (CIHR; PJT-156095 and PJT-153168). SH, KRE and HG were funded by the Wellcome Trust (207556_Z_17_Z). AMM, CK, SBS, HHU, ID, and SCN are funded by the Leona M. and Harry B. Helmsley Charitable Trust. AMM, CK, and SBS are funded by NIH (RC2DK122532) Grant. AMM is funded by a Canada Research Chair (Tier 1) in Pediatric IBD, CIHR Foundation Grant and NIDDK NIH (RC2DK118640).
Genomics England Research Consortium: Helen R. Griffin30 and Sophie Hambleton38
(30) Translational and Clinical Research Institute, Faculty of Medical Sciences, Newcastle University, Newcastle upon Tyne, UK.
(38) Faculty of Medical Sciences, 100KGP England, Newcastle University, Newcastle upon Tyne, UK.
Footnotes
Competing interests: The authors declare no competing interests.
A full list of members and their affiliations appears in the Supplementary Information.
References
- 1.Mocsai A, Ruland J & Tybulewicz VL The SYK tyrosine kinase: a crucial player in diverse biological functions. Nat Rev Immunol 10, 387–402 (2010). [DOI] [PMC free article] [PubMed] [Google Scholar]
- 2.Dennehy KM et al. Syk kinase is required for collaborative cytokine production induced through Dectin-1 and Toll-like receptors. Eur J Immunol 38, 500–6 (2008). [DOI] [PMC free article] [PubMed] [Google Scholar]
- 3.Turner M. et al. Perinatal lethality and blocked B-cell development in mice lacking the tyrosine kinase Syk. Nature 378, 298–302 (1995). [DOI] [PubMed] [Google Scholar]
- 4.Cheng AM et al. Syk tyrosine kinase required for mouse viability and B-cell development. Nature 378, 303–6 (1995). [DOI] [PubMed] [Google Scholar]
- 5.Jakus Z, Simon E, Balazs B & Mocsai A. Genetic deficiency of Syk protects mice from autoantibody-induced arthritis. Arthritis Rheum 62, 1899–910 (2010). [DOI] [PMC free article] [PubMed] [Google Scholar]
- 6.Arpaia E, Shahar M, Dadi H, Cohen A & Roifman CM Defective T cell receptor signaling and CD8+ thymic selection in humans lacking zap-70 kinase. Cell 76, 947–58 (1994). [DOI] [PubMed] [Google Scholar]
- 7.Kircher M. et al. A general framework for estimating the relative pathogenicity of human genetic variants. Nat Genet 46, 310–5 (2014). [DOI] [PMC free article] [PubMed] [Google Scholar]
- 8.Sada K, Zhang J & Siraganian RP Point mutation of a tyrosine in the linker region of Syk results in a gain of function. J Immunol 164, 338–44 (2000). [DOI] [PubMed] [Google Scholar]
- 9.Pine PR et al. Inflammation and bone erosion are suppressed in models of rheumatoid arthritis following treatment with a novel Syk inhibitor. Clin Immunol 124, 244–57 (2007). [DOI] [PubMed] [Google Scholar]
- 10.Villasenor AG et al. Structural insights for design of potent spleen tyrosine kinase inhibitors from crystallographic analysis of three inhibitor complexes. Chem Biol Drug Des 73, 466–70 (2009). [DOI] [PubMed] [Google Scholar]
- 11.Gradler U. et al. Structural and biophysical characterization of the Syk activation switch. J Mol Biol 425, 309–33 (2013). [DOI] [PubMed] [Google Scholar]
- 12.Gaffen SL, Jain R, Garg AV & Cua DJ The IL-23-IL-17 immune axis: from mechanisms to therapeutic testing. Nat Rev Immunol 14, 585–600 (2014). [DOI] [PMC free article] [PubMed] [Google Scholar]
- 13.Korn T, Bettelli E, Oukka M & Kuchroo VK IL-17 and Th17 Cells. Annu Rev Immunol 27, 485–517 (2009). [DOI] [PubMed] [Google Scholar]
- 14.Taams LS, Steel KJA, Srenathan U, Burns LA & Kirkham BW IL-17 in the immunopathogenesis of spondyloarthritis. Nat Rev Rheumatol 14, 453–466 (2018). [DOI] [PubMed] [Google Scholar]
- 15.Shao Y. et al. CRISPR/Cas-mediated genome editing in the rat via direct injection of one-cell embryos. Nat Protoc 9, 2493–512 (2014). [DOI] [PubMed] [Google Scholar]
- 16.Keller B. et al. High SYK Expression Drives Constitutive Activation of CD21(low) B Cells. J Immunol 198, 4285–4292 (2017). [DOI] [PubMed] [Google Scholar]
- 17.Csete D. et al. Hematopoietic or Osteoclast-Specific Deletion of Syk Leads to Increased Bone Mass in Experimental Mice. Front Immunol 10, 937 (2019). [DOI] [PMC free article] [PubMed] [Google Scholar]
- 18.Yang G, Chen X, Yan Z, Zhu Q & Yang C. CD11b promotes the differentiation of osteoclasts induced by RANKL through the spleen tyrosine kinase signalling pathway. J Cell Mol Med 21, 3445–3452 (2017). [DOI] [PMC free article] [PubMed] [Google Scholar]
- 19.Can G. et al. The Syk Inhibitor Fostamatinib Decreases the Severity of Colonic Mucosal Damage in a Rodent Model of Colitis. J Crohns Colitis 9, 907–17 (2015). [DOI] [PubMed] [Google Scholar]
- 20.Hang L. et al. Downregulation of the Syk Signaling Pathway in Intestinal Dendritic Cells Is Sufficient To Induce Dendritic Cells That Inhibit Colitis. J Immunol 197, 2948–57 (2016). [DOI] [PMC free article] [PubMed] [Google Scholar]
- 21.Hug E, Hobeika E, Reth M & Jumaa H. Inducible expression of hyperactive Syk in B cells activates Blimp-1-dependent terminal differentiation. Oncogene 33, 3730–41 (2014). [DOI] [PubMed] [Google Scholar]
- 22.Young RM et al. Mouse models of non-Hodgkin lymphoma reveal Syk as an important therapeutic target. Blood 113, 2508–16 (2009). [DOI] [PMC free article] [PubMed] [Google Scholar]
- 23.Schmitz R. et al. Genetics and Pathogenesis of Diffuse Large B-Cell Lymphoma. N Engl J Med 378, 1396–1407 (2018). [DOI] [PMC free article] [PubMed] [Google Scholar]
- 24.Munshi M. et al. SYK is activated by mutated MYD88 and drives pro-survival signaling in MYD88 driven B-cell lymphomas. Blood Cancer J 10, 12 (2020). [DOI] [PMC free article] [PubMed] [Google Scholar]
- 25.Davis RE et al. Chronic active B-cell-receptor signalling in diffuse large B-cell lymphoma. Nature 463, 88–92 (2010). [DOI] [PMC free article] [PubMed] [Google Scholar]
- 26.Tate JG et al. COSMIC: the Catalogue Of Somatic Mutations In Cancer. Nucleic Acids Res 47, D941–D947 (2019). [DOI] [PMC free article] [PubMed] [Google Scholar]
- 27.Ruhe JE et al. Genetic alterations in the tyrosine kinase transcriptome of human cancer cell lines. Cancer Res 67, 11368–76 (2007). [DOI] [PubMed] [Google Scholar]
- 28.Malik A. et al. SYK-CARD9 Signaling Axis Promotes Gut Fungi-Mediated Inflammasome Activation to Restrict Colitis and Colon Cancer. Immunity 49, 515–530 e5 (2018). [DOI] [PMC free article] [PubMed] [Google Scholar]
- 29.Krisenko MO & Geahlen RL. Calling in SYK: SYK’s dual role as a tumor promoter and tumor suppressor in cancer. Biochim Biophys Acta 1853, 254–63 (2015). [DOI] [PMC free article] [PubMed] [Google Scholar]
- 30.Kunwar S, Devkota AR & Ghimire DK Fostamatinib, an oral spleen tyrosine kinase inhibitor, in the treatment of rheumatoid arthritis: a meta-analysis of randomized controlled trials. Rheumatol Int 36, 1077–87 (2016). [DOI] [PubMed] [Google Scholar]
- 31.Genovese MC et al. An oral Syk kinase inhibitor in the treatment of rheumatoid arthritis: a three-month randomized, placebo-controlled, phase II study in patients with active rheumatoid arthritis that did not respond to biologic agents. Arthritis Rheum 63, 337–45 (2011). [DOI] [PubMed] [Google Scholar]
- 32.Deng GM, Kyttaris VC & Tsokos GC Targeting Syk in Autoimmune Rheumatic Diseases. Front Immunol 7, 78 (2016). [DOI] [PMC free article] [PubMed] [Google Scholar]
- 33.Rolf MG et al. In vitro pharmacological profiling of R406 identifies molecular targets underlying the clinical effects of fostamatinib. Pharmacol Res Perspect 3, e00175 (2015). [DOI] [PMC free article] [PubMed] [Google Scholar]
- 34.Leshchiner ES et al. Small-molecule inhibitors directly target CARD9 and mimic its protective variant in inflammatory bowel disease. Proc Natl Acad Sci U S A 114, 11392–11397 (2017). [DOI] [PMC free article] [PubMed] [Google Scholar]
- 35.Cao Z. et al. Ubiquitin Ligase TRIM62 Regulates CARD9-Mediated Anti-fungal Immunity and Intestinal Inflammation. Immunity 43, 715–26 (2015). [DOI] [PMC free article] [PubMed] [Google Scholar]
- 36.Zong XN & Li H. Construction of a new growth references for China based on urban Chinese children: comparison with the WHO growth standards. PLoS One 8, e59569 (2013). [DOI] [PMC free article] [PubMed] [Google Scholar]
- 37.Salzer E. et al. RASGRP1 deficiency causes immunodeficiency with impaired cytoskeletal dynamics. Nat Immunol 17, 1352–1360 (2016). [DOI] [PMC free article] [PubMed] [Google Scholar]
- 38.Ozen A. et al. CD55 Deficiency, Early-Onset Protein-Losing Enteropathy, and Thrombosis. N Engl J Med 377, 52–61 (2017). [DOI] [PMC free article] [PubMed] [Google Scholar]
- 39.McLaren W. et al. The Ensembl Variant Effect Predictor. Genome Biol 17, 122 (2016). [DOI] [PMC free article] [PubMed] [Google Scholar]
- 40.Castel SE, Levy-Moonshine A, Mohammadi P, Banks E & Lappalainen T. Tools and best practices for data processing in allelic expression analysis. Genome Biol 16, 195 (2015). [DOI] [PMC free article] [PubMed] [Google Scholar]
- 41.Genomes Project, C. et al. A global reference for human genetic variation. Nature 526, 68–74 (2015). [DOI] [PMC free article] [PubMed] [Google Scholar]
- 42.Pan J, Thoeni C, Muise A, Yeger H & Cutz E. Multilabel immunofluorescence and antigen reprobing on formalin-fixed paraffin-embedded sections: novel applications for precision pathology diagnosis. Mod Pathol 29, 557–69 (2016). [DOI] [PubMed] [Google Scholar]
- 43.Landau M. et al. ConSurf 2005: the projection of evolutionary conservation scores of residues on protein structures. Nucleic Acids Res 33, W299–302 (2005). [DOI] [PMC free article] [PubMed] [Google Scholar]
- 44.Glaser F. et al. ConSurf: identification of functional regions in proteins by surface-mapping of phylogenetic information. Bioinformatics 19, 163–4 (2003). [DOI] [PubMed] [Google Scholar]
- 45.van Maanen MA et al. Stimulation of nicotinic acetylcholine receptors attenuates collagen-induced arthritis in mice. Arthritis Rheum 60, 114–22 (2009). [DOI] [PubMed] [Google Scholar]
- 46.Lutz MB et al. An advanced culture method for generating large quantities of highly pure dendritic cells from mouse bone marrow. J Immunol Methods 223, 77–92 (1999). [DOI] [PubMed] [Google Scholar]
- 47.Coria LM et al. A Brucella spp. Protease Inhibitor Limits Antigen Lysosomal Proteolysis, Increases Cross-Presentation, and Enhances CD8+ T Cell Responses. J Immunol 196, 4014–29 (2016). [DOI] [PubMed] [Google Scholar]
- 48.Wan Y, Chong LW & Evans RM PPAR-gamma regulates osteoclastogenesis in mice. Nat Med 13, 1496–503 (2007). [DOI] [PubMed] [Google Scholar]
- 49.Kawano H. et al. Suppressive function of androgen receptor in bone resorption. Proc Natl Acad Sci U S A 100, 9416–21 (2003). [DOI] [PMC free article] [PubMed] [Google Scholar]
- 50.Schneider CA, Rasband WS & Eliceiri KW. NIH Image to ImageJ: 25 years of image analysis. Nat Methods 9, 671–5 (2012). [DOI] [PMC free article] [PubMed] [Google Scholar]
- 51.Rueden CT et al. ImageJ2: ImageJ for the next generation of scientific image data. BMC Bioinformatics 18, 529 (2017). [DOI] [PMC free article] [PubMed] [Google Scholar]
- 52.Schindelin J. et al. Fiji: an open-source platform for biological-image analysis. Nat Methods 9, 676–82 (2012). [DOI] [PMC free article] [PubMed] [Google Scholar]
Associated Data
This section collects any data citations, data availability statements, or supplementary materials included in this article.
Supplementary Materials
Data Availability Statement
The identified SYK variants are submitted to the ClinVar database (https://www.ncbi.nlm.nih.gov/clinvar/) with IDs, SCV001450452 [c.1649C>A, p.S550Y], SCV001450453 [c.1649C>T, p.S550F], SCV001450454 [c.1024C>A, p.P342T], SCV001450455 [c.1350G>A, p.M450I], and SCV001450456 [c.1057G>A, p.A353T]. The whole exome sequencing data will not be made publicly available as they contain information that could compromise research participant privacy/consent. Information on the whole-exome sequencing raw data supporting the findings of this study is available from the corresponding authors HHU, YH, KB, and AMM upon request. Publicly available datasets/databases used in this study include the Catalogue Of Somatic Mutations In Cancer (COSMIC) database (https://cancer.sanger.ac.uk/cosmic), Kinase.com (http://www.kinase.com/human/kinome/) and the RCSB Protein Databank (PDB, https://www.rcsb.org/).


