Abstract
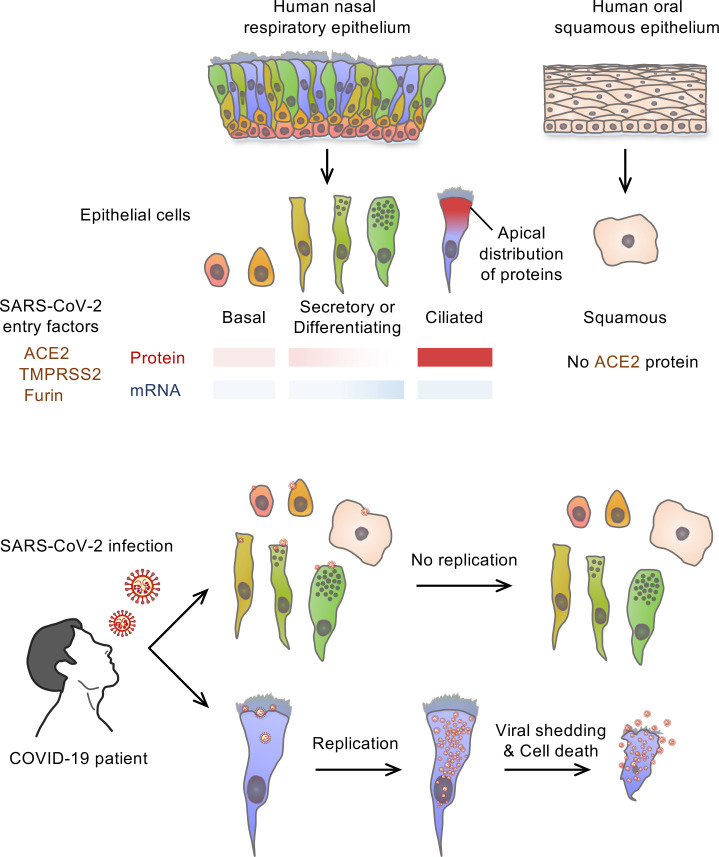
The upper respiratory tract is compromised in the early period of COVID-19, but SARS-CoV-2 tropism at the cellular level is not fully defined. Unlike recent single-cell RNA-Seq analyses indicating uniformly low mRNA expression of SARS-CoV-2 entry–related host molecules in all nasal epithelial cells, we show that the protein levels are relatively high and that their localizations are restricted to the apical side of multiciliated epithelial cells. In addition, we provide evidence in patients with COVID-19 that SARS-CoV-2 is massively detected and replicated within the multiciliated cells. We observed these findings during the early stage of COVID-19, when infected ciliated cells were rapidly replaced by differentiating precursor cells. Moreover, our analyses revealed that SARS-CoV-2 cellular tropism was restricted to the nasal ciliated versus oral squamous epithelium. These results imply that targeting ciliated cells of the nasal epithelium during the early stage of COVID-19 could be an ideal strategy to prevent SARS-CoV-2 propagation.
Keywords: COVID-19, Infectious disease
Keywords: Molecular pathology
Introduction
Accumulating evidence indicates that severe acute respiratory syndrome coronavirus 2 (SARS-CoV-2) infects not only the epithelial cells of the respiratory tract and lungs, but also epithelial and nonepithelial cells of other organs that express the angiotensin-converting enzyme 2 (ACE2) receptor (1–3). Coronavirus disease 2019 (COVID-19), caused by SARS-CoV-2 infection, has the potential to develop into life-threatening pneumonia. Most patients with COVID-19, however, have mild to moderate symptoms such as fever, cough, or olfactory and gustatory dysfunction because of the involvement of the upper respiratory tracts, including the nasal cavity (4). Nevertheless, presymptomatic or mildly symptomatic patients with COVID-19 have a high viral load of SARS-CoV-2 in samples taken by nasal swab and show high transmissibility of the virus through respiratory droplets or aerosols (4–7). These findings imply that the human upper respiratory tract and the nasal cavity in particular could be the main site for viral replication and transmission of SARS-CoV-2.
The nasal cavity is lined mostly with pseudostratified ciliated epithelium, interspersed with mucus-secreting goblet cells (8, 9). Thus, the nasal cavity epithelium is covered with a thin layer of mucus with active ciliary movement (10) that ultimately traps and removes pathogens, including SARS-CoV-2, and particulate matter from inspired air. Although this epithelium serves as a front line in respiratory defense against lower airway infection, it also could be a target tissue for infection, multiplication, and propagation of pathogens (11–13). However, the specific cells that are the real targets of SARS-CoV-2 infection and replication in patients with COVID-19 have yet to be identified.
SARS-CoV-2 entry into host cells is mediated through interaction between the virus’s spike protein and the extracellular receptor binding domain of ACE2 (14, 15). Subsequent proteolytic processing by transmembrane serine protease 2 (TMPRSS2), FURIN, and other proteases (15) triggers the fusion of viral and cellular membranes. Recent reports describe detection by single-cell RNA sequencing (scRNA-Seq) analyses of ACE2 and TMPRSS2 mRNA expression in human respiratory epithelium, including ciliated, goblet, club, alveolar type 1 (AT1), and AT2 cells. However, these expression levels not only are variable depending on cell type but also are relatively moderate or low (16–20). Thus, the specific cell types that coexpress the proteins related to SARS-CoV-2 entry into respiratory epithelium have yet to be clarified.
Although cellular tropism of SARS-CoV-2 has been described based on detection of mRNA using scRNA-Seq or in situ mapping (21, 22), transcript levels in an isolated single cell do not fully reflect the real-world expression and cellular localization of the protein of interest in a tissue (23). Likewise, in host-virus interactions, the presence of some viral mRNA in a cell does not necessarily mean viral replication. When one or multiple viruses infect a host cell and hijack its machinery for viral RNA synthesis and translation, thousands of new virions can accumulate in the cell, which ultimately bursts, scattering its contents (24). Thus, although we and others have studied SARS-CoV-2 pathogenesis using various model systems, including 2-dimensional and 3-dimensional organoid cultured bronchial or lung epithelial cells (24–28), direct and clear evidence of SARS-CoV-2 cellular tropism in the human respiratory tract is lacking.
In this study, by combining immunofluorescence staining (IFS) and scRNA-Seq, we delineated the localizations of SARS-CoV-2 entry–related host factors and their relative expression and level in the human nasal epithelium and in a nonhuman primate. In addition, in patients with COVID-19, we used the same methods to define the cellular tropism of SARS-CoV-2 in the human nasal respiratory epithelium.
Results
SARS-CoV-2–related host entry molecules are highly present on the apical side of ciliated cells, but not goblet cells, in human nasal respiratory epithelium.
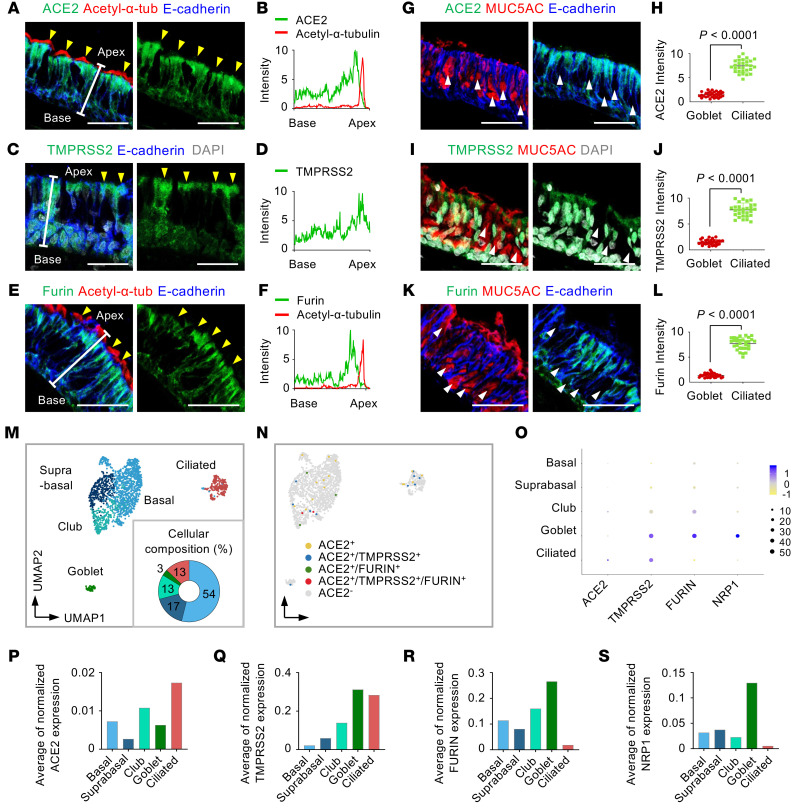
We first examined the localization and relative levels of proteins related to SARS-CoV-2 cell entry: ACE2, TMPRSS2, and FURIN. We performed IFS of tissues in the normal portions of human nasal respiratory epithelia obtained from 6 patients with pituitary adenoma during transnasal dissection surgery. Most acetylated α-tubulin+/E-cadherin+ ciliated cells had relatively high ACE2, TMPRSS2, and FURIN protein levels all over the cell surfaces (Figure 1, A–F, and Supplemental Figure 1A; supplemental material available online with this article; https://doi.org/10.1172/JCI148517DS1). Notably, the signal intensity of ACE2, TMPRSS2, and FURIN was higher at the apical versus the basal side of the epithelium, whereas it was not present at motile cilia themselves (Figure 1, A–F). Importantly, no signal was detected in the epithelium with IgG isotype control antibody (Supplemental Figure 1, B and C), which confirms specificity and confidence for all subsequent IFS data regarding presence, relative amount, and localization of ACE2. In contrast, IFS analyses of both en face and cross-sectional views of the nasal epithelium showed no evident signal of ACE2, TMPRSS2, and FURIN in MUC5AC+/E-cadherin+ goblet cells (Figure 1, G–L, and Supplemental Figure 1, D and E). ACE2 was also detected in HT2-280+/E-cadherin+ AT2 cells in lungs (Supplemental Figure 2A). In comparison, neuropilin-1 (NRP1), recently identified as a novel SARS-CoV-2 entry molecule (29), was not detected in nasal epithelium, while it was highly detected in the vascular endothelium (Supplemental Figure 2, B and C).
Figure 1. The mismatch between protein and mRNA expression pattern of SARS-CoV-2 entry molecules in human nasal mucosa epithelium.
(A–F) Representative images of cross-sectional view of human nasal epithelium showing robust ACE2, TMPRSS2, and FURIN protein in acetylated α-tubulin+ ciliated epithelium (yellow arrowheads). Scale bars: 50 μm. Similar findings were observed in n = 3 normal human tissues from 3 independent experiments. (B, D, and F) Profile analysis of relative signal intensity of ACE2, TMPRSS2, and FURIN along the white line in A, C, and E. (G, I, and K) Representative images of cross-sectional views of human nasal epithelium showing that ACE2, TMPRSS2, and FURIN were not distinctly detected in MUC5AC+ goblet cells (white arrowheads). Scale bars: 50 μm. Similar findings were observed in 3 human tissues from 3 independent experiments. (H, J, and L) Comparison of relative ACE2 signal intensity between ciliated cells and goblet cells. Each dot indicates a value measured from 1 section in 3 human tissues (n = 10 sections per tissue) from 3 independent experiments. Horizontal bars indicate the mean ± SD. P value versus ciliated cells was obtained by 2-tailed Mann-Whitney U test. (M) Unsupervised clustering of 1721 pooled human nasal epithelial cells projected on a 2D UMAP plot, and donut plot showing 5 major clusters and cellular composition of the epithelial cells. (N) UMAP plot showing distribution of ACE2+, ACE2+/TMPRSS2+, ACE2+/FURIN+, ACE2+/TMPRSS2+/FURIN+, and ACE2– cells across all clustered epithelial cells. (O) Dot plot heatmap showing expression of SARS-CoV-2 entry–related host molecule genes per each indicated cluster. (P–S) Comparison of the average of normalized expression level of each SARS-CoV-2 entry–related host molecule gene per each indicated cluster.
To confirm these human tissue findings in another primate, we used IFS to examine the localization and relative levels of ACE2 and TMPRSS2 in respiratory epithelia and lungs collected from 2 macaque monkeys during autopsy within 6 hours of death. Consistent with previous reports (30, 31), ACE2 was highly present in the epithelial cells of renal proximal tubules (Supplemental Figure 3A). ACE2 and TMPRSS2 were highly and selectively present in the acetylated-α-tubulin+/E-cadherin+ ciliated cells of the nasal mucosa, bronchus, and bronchioles but rarely or never detected in MUC5AC+ goblet cells (Supplemental Figure 3, B and C, and Supplemental Figure 4A). Furthermore, protein levels of ACE2 and TMPRSS2 were relatively low in the macaque lungs compared with the macaque ciliated epithelium of the respiratory tract (Supplemental Figure 3D and Supplemental Figure 4B). Based on these findings, ACE2hi ciliated epithelial cells in the upper respiratory tract and in particular in the nasal cavity could be the main target cells for initial SARS-CoV-2 infection.
In human nasal respiratory epithelium, mRNA levels of SARS-CoV-2 entry–related host molecules correlate poorly with their protein levels and cellular localization.
Recent studies reported the mRNA levels and distribution of SARS-CoV-2 entry–related genes in human airway epithelium by scRNA-Seq analysis and in situ mapping (16–20). However, the reported mRNA data do not definitively match our IFS finding. To further clarify this mismatch, we performed new scRNA-Seq in the normal portion of human nasal respiratory epithelium from the patients whose tissues were used for the IFS study. Unsupervised clustering and uniform manifold approximation and projection (UMAP) were performed on 1721 epithelial cells of the nasal epithelium. Five epithelial cell clusters — basal, suprabasal, club, goblet, and ciliated cells — were identified (Figure 1M) by annotation of clusters based on expression of data-driven genes and epithelial cell type–specific marker genes such as KRT15, KRT5, SERPINB4, KRT7, SCGB1A1, MUC5AC, and FOXJ1 (32–35) (Supplemental Figure 5, A–C). Only 1.8% of the total epithelial cells had a detectable level of ACE2 mRNA transcript (Figure 1N), whereas a small number of ACE2+ cells showed a detectable level of TMPRSS2 and FURIN in the nasal epithelium (Figure 1N).
We next compared the average mRNA expression levels of SARS-CoV-2 entry–related host molecules among epithelial cell clusters by pseudo-bulk analysis (36). ACE2 mRNA expression was low in all epithelial cell types (Figure 1, O and P), while TMPRSS2 mRNA expression was relatively high in ciliated and goblet cells (Figure 1, O and Q), and FURIN mRNA expression was high in secretory cells but rare in ciliated (Figure 1, O and R). NRP1 mRNA expression also was relatively low in all epithelial cells except for goblet cells (Figure 1, O and S). We further verified these expression patterns of SARS-CoV-2 entry–related host factors by analyzing a public scRNA-Seq data set of human nasal tissues. Unsupervised clustering and UMAP were performed on 3415 nasal epithelial cells. The same annotation approach identified the same 5 epithelial cell clusters (Supplemental Figure 6, A–D). Consistent with our scRNA-Seq data, only 2.7% of total epithelial cells had detectable levels of ACE2 mRNA, and its expression was relatively low in all epithelial cell types (Supplemental Figure 6, E–H). Similar patterns were identified for TMPRSS2, FURIN, and NRP1 mRNA expression in the different epithelial cells (Supplemental Figure 6, E–H). Thus, mRNA levels, as determined by scRNA-Seq, do not track with protein levels or cellular localization of the SARS-CoV-2 entry–related host molecules in human nasal respiratory epithelium.
ACE2, TMPRSS2, and FURIN proteins are highly present at the apical side of ciliated cells at the single-cell level.
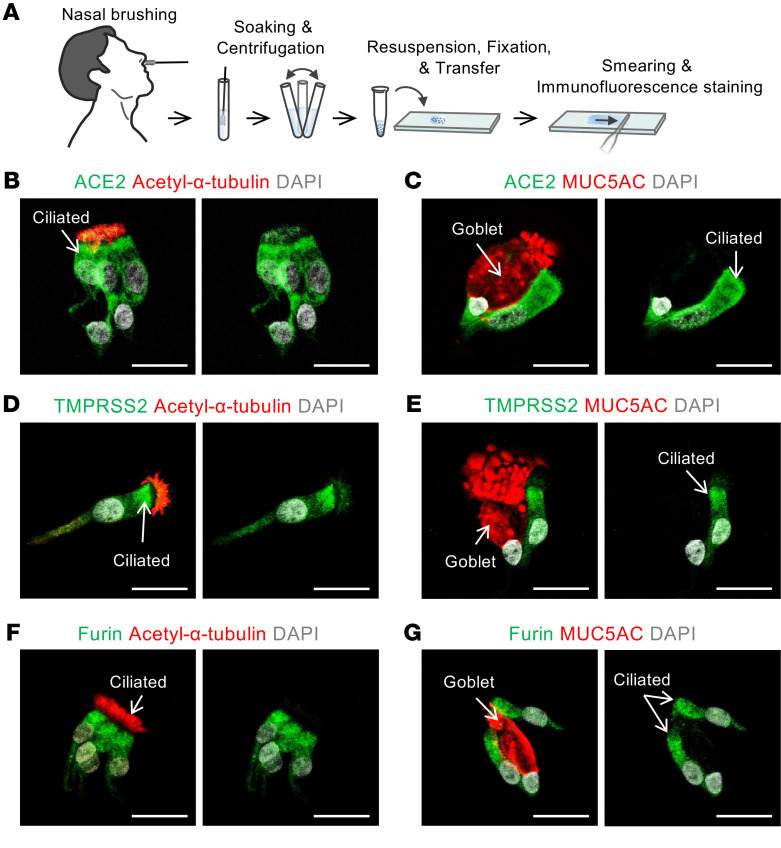
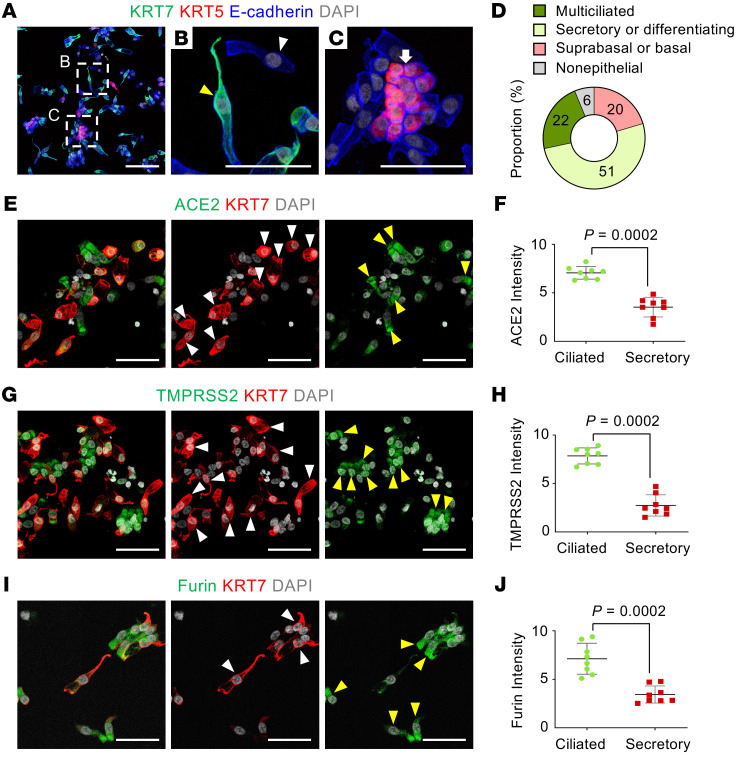
To validate the above findings, we performed cytologic analysis on smeared cells obtained by nasal brushing of nasal respiratory epithelium and pooled from 3 healthy volunteers (men, ages 25–30 years) (Figure 2A). This approach allowed us to determine levels and distributions of ACE2, TMPRSS2, and FURIN proteins at single-cell resolution. All 3 proteins were highly present at the apical side of acetylated-α-tubulin+ multiciliated epithelial cells, but they were limited or absent in MUC5AC+ goblet cells (Figure 2, B–G). To distinguish the secretory and basal cells from ciliated cells, we further stained the smeared cells for specific keratin markers, either KRT5 or KRT7 (33) (Supplemental Figure 5A). The proportion of KRT5lo/KRT7lo multiciliated cells was about 22%; that of KRT5lo/KRT7hi differentiating or secretory cells, including club and goblet cells, was about 51%; and the proportion of KRT5hi/KRT7lo suprabasal or basal cells was about 20% (Figure 3, A–D). Again, the relative levels of ACE2, TMPRSS2, and FURIN were high in KRT5lo/KRT7lo fully differentiated multiciliated cells but not in KRT7hi differentiating or secretory cells, including club and goblet cells (Figure 3, E–J). These results clearly indicate that fully differentiated multiciliated cells are a primary target of SARS-CoV-2 in the nasal respiratory epithelium.
Figure 2. Human nasal cytology reveals that SARS-CoV-2 entry molecules are located at the apical side of multiciliated cells.
(A) Schematic diagram of a series of procedures for human nasal cytology by nasal brushing and preparation of nasal cell smear onto slide. (B–G) Representative images showing that ACE2, TMPRSS2, and FURIN are abundant in the apical side of acetylated α-tubulin+ multiciliated cells, but very limited or absent in MUC5AC+ goblet cells in the smeared nasal cells. Scale bars: 25 μm. Similar findings were observed in 3 healthy volunteers from 2 independent experiments.
Figure 3. SARS-CoV-2 entry molecule proteins are highly present in fully differentiated multiciliated cells, but not in secretory or differentiating cells.
(A–C) Representative images showing subtypes of human nasal epithelial cells. White-dashed boxes in A are magnified in B and C. Scale bar in A: 100 μm. (B) Image showing KRT7hi secretory- or differentiating-type cells (yellow arrowhead) and KRT5lo/KRT7lo fully differentiated multiciliated cells (white arrowhead). Scale bar: 50 μm. (C) Image showing KRT5hi basal type cells (white arrow). Scale bar: 50 μm. (D) Donut plot showing subtype proportions in 1538 pooled smeared nasal epithelial cells of healthy volunteers (n = 3). (E–J) Representative images and comparisons of relative ACE2, TMPRSS2, and FURIN intensity in the smeared nasal cells, showing high in KRT7lo fully differentiated multiciliated cells (yellow arrowheads) but very low in KRT7hi secretory or differentiating cells (white arrowheads). Scale bars: 50 μm. (F, H, and J) Each dot indicates a value obtained from 1 smear sample in 3 volunteers (3 smeared slides per volunteer) from 2 independent experiments. Horizontal bars indicate the mean ± SD. P value versus ciliated cells was obtained by 2-tailed Mann-Whitney U test.
SARS-CoV-2 is massively replicated in a distinct subset of human nasal epithelial cells.
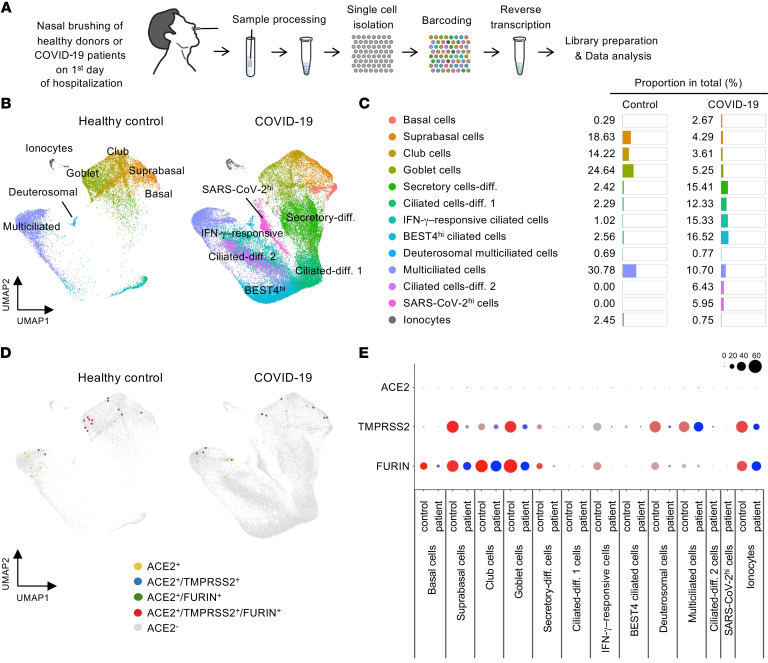
To delineate the cellular tropism of SARS-CoV-2 in the nasal epithelium, we obtained samples from 6 patients with COVID-19 by nasal cavity brushing on the first day of hospitalization (the first day for confirmation of COVID-19 by the reverse transcriptase PCR diagnostic method) (Figure 4A and Supplemental Figure 7, A and B). Then, we pooled 4 samples from patients with COVID-19 and 2 samples from healthy donors and performed scRNA-Seq on 63,593 epithelial cells after removal of nonepithelial cells, including immune cells. An unsupervised clustering distinguished 13 different epithelial cell clusters visualized with UMAP (32, 35) (Figure 4B and Supplemental Figure 8). Of the total nasal epithelial cells of healthy controls, about 60% were multiciliated and goblet cells while about 30% were suprabasal cells and club cells (Figure 4, B and C). In comparison, proportions of these cells were largely reduced, while those of differentiating secretory and ciliated precursor cells, bestrophin-4hi (BEST4hi) cells, and IFN-γ–responsive ciliated cells were substantially increased in COVID-19 patients (Figure 4, B and C). These results imply that the damaged or dead nasal epithelial cells caused by SARS-CoV-2 infection are dynamically replaced with differentiating epithelial cells derived from their stem and precursor cells during the early stage of COVID-19. Nevertheless, ACE2 mRNA+ cells were still extremely rare (Figure 4D), and expression levels were markedly low in all nasal epithelial cells from the COVID-19 patients (Figure 4E). This finding is inconsistent with a recent report showing increased ACE2 mRNA expression in epithelial cells from patients with COVID-19 (34).
Figure 4. Comparison of cellular composition and SARS-CoV-2 entry molecular gene expression in nasal epithelial cells between healthy donors and patients with COVID-19.
(A) Schematic diagram depicting a series of procedures for scRNA-Seq of nasal epithelial cells from COVID-19 patients. (B) UMAP plot comparing unsupervised clustering of nasal epithelial cell subsets between healthy controls and patients with COVID-19. (C) List and proportion plots comparing proportion of each epithelial cell subset in total clustered epithelial cells between healthy controls and COVID-19 patients. (D) Unsupervised clustering projected on a 2D UMAP plot comparing distributions of ACE2+, ACE2+/TMPRSS2+, ACE2+/FURIN+, and ACE2+/TMPRSS2+/FURIN+ cells across total pooled nasal epithelial cells between healthy controls and COVID-19 patients. (E) Dot plot heatmap comparing expressions of SARS-CoV-2 entry molecule genes per each cell cluster between healthy controls and COVID-19 patients.
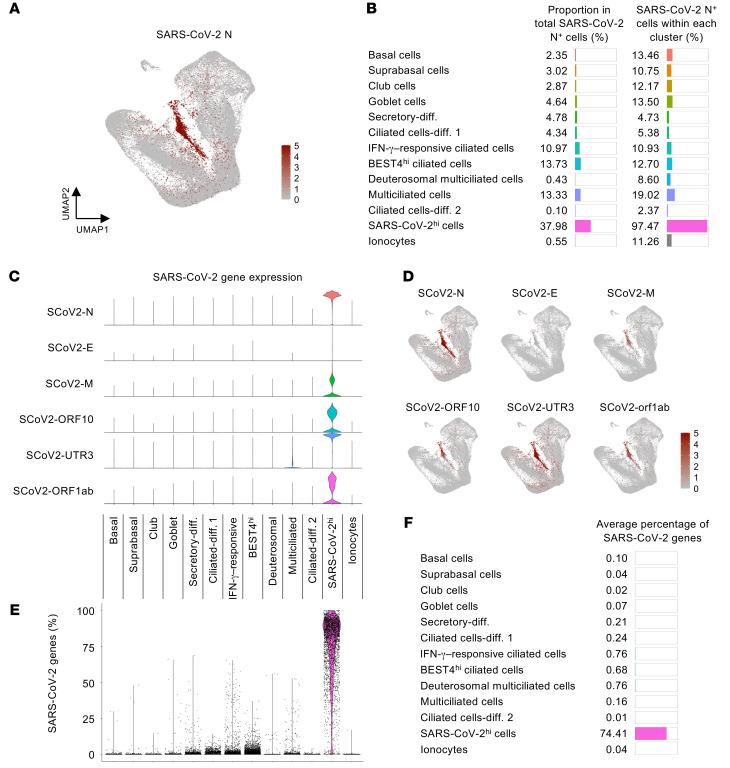
We next determined the cellular composition and transcript profiles of the SARS-CoV-2–infected cells. These cells were found in all clusters but were especially more prevalent among ciliated cells, including ciliated BEST4hi, IFN-γ–responsive, and multiciliated cells (Figure 5A). Notably, approximately 38% of the infected cells were clustered as an indefinable cell type designated as the “SARS-CoV-2hi” population, with high mRNA expression of the SARS-CoV-2 nucleocapsid, membrane, open reading frame, and untranslated region (Figure 5, A–D). We assume that these features were conferred by a marked transcriptional change in the cells after SARS-CoV-2 infection. Moreover, the aligned transcript ratio of SARS-CoV-2 to each cell notably differed: about 75% of detected genes in the SARS-CoV-2hi cells were viral genes derived from SARS-CoV-2, whereas most of the other clusters had less than 1% of the viral genes per cell (Figure 5, E and F). These findings implicate that the SARS-CoV-2hi cluster represents primary target cells where SARS-CoV-2 highly replicates.
Figure 5. scRNA-Seq identifies a distinct nasal epithelial cell subset in which SARS-CoV-2 is massively replicated in patients with COVID-19.
(A) Normalized mRNA expression level of SARS-CoV-2 nucleocapsid (N) in total clustered epithelial cells projected on UMAP plot. (B) List and proportion plots showing proportion of each epithelial cell subset in total SARS-CoV-2 N+ cells (left) and proportion of SARS-CoV-2 N+ cells within each cluster (right). (C) Violin plots depicting normalized mRNA expression levels of indicated SARS-CoV-2 genes in each cluster. (D) Normalized mRNA expression levels of indicated SARS-CoV-2 genes in total clustered epithelial cells projected on UMAP plot. (E) Comparison of proportion of SARS-CoV-2 genes among total detected genes per cell in each cluster. (F) List and proportion plots showing average percentages of SARS-CoV-2 genes in each cluster.
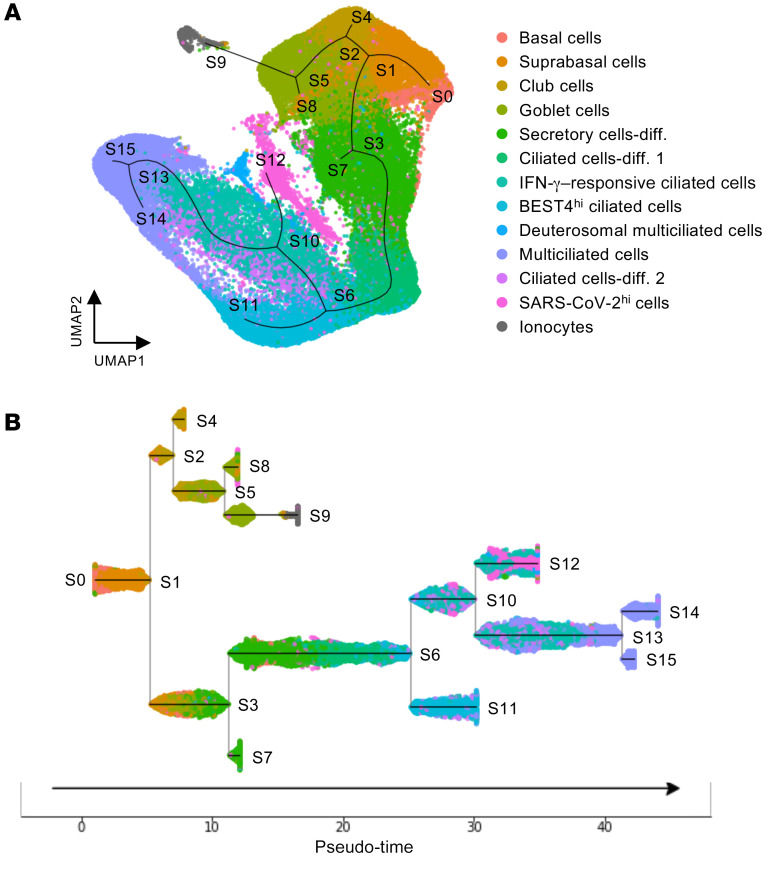
Because SARS-CoV-2hi cells produce mRNAs of SARS-CoV-2 at a high rate, it is difficult to determine the specific cell type of the SARS-CoV-2hi subset using scRNA-Seq data (Supplemental Figure 8B). Nevertheless, to define the SARS-CoV-2hi cluster, we used pseudo-time trajectory analysis (37), which allowed us to capture the continuous differentiation path from basal stem cells to fully differentiated, multiciliated cells (33, 34) (Figure 6A). Under this path, the SARS-CoV-2hi cluster positioned adjacent to other ciliated cell clusters (Figure 6A). Further, subway map plotting showed that the SARS-CoV-2hi cell cluster and IFN-γ–responsive ciliated cells were closely lined along a linear trajectory (Figure 6B), implying that SARS-CoV-2hi cells are likely ciliated cells.
Figure 6. Trajectory inference for human nasal epithelial cells in patients with COVID-19.
(A) Pseudo-time trajectory projected on UMAP plot depicting inferred differentiation pathway in total pooled nasal epithelial cells of healthy controls and COVID-19 patients. (B) Subway map plot showing pseudo-temporal ordering of total pooled nasal epithelial cells. Note that SARS-CoV-2hi cells are placed along a continuous path with IFN-γ–responsive ciliated cells.
Multiciliated cells but not secretory or basal cells of human nasal respiratory epithelium are a primary target for SARS-CoV-2 replication.
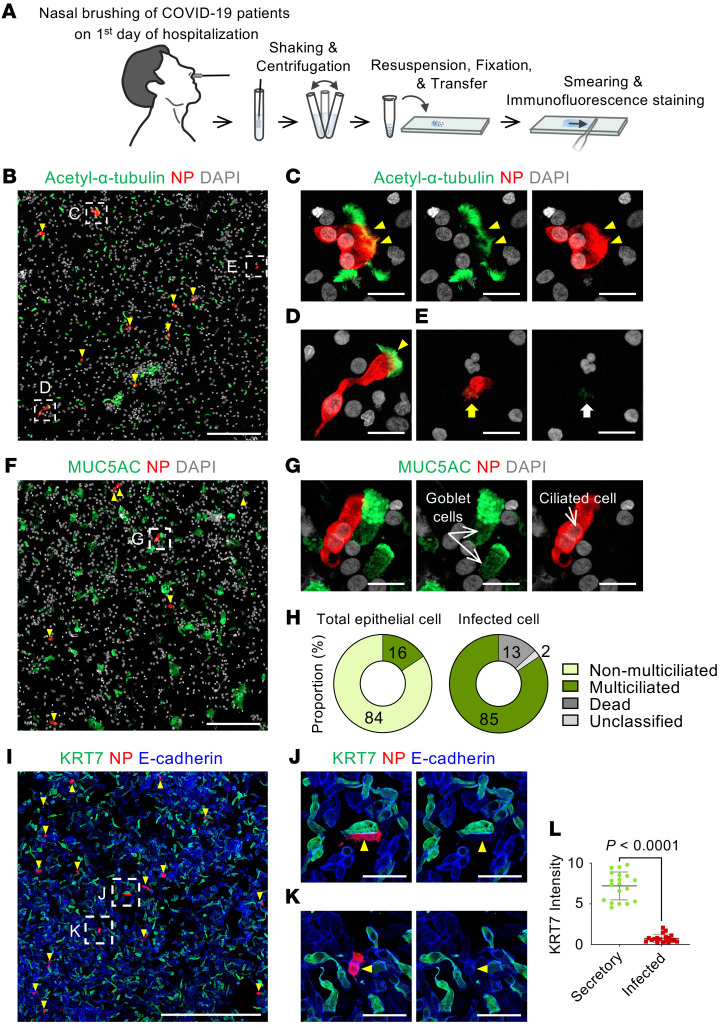
To identify the specific cell type of the SARS-CoV-2hi subset, we performed IFS on smeared epithelial cells from the nasal cavities of patients with COVID-19 (Figure 7A). In line with the pseudo-time trajectory analysis, nucleocapsid protein (NP) signal was detected exclusively in acetylated-α-tubulin+ multiciliated cells (Figure 7, B–D) and not in MUC5AC+ goblet cells (Figure 7, F and G), KRT7hi secretory or differentiating cells (Figure 7, I–L), or KRT5hi basal cells. Given that detection of NP by IFS indicates a significant level of viral replication in the infected cell (Figure 5, C and E), the NP+/acetylated-α-tubulin+ multiciliated cells are equivalent to the SARS-CoV-2hi cluster cells in Figure 5. Of the total smeared epithelial cells, only 16% were acetylated-α-tubulin+ multiciliated cells, and the rest (84%) were non-multiciliated cells. By comparison, among SARS-CoV-2 NP+–infected cells, 85% were multiciliated, 13% were dead, and 2% were unclassified (Figure 7, E and H). In contrast, NP signal was undetected in any smeared epithelial cells from the nasal cavities of healthy donors (Supplemental Figure 9). Taken together, our findings convincingly indicate that SARS-CoV-2 replicates in multiciliated epithelial cells and that its tropism matches with protein levels of virus entry–related host factors in the human nasal epithelium rather than with their mRNA levels.
Figure 7. Nucleocapsid protein of SARS-CoV-2 is detected exclusively in multiciliated epithelial cells of patients with COVID-19.
(A) Schematic diagram of a series of procedures for human nasal cytology by nasal brushing and preparation of nasal cell smear onto slide. (B–E) Representative images showing detection of SARS-CoV-2 nucleocapsid protein (NP) in acetylated-α-tubulin+ multiciliated epithelial cells (yellow arrowheads) (B–D) and SARS-CoV-2–infected dead cells (E). Box regions are magnified in right panels. Note cell shrinkage (yellow arrow) and loss of cilia and nucleus (white arrow). Scale bars: 200 μm (B); 20 μm (C–E). Similar findings were observed in n = 6 COVID-19 patients. (F and G) Representative images showing no SARS-CoV-2 NP in MUC5AC+ goblet cells. Box region is magnified and displayed as G. Scale bars: 200 μm (F); 20 μm (G). Similar findings were observed in 6 patients with COVID-19. (H) Donut plots presenting proportion of indicated cell subtypes in about 2449 pooled epithelial cells and 1606 pooled infected cells from 3 patients with COVID-19. (I–K) Representative images showing no SARS-CoV-2 NP (yellow arrowheads) in KRT7hi secretory or differentiating cells. Box regions are magnified and displayed as J and K. Scale bars: 500 μm (I); 50 μm (J and K). (L) Comparison of KRT7 intensity between secretory cells and SARS-CoV-2–infected cells. Each dot indicates a value obtained from 1 smear sample in 5 patients (4 smeared slides per patient) from 2 independent experiments. Horizontal bars indicate mean ± SD. P value versus secretory cells was obtained by 2-tailed Mann-Whitney U test.
SARS-CoV-2 highly replicates at the early stage of COVID-19 in nasal multiciliated epithelial cells but not in oral squamous epithelial cells.
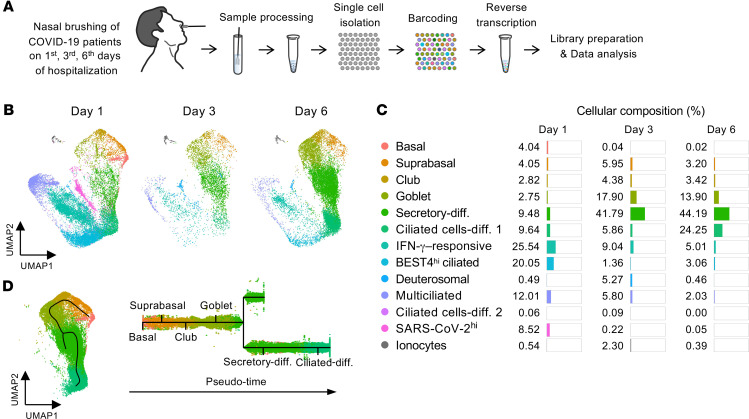
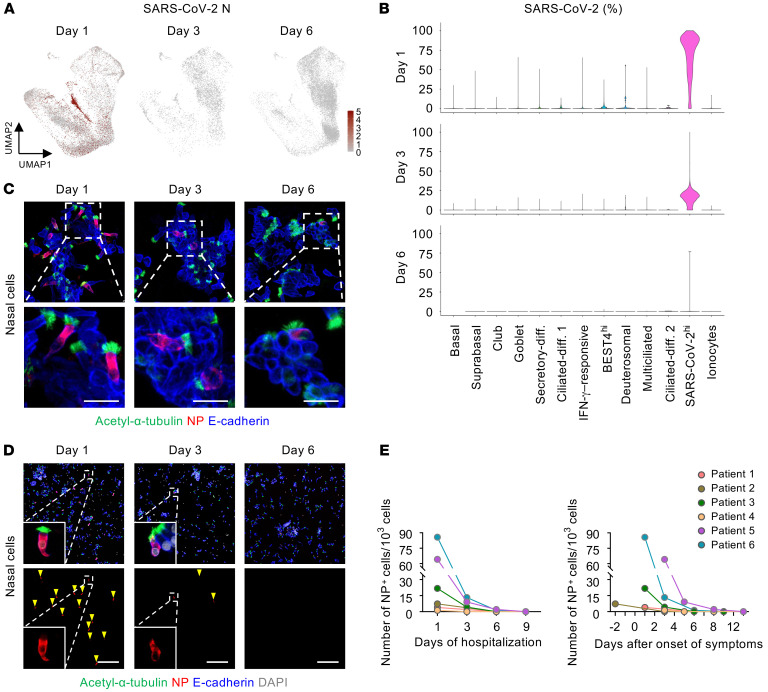
To elucidate changes in epithelial cells during the early stage of infection, we collected nasal and oral epithelial cells on days 1, 3, and 6 of hospitalization and subjected them to scRNA-Seq and cytologic analysis (Figure 8A and Supplemental Figure 7, A and B). The population of nasal ciliated cells was markedly reduced at day 3 but showed a rebound from precursor cells at day 6 (Figure 8, B and C), which implies that the damaged ciliated epithelial cells were actively replaced by their precursor cells. Accordingly, populations of differentiating secretory and ciliated cells were highly increased at days 3 and 6 (Figure 8, B and C). We further delineated a differentiation pathway from basal to ciliated cells and found that the club and goblet cells could be possible precursors of ciliated cells — which is consistent with a recent report (33) — during the early stage of COVID-19 (Figure 8D). Notably, the number of SARS-CoV-2hi cells and the percentage of SARS-CoV-2 genes in each cell were strikingly reduced at days 3 and 6 (Figure 9, A and B), representing the replication and shedding of SARS-CoV-2 occurring in the multiciliated cells of the nasal cavity during the early stage of COVID-19. These changes were consistent with cytologic analysis showing a decreased number and signal intensity of SARS-CoV-2 NP in multiciliated epithelial cells (Figure 9, C–E).
Figure 8. Nasal ciliated epithelial cells of patients with COVID-19 are rapidly replaced by precursor cells.
(A) Schematic diagram depicting a series of procedures for scRNA-Seq of nasal epithelial cells from COVID-19 patients, which were sampled on the first, third, and sixth days of hospitalization. (B and C) UMAP plots showing changes in populations of the epithelial cell clusters, and list and proportion plots showing proportion of each epithelial cell subset in total clustered epithelial cells on the indicated days of hospitalization. (D) Subway map plot presenting pseudo-time differentiation paths from basal cell cluster to differentiated ciliated cell cluster.
Figure 9. Replication and shedding of SARS-CoV-2 occur in the nasal multiciliated cells during the early stage of COVID-19.
(A) UMAP plots showing changes of normalized mRNA expression levels of SARS-CoV-2 N in total clustered epithelial cells on the indicated days of hospitalization. (B) Violin plots depicting proportion of SARS-CoV-2 genes among total detected genes per cell in each cell cluster on the indicated days of hospitalization. (C and D) Representative images showing a rapid reduction in signal intensity and number of SARS-CoV-2 NP in multiciliated cells (yellow arrowheads) during the hospitalization. Dashed box regions are magnified in lower panels or insets. Scale bars: 20 μm (C); 200 μm (D). Similar findings were observed in 6 patients with COVID-19. (E) Changes in the number of SARS-CoV-2 NP+ cells per 103 smeared cells in 6 patients with COVID-19 on the indicated days of hospitalization or after symptom onset.
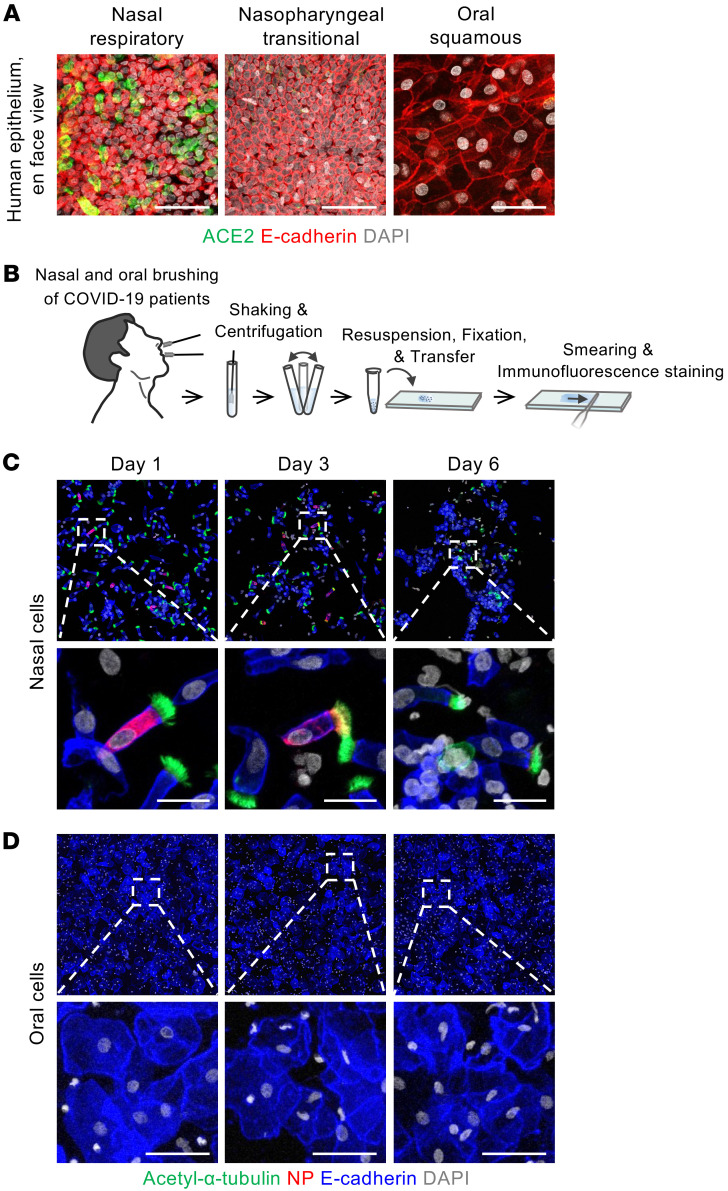
Oral cavity epithelium has been viewed as a primary infection route for SARS-CoV-2 because previous studies using scRNA-Seq and in situ hybridization showed mRNA expression of SARS-CoV-2 entry–related factors in the oral mucosa (21, 22, 31). For this reason, we assessed ACE2 protein levels and SARS-CoV-2 infectivity in human oral cavity epithelium. An en face view of IFS analysis revealed no distinct ACE2 protein signal in the squamous epithelium of the oral cavity or the transitional epithelium of the nasopharynx. In contrast, ACE2 protein was clearly detected in the respiratory ciliated epithelium of the nasal cavity (Figure 10A). Moreover, no SARS-CoV-2 NP was detected in the smeared squamous epithelial cells of oral cavity samples from patients with COVID-19 at days 1, 3, and 6 of hospitalization, whereas SARS-CoV-2 NP was detected in the smeared multiciliated epithelial cells of the nasal cavity (Figure 10, B–D). Thus, epithelial cells covering the oral cavity contained no detectable ACE2 protein and showed no signs of definitive SARS-CoV-2 infection and replication.
Figure 10. SARS-CoV-2 is not replicated in oral squamous epithelial cells.
(A) Representative images of en face view of ACE2 protein signal in human nasal respiratory, nasopharynx transitional, and oral squamous epithelia. Scale bars: 50 μm. Similar findings were observed in 2 normal tissues from 2 independent experiments. (B) Schematic diagram depicting a series of procedures of brushing cytology for nasal and oral epithelial cells of COVID-19 patients (n = 6) sampled on the first, third, and sixth days of hospitalization. (C and D) Representative images showing that SARS-CoV-2 NP is detected in nasal multiciliated epithelial cells but not in oral squamous epithelial cells on the indicated days of hospitalization. Box regions are magnified in lower panels. Scale bars: 20 μm (C); 50 μm (D). Similar findings were observed in 6 patients with COVID-19.
Discussion
The epithelium in the upper respiratory tract is a frontline barrier in the battle against SARS-CoV-2, which is transmitted through respiratory aerosols or droplets. Our findings clearly indicate that among the variety of cells composing the upper respiratory epithelia, differentiated multiciliated cells of the nasal respiratory epithelium are the primary targets for SARS-CoV-2 infection and multiplication. SARS-CoV-2–containing respiratory aerosols or droplets from patients with COVID-19 could initially be trapped in the mucus of the nasal cavity. The receptor binding domain of SARS-CoV-2 would be exposed and bound to ACE2, which is highly abundant in the apical surface membrane in fully differentiated ciliated cells of the nasal cavity.
Previous results with scRNA-Seq and in situ mapping have suggested a broad range of expression of SARS-CoV-2 entry–related host molecules and cellular tropism of SARS-CoV-2 in the respiratory tract and lung. For instance, ACE2 mRNA expression, as determined by RNA in situ mapping, was reported to be relatively higher in nasal ciliated cells, with lesser expression in bronchial ciliated and AT2 cells (21); however, the overall signal of ACE2 mRNA and the number of ACE2 mRNA+ cells were low. Moreover, Hikmet et al. (38), using immunohistochemistry, showed differential ACE2 protein distribution in various human tissues from the Uppsala Biobank, but its localization was not distinguishable at the single-cell level. Lee et al. (39) also showed ACE2 protein localization to the motile cilia of human respiratory epithelium, but they used deparaffinized tissues, which may yield poor localization quality. Inconsistent with those findings, our IFS results with fresh human and nonhuman primate tissues indicated relatively specific expression of SARS-CoV-2 entry–related host molecules at the apical side of fully differentiated multiciliated cells of the nasal respiratory epithelium.
Our scRNA-Seq and IFS analyses showed a high accumulation of SARS-CoV-2 mRNA and proteins in nasal multiciliated epithelial cells from patients with COVID-19, in line with the protein but not mRNA expression pattern of SARS-CoV-2 entry–related host proteins. These discrepancies may trace to several factors, alone or in combination. One possible factor is uncoupling of mRNA and protein levels because the translation rate for high-abundance proteins often involves the least turnover (23, 40). In addition, secretory cells, including goblet cells, may have maximal machinery for translating and producing their own secretory molecules, such as mucins, but devote minimal machinery to generating SARS-CoV-2 entry–related host molecules. Another possible factor is enzymes secreted by the secretory cells that degrade SARS-CoV-2 entry–related host proteins. Regardless, all 3 main entry-related host proteins — ACE2, TMPRSS2, and FURIN — were highly colocalized in the apical side of nasal ciliated epithelial cells, where they could provide a platform for SARS-CoV-2 entry.
Our follow-up analysis revealed that the SARS-CoV-2 load rapidly declined in patients with COVID-19 after day 3 of hospitalization, which is consistent with a previous report (6). These results imply that replication and shedding of SARS-CoV-2 occur in the nasal ciliated epithelial cells at the early stage of infection, possibly before symptom onset, and then markedly decrease over time. In fact, Wolfel et al. (41) reported that live SARS-CoV-2 was not isolated in nasal cavity samples taken 8 days after symptom onset from patients with COVID-19, although its RNA was highly detected. These findings signify that the presymptomatic or early stage is a key time point to prevent further SARS-CoV-2 spread and thereby limit the severity of the COVID-19 pandemic (7).
The upper respiratory epithelium is constantly replaced by basal stem cells (9, 10). During this process, basal cells usually differentiate first into intermediate secretory cells or other differentiating intermediates (33, 42, 43). A recent report indicated that the basal cells of the tracheal epithelium of patients with COVID-19 are not so severely damaged by SARS-CoV-2 infection but rather are highly proliferative, whereas ciliated cells are severely damaged (44). Likewise, our follow-up analysis of the nasal epithelial cells of COVID-19 patients implies that the SARS-CoV-2–infected ciliated cells could rapidly be replaced by differentiating cells derived from basal stem cells within several days. Moreover, our pseudo-time trajectory analysis revealed that the club and goblet cells could be major precursors of differentiated multiciliated cells, which is in line with the recent report (33).
The oral cavity has been proposed as one of the primary infection routes of SARS-CoV-2 since saliva is known to contain SARS-CoV-2 mRNA (22, 45). Moreover, the previous scRNA-Seq studies showed the existence of SARS-CoV-2 entry molecules in the oral cavity (22, 31, 46). However, we found that the oral squamous epithelium, covering the whole surface of the oral cavity, had no detectable ACE2 protein and no sign of definitive SARS-CoV-2 replication in the patients with COVID-19, implying that the epithelial cells of the oral cavity are not primary target cells for SARS-CoV-2 infection and transmission. It also suggests that the reason why SARS-CoV-2 mRNA is detected in the saliva is most likely that mucus fluid secreted from nasal epithelium drains down into the back of the throat and mixes with saliva.
A limitation of our study is that we were not able to obtain glandular epithelial cells in the nasal and oral cavity of patients with COVID-19, owing to their deep location in submucosal layer. In addition, as this study covered only patients who had mild symptoms of COVID-19 without intubation, we could not obtain bronchoalveolar lavage samples from them. Thus, we could not follow the lower airway infection in this study. SARS-CoV-2 is known to migrate from the infected epithelial cells of the upper airway to those of the lungs during the infection (47), but the migration pathway needs to be defined in the future.
Taken together, these results demonstrate that nasal multiciliated epithelial cells are the main target for SARS-CoV-2 infection and replication in the upper airway during the early stages of COVID-19. They imply that targeting nasal ciliated cells could be an ideal strategy to prevent SARS-CoV-2 propagation. Recently, several small molecules were developed as anti–SARS-CoV-2 viral agents (48, 49). One would envision targeting the nasal ciliated epithelial cells by the establishment of effective and specific intracellular delivery of these agents through a nasal spray or nebulization (10, 50).
Methods
Human and nonhuman primate tissues.
Dissected tissues of the nasal cavity were collected from 6 patients undergoing endonasal trans-sphenoidal resection of pituitary neoplasms at Samsung Medical Center. Dissected tissues of lungs were collected from 3 patients undergoing lobectomy due to lung adenocarcinoma at Seoul National University Hospital. Swabbed tissues of the nasal cavity were collected from 5 healthy adult volunteers at KAIST (Daejeon, Korea) and 6 patients with COVID-19 at Jeonbuk National University Hospital (JNUH). All COVID-19 patients were hospitalized within 4 days after onset of symptoms, such as fever, myalgia, headache, sore throat, rhinorrhea, or cough. COVID-19 was confirmed by a standard real-time reverse transcriptase PCR analysis of SARS-CoV-2 on the nasal cavity swab samples. Dissected tissues of nasal cavity, bronchus, lung, and kidney were collected from 2 macaque monkeys during autopsy with unknown reason of death at the National Primate Research Center (Ochang, Korea). All tissues except those from JNUH were transferred to IBS and KAIST laboratories and further dissected to obtain tissues and cells of normal regions. Uses of and experimental procedures with the tissues followed the bioethics and safety regulations of each institution, with written informed consent from the donors.
Preparations of dissected tissues and brush-swabbed tissues for immunostaining.
The resected tissues were fixed in 1% paraformaldehyde (PFA) at 4°C for overnight and washed with PBS. The fixed tissues were embedded in optimal cutting temperature medium (Leica) at room temperature and then frozen at –20°C. Ten-micrometer-thick frozen tissue sections were prepared by Cryocut Microtome (Leica). Brush-swabbed tissue of nasal and oral cavities was soaked in 5 mL of HypoThermosol FRS (STEMCELL Technologies) and shaken vigorously for 30 seconds. Cells dissociated from the brush were centrifuged at 150g for 5 minutes, and fixed with 4% PFA for 1 hour at room temperature. Then, the cells were washed and diluted with PBS, and spread on a gelatin-coated slide. The slide was air-dried and stored at 4°C.
Immunofluorescence staining.
The smeared cells and sectioned tissues on the slides were washed twice with PBS, permeabilized with 0.3% Triton X-100 in PBS, and blocked in 5% serum for 30 minutes. Primary antibodies were incubated overnight at 4°C, washed in 0.3% Triton X-100 in PBS, incubated with appropriate secondary antibodies diluted in blocking buffer for 2 hours at room temperature, and washed in PBS; all the steps were performed in a shaker. The samples were then mounted with fluorescent mounting medium (DAKO). The following primary and secondary antibodies were used in the immunostaining: anti-ACE2 (rabbit polyclonal, ab15348, Abcam), anti–acetylated-α-tubulin (mouse monoclonal, 66200-1-Ig, Proteintech), anti–E-cadherin (goat polyclonal, AF748, R&D Systems Inc.), anti-MUC5AC (mouse monoclonal, 45M1, Invitrogen), anti-TMPRSS2 (rabbit monoclonal, EPR3861, Abcam), anti-TMPRSS2 (mouse monoclonal, sc-515727, Santa Cruz Biotechnology Inc.), anti-FURIN (rabbit polyclonal, ab3467, Abcam), anti–neuropilin-1 (rabbit polyclonal, ab81321, Abcam), anti–nucleocapsid protein of SARS-CoV-2 (rabbit polyclonal, 40143-T62, Sino Biological), anti-KRT5 (rabbit polyclonal, Poly19055, BioLegend), anti-KRT7 (mouse monoclonal, OV-TL 12/30, Dako), and anti–HT2-280 (mouse monoclonal, TB-27AHT2-280, Terrace Biotech); and Alexa Fluor 488–, 594–, and 647–conjugated secondary antibodies were purchased from Jackson ImmunoResearch Laboratories Inc. Nuclei were stained with DAPI (Invitrogen). All the antibodies used in this study were validated for the species and applications by the indicated manufacturers.
Imaging and morphometric analyses.
Immunofluorescence images were acquired using a Zeiss LSM 800 confocal microscope (Carl Zeiss). ZEN 2.3 software (Carl Zeiss) was used for acquisition and processing of images. Confocal images of whole-mount and section samples are maximum-intensity projections of tiled Z-stack images, which were all taken at a resolution of 512 × 512 pixels with the following objectives: air objectives, Plan-Apochromat 20×/0.8 NA M27; water objectives, C-Apochromat 40×/1.20 NA water immersion Corr (LSM 800) with multichannel scanning in frame. The signal intensity of base-to-apex side was measured using Profile analysis of ZEN 2.3 software. For the quantitative analysis of signal intensity, the mean intensity within the region of interest was measured using Draw Contour of ZEN 2.3 software in orthogonal projection images. Mean fluorescence intensity was calculated by subtraction of mean background intensity. Relative expression was normalized with the signal intensity of control image. The number of epithelial cells and SARS-CoV-2–infected (NP+) cells was counted manually for each smeared sample. Basal cells were defined as E-cadherin+ epithelial cells with KRT5 signal, while secretory cells or differentiating cells were defined as E-cadherin+, KRT7hi epithelial cells without KRT5 signal. Ciliated cells were defined as E-cadherin+, KRT7lo columnar epithelial cells without KRT5 signal, or acetylated-α-tubulin+ epithelial cells.
Generation of single-cell RNA library.
For generation of single-cell RNA library on normal human nasal epithelium, the harvested tissues were minced with scissors and dissociated with ice-cold HBSS with 0.1% protease XIV from Streptomyces griseus (Sigma-Aldrich) as previously described (33). Dissociated single-cell suspensions were processed with 10x Chromium Single Cell 3′ Reagent Kit v3 (10x Genomics) following the manufacturer’s protocols. Cells were partitioned into gel beads in emulsion by oil droplets with reverse transcription enzymes. Then, mRNA transcripts were barcoded, reverse-transcribed, and amplified. Amplified cDNA molecules were then enzymatically fragmented, and end repair and A-tailing were performed. The resulting products were double-sided size selection with SPRI beads (Beckman Coulter). Then, adaptor and sample-index ligations were performed. Final products were selected by size using SPRI beads, and 1:10 dilutes were read by Agilent Bioanalyzer High Sensitivity Chip for quality control. Lastly, generated single-cell libraries were sequenced by Illumina HiSeq-X platform.
For single-cell RNA library on nasal epithelial cells of patients with COVID-19, nasal brushing was performed with a 2 mm cytology brush (Medi-Globe). The brush was soaked in a 15 mL centrifuge tube containing 5 mL of dissociation buffer and HypoThermosol (BioLife Solutions) containing 10 mg/mL protease from Bacillus licheniformis (P5380, Sigma-Aldrich) and 0.5 mM EDTA. The tube was shaken vigorously and centrifuged for 5 minutes at 150g. The cells were dispersed by pipetting, incubated on ice for 30 minutes, and then collected by centrifugation. After lysis of red blood cells with ammonium-chloride-potassium (ACK) buffer, the cells were resuspended and passed through a 40 μm cell strainer, and then the cell count and viability were assessed with a Countess automated cell counter (Thermo Fisher Scientific). Single cells were isolated using Single-Cell Capture and cDNA Synthesis with the BD Rhapsody Express Single-Cell Analysis System according to the manufacturer’s instructions (BD Biosciences). cDNA libraries were prepared using the BD Rhapsody Whole Transcriptome Analysis Amplification Kit (BD Biosciences). The final libraries were quantified using a Qubit Fluorometer with the Qubit dsDNA HS Kit (Thermo Fisher Scientific), and the size distribution was measured using the Agilent high-sensitivity DNA chip assay on a Bioanalyzer 2100 system (Agilent Technologies). Lastly, generated single-cell libraries were sequenced by Illumina HiSeq-X platform.
Preprocessing and clustering analysis for scRNA-Seq data.
Raw sequenced data from normal human nasal epithelium were first demultiplexed and aligned to human reference genome GRCh38-3.0.0 by Cell Ranger 3.0.2 (10x Genomics). Aligned data were processed by the Read10X function in the R package Seurat (version 3.1.1) to build a raw expression matrix. From the matrix, genes expressed in fewer than 3 cells were removed. In addition, low-quality cells expressing fewer than 500 genes and cells with a high percentage of mitochondrial genes (>10% of total unique molecular identifier [UMI] counts) were considered as dead cells and therefore discarded. Then, counts for each gene for a cell were divided by the total expression of the cell, multiplied by 10,000, and log-transformed. From the normalized expression matrix, the top 2000 most variable genes were selected by the FindVariableFeatures function in Seurat with the option selection.method = “vst”. Then, genes were centered to have mean of 0 and scaled by the standard deviation. Principal component analysis (PCA) was performed, and 15 principal components, determined by manual inspection of elbow plot, were used for further analysis. For visualization in 2-dimensional plots, UMAP was used. A shared-nearest-neighbor graph was built by the FindNeighbors function in Seurat, and cluster identifications were performed by application of the Louvain algorithm using the FindClusters function in Seurat. Differentially expressed genes were identified using the FindMarkers function in Seurat with options: test.use = “MAST”, min.pct = 0.5, min.diff.pct = 0.3, only.pos = T. Cell type annotations were performed by manual inspection of marker genes for each cluster.
The mRNA transcripts of nasal epithelial cells of COVID-19 patients were aligned to a customized reference genome in which the SARS-CoV-2 genome (NC_045512.2) was added as an additional chromosome to the human reference genome GRCh38.p13 (GCA_000001405.28). For UMI-based BD Rhapsody samples, 5 preprocessing pipelines — FastQC (v.0.11.8), UMI-tools extract (v.1.1.1), STAR (v.2.7.6a), featureCounts (Subread v.2.0.1), and UMI-tools count (v.0.5.5) — were used independently to process the raw FastQ data and generate gene count matrices. The preprocessed count matrix of COVID-19 patients’ nasal brushing was read into R version 4.0.3 with Seurat version 3.2.3. After quality control filtering (clusters with fewer than 3 cells and cells expressing fewer than 200 genes or more than 4000 genes were discarded), the samples were normalized to 10,000 reads, scaled, and centered. For integration, 4000 shared highly variable genes were identified using Seurat’s SelectIntegrationFeatures() function of reciprocal PCA. Integration anchors were identified based on these genes using the FindIntegrationAnchors() function. The data were then scaled again using ScaleData() with the vars.to.regress option for SARS-CoV-2 genes. A nearest-neighbor graph using the PCA reduction was calculated using FindNeighbors(), followed by clustering using FindClusters() with options: min.pct = 0.25, min.diff.pct = 0.25, only.pos = True. After scaling and dimensional reduction by PCA, the UMAP was calculated for only the non–blood cell subset (PTPRC–, CD14– cells). To infer the lineage relationships between the different epithelial cell types identified, STREAM was used (https://github.com/pinellolab/STREAM) (51). The trajectory inference of epithelial cells was generated from Seurat output, which was displayed along the pseudo-time distance plot.
Data and code availability.
scRNA-Seq data are available in the NCBI’s Gene Expression Omnibus database under accession numbers GSE155113 (human nasal mucosa), GSE171488 (healthy donor nasal brushing), and GSE164547 (COVID-19 patient nasal brushing). Raw expression matrix and metadata information of the public human airway single-cell data set was acquired from Human Cell Atlas, submitted into the European Genome-phenome Archive under accession code EGAS00001004082. Requests for further information on data availability or for resources and reagents should be directed to co-corresponding author GYK.
Statistics.
Values are presented as mean ± SD. Statistical tests for each figure were justified to be appropriate, and significance of differences between 2 groups was determined by the 2-tailed Mann-Whitney U test. Statistical analyses were performed using GraphPad Prism 8.0 (GraphPad Software). Detailed information on the number of biological samples used can be found in the figure legends.
Study approval.
The dissected tissues of nasal cavity were collected under the approval of the IRB at Samsung Medical Center (SMC 2019-09-094-003). The dissected tissues of lungs were collected under the approval of the IRB at Seoul National University Hospital (C-1809-137-975). The research protocol with nasal brushing from healthy volunteers was approved by the IRBs at KAIST (KAIST 2020-070). The research protocol with nasal and oral brushing from patients with COVID-19 was approved by the IRBs at JNUH (JNUH 2020-02-050-015).
Author contributions
JHA designed the study, performed the experiments, interpreted the data, generated figures, and wrote the manuscript. JK and MJY performed scRNA-Seq analysis and data interpretation. SPH helped with the experiments. SYC, MKC, and SDH provided human nasal tissue samples. YSJ, YTK, and HMK provided materials and interpreted the data. MTR performed immunofluorescence staining for COVID-19 patient samples. CSL performed and supervised COVID-19 patient experiments, interpreted the data, and directed the project. HB and GYK designed the study, interpreted the data, wrote the manuscript, and directed the project.
Supplementary Material
Acknowledgments
We thank Intae Park for proofreading of the manuscript, and the National Primate Research Center (Ochang, Korea) for providing monkey autopsy specimens. This work was supported by grants from the Institute for Basic Science (IBS-R025-D1 to GYK) and the National Research Foundation of Korea (NRF-2018R1D1A1B07044974 to SYC), funded by the Ministry of Science and ICT, Korea.
Version 1. 05/18/2021
In-Press Preview
Version 2. 07/01/2021
Electronic publication
Footnotes
Conflict of interest: The authors have declared that no conflict of interest exists.
Copyright: © 2021, American Society for Clinical Investigation.
Reference information: J Clin Invest. 2021;131(13):e148517.https://doi.org/10.1172/JCI148517.
Contributor Information
Ji Hoon Ahn, Email: ahnadun@kaist.ac.kr.
JungMo Kim, Email: jmkim@ibs.re.kr.
Seon Pyo Hong, Email: sp_hong@kaist.ac.kr.
Sung Yong Choi, Email: sungyong.choi82@gmail.com.
Myung Jin Yang, Email: mjyang@kaist.ac.kr.
Young Seok Ju, Email: ysju@kaist.ac.kr.
Young Tae Kim, Email: ytkim@snu.ac.kr.
Ho Min Kim, Email: hm_kim@kaist.ac.kr.
Man Ki Chung, Email: chungmk@skku.edu.
Sang Duk Hong, Email: kkam97@gmail.com.
Hosung Bae, Email: hstbae@kaist.ac.kr.
Chang-Seop Lee, Email: lcsmd@jbnu.ac.kr.
Gou Young Koh, Email: gykoh@kaist.ac.kr.
References
- 1.Tay MZ, et al. The trinity of COVID-19: immunity, inflammation and intervention. Nat Rev Immunol. 2020;20(6):363–374. doi: 10.1038/s41577-020-0311-8. [DOI] [PMC free article] [PubMed] [Google Scholar]
- 2.Gupta A, et al. Extrapulmonary manifestations of COVID-19. Nat Med. 2020;26(7):1017–1032. doi: 10.1038/s41591-020-0968-3. [DOI] [PubMed] [Google Scholar]
- 3.Lamers MM, et al. SARS-CoV-2 productively infects human gut enterocytes. Science. 2020;369(6499):50–54. doi: 10.1126/science.abc1669. [DOI] [PMC free article] [PubMed] [Google Scholar]
- 4.Gandhi RT, et al. Mild or moderate Covid-19. N Engl J Med. 2020;383(18):1757–1766. doi: 10.1056/NEJMcp2009249. [DOI] [PubMed] [Google Scholar]
- 5.Liu Y, et al. Aerodynamic analysis of SARS-CoV-2 in two Wuhan hospitals. Nature. 2020;582(7813):557–560. doi: 10.1038/s41586-020-2271-3. [DOI] [PubMed] [Google Scholar]
- 6.He X, et al. Temporal dynamics in viral shedding and transmissibility of COVID-19. Nat Med. 2020;26(5):672–675. doi: 10.1038/s41591-020-0869-5. [DOI] [PubMed] [Google Scholar]
- 7.Rasmussen AL, Popescu SV. SARS-CoV-2 transmission without symptoms. Science. 2021;371(6535):1206–1207. doi: 10.1126/science.abf9569. [DOI] [PubMed] [Google Scholar]
- 8.Harkema JR, et al. The nose revisited: a brief review of the comparative structure, function, and toxicologic pathology of the nasal epithelium. Toxicol Pathol. 2006;34(3):252–269. doi: 10.1080/01926230600713475. [DOI] [PubMed] [Google Scholar]
- 9.Dahl R, Mygind N. Anatomy, physiology and function of the nasal cavities in health and disease. Adv Drug Deliv Rev. 1998;29(1-2):3–12. doi: 10.1016/S0169-409X(97)00058-6. [DOI] [PubMed] [Google Scholar]
- 10.Bustamante-Marin XM, Ostrowski LE. Cilia and mucociliary clearance. Cold Spring Harb Perspect Biol. 2017;9(4):a028241. doi: 10.1101/cshperspect.a028241. [DOI] [PMC free article] [PubMed] [Google Scholar]
- 11.Gengler I, et al. Sinonasal pathophysiology of SARS-CoV-2 and COVID-19: a systematic review of the current evidence. Laryngoscope Investig Otolaryngol. 2020;5(3):354–359. doi: 10.1002/lio2.384. [DOI] [PMC free article] [PubMed] [Google Scholar]
- 12.Fodoulian L, et al. SARS-CoV-2 receptors and entry genes are expressed in the human olfactory neuroepithelium and brain. iScience. 2020;23(12):101839. doi: 10.1016/j.isci.2020.101839. [DOI] [PMC free article] [PubMed] [Google Scholar]
- 13.Hewitt RJ, Lloyd CM. Regulation of immune responses by the airway epithelial cell landscape. Nat Rev Immunol. doi: 10.1038/s41577-020-00477-9. [published online January 13, 2021]. [DOI] [PMC free article] [PubMed] [Google Scholar]
- 14.Hoffmann M, et al. SARS-CoV-2 cell entry depends on ACE2 and TMPRSS2 and is blocked by a clinically proven protease inhibitor. Cell. 2020;181(2):271–280. doi: 10.1016/j.cell.2020.02.052. [DOI] [PMC free article] [PubMed] [Google Scholar]
- 15.Walls AC, et al. Structure, function, and antigenicity of the SARS-CoV-2 spike glycoprotein. Cell. 2020;181(2):281–292. doi: 10.1016/j.cell.2020.02.058. [DOI] [PMC free article] [PubMed] [Google Scholar]
- 16.Ziegler CGK, et al. SARS-CoV-2 receptor ACE2 is an interferon-stimulated gene in human airway epithelial cells and is detected in specific cell subsets across tissues. Cell. 2020;181(5):1016–1035. doi: 10.1016/j.cell.2020.04.035. [DOI] [PMC free article] [PubMed] [Google Scholar]
- 17.Sungnak W, et al. SARS-CoV-2 entry factors are highly expressed in nasal epithelial cells together with innate immune genes. Nat Med. 2020;26(5):681–687. doi: 10.1038/s41591-020-0868-6. [DOI] [PMC free article] [PubMed] [Google Scholar]
- 18.Lukassen S, et al. SARS-CoV-2 receptor ACE2 and TMPRSS2 are primarily expressed in bronchial transient secretory cells. EMBO J. 2020;39(10):e105114. doi: 10.15252/embj.20105114. [DOI] [PMC free article] [PubMed] [Google Scholar]
- 19.Aguiar JA, et al. Gene expression and in situ protein profiling of candidate SARS-CoV-2 receptors in human airway epithelial cells and lung tissue. Eur Respir J. 2020;56(3):2001123. doi: 10.1183/13993003.01123-2020. [DOI] [PMC free article] [PubMed] [Google Scholar]
- 20.Sajuthi SP, et al. Type 2 and interferon inflammation regulate SARS-CoV-2 entry factor expression in the airway epithelium. Nat Commun. 2020;11(1):5139. doi: 10.1038/s41467-020-18781-2. [DOI] [PMC free article] [PubMed] [Google Scholar]
- 21.Hou YJ, et al. SARS-CoV-2 reverse genetics reveals a variable infection gradient in the respiratory tract. Cell. 2020;182(2):429–446. doi: 10.1016/j.cell.2020.05.042. [DOI] [PMC free article] [PubMed] [Google Scholar]
- 22.Huang N, et al. SARS-CoV-2 infection of the oral cavity and saliva. Nat Med. doi: 10.1038/s41591-021-01296-8. [published online March 25, 2021]. [DOI] [PMC free article] [PubMed] [Google Scholar]
- 23.Liu Y, et al. On the dependency of cellular protein levels on mRNA abundance. Cell. 2016;165(3):535–550. doi: 10.1016/j.cell.2016.03.014. [DOI] [PubMed] [Google Scholar]
- 24.V’Kovski P, et al. Coronavirus biology and replication: implications for SARS-CoV-2. Nat Rev Microbiol. 2021;19(3):155–170. doi: 10.1038/s41579-020-00468-6. [DOI] [PMC free article] [PubMed] [Google Scholar]
- 25.Simoneau CR, Ott M. Modeling multi-organ infection by SARS-CoV-2 using stem cell technology. Cell Stem Cell. 2020;27(6):859–868. doi: 10.1016/j.stem.2020.11.012. [DOI] [PMC free article] [PubMed] [Google Scholar]
- 26.Youk J, et al. Three-dimensional human alveolar stem cell culture models reveal infection response to SARS-CoV-2. Cell Stem Cell. 2020;27(6):905–919. doi: 10.1016/j.stem.2020.10.004. [DOI] [PMC free article] [PubMed] [Google Scholar]
- 27.Katsura H, et al. Human lung stem cell-based alveolospheres provide insights into SARS-CoV-2-mediated interferon responses and pneumocyte dysfunction. Cell Stem Cell. 2020;27(6):890–904. doi: 10.1016/j.stem.2020.10.005. [DOI] [PMC free article] [PubMed] [Google Scholar]
- 28.Han Y, et al. Identification of SARS-CoV-2 inhibitors using lung and colonic organoids. Nature. 2021;589(7841):270–275. doi: 10.1038/s41586-020-2901-9. [DOI] [PMC free article] [PubMed] [Google Scholar]
- 29.Cantuti-Castelvetri L, et al. Neuropilin-1 facilitates SARS-CoV-2 cell entry and infectivity. Science. 2020;370(6518):856–860. doi: 10.1126/science.abd2985. [DOI] [PMC free article] [PubMed] [Google Scholar]
- 30.Ye M, et al. Glomerular localization and expression of angiotensin-converting enzyme 2 and angiotensin-converting enzyme: implications for albuminuria in diabetes. J Am Soc Nephrol. 2006;17(11):3067–3075. doi: 10.1681/ASN.2006050423. [DOI] [PubMed] [Google Scholar]
- 31.Xu H, et al. High expression of ACE2 receptor of 2019-nCoV on the epithelial cells of oral mucosa. Int J Oral Sci. 2020;12(1):8. doi: 10.1038/s41368-020-0074-x. [DOI] [PMC free article] [PubMed] [Google Scholar]
- 32.Deprez M, et al. A single-cell atlas of the human healthy airways. Am J Respir Crit Care Med. 2020;202(12):1636–1645. doi: 10.1164/rccm.201911-2199OC. [DOI] [PubMed] [Google Scholar]
- 33.Ruiz Garcia S, et al. Novel dynamics of human mucociliary differentiation revealed by single-cell RNA sequencing of nasal epithelial cultures. Development. 2019;146(20):dev177428. doi: 10.1242/dev.177428. [DOI] [PMC free article] [PubMed] [Google Scholar]
- 34.Chua RL, et al. COVID-19 severity correlates with airway epithelium-immune cell interactions identified by single-cell analysis. Nat Biotechnol. 2020;38(8):970–979. doi: 10.1038/s41587-020-0602-4. [DOI] [PubMed] [Google Scholar]
- 35. doi: 10.1101/2021.02.20.431155. Ziegler CGK, et al. Impaired local intrinsic immunity to SARS-CoV-2 infection in severe COVID-19 [preprint]. Posted on bioRxiv February 20, 2021. [DOI] [PMC free article] [PubMed]
- 36.Lahnemann D, et al. Eleven grand challenges in single-cell data science. Genome Biol. 2020;21(1):31. doi: 10.1186/s13059-020-1926-6. [DOI] [PMC free article] [PubMed] [Google Scholar]
- 37.Cannoodt R, et al. Computational methods for trajectory inference from single-cell transcriptomics. Eur J Immunol. 2016;46(11):2496–2506. doi: 10.1002/eji.201646347. [DOI] [PubMed] [Google Scholar]
- 38.Hikmet F, et al. The protein expression profile of ACE2 in human tissues. Mol Syst Biol. 2020;16(7):e9610. doi: 10.15252/msb.20209610. [DOI] [PMC free article] [PubMed] [Google Scholar]
- 39.Lee IT, et al. ACE2 localizes to the respiratory cilia and is not increased by ACE inhibitors or ARBs. Nat Commun. 2020;11(1):5453. doi: 10.1038/s41467-020-19145-6. [DOI] [PMC free article] [PubMed] [Google Scholar]
- 40.Claydon AJ, Beynon R. Proteome dynamics: revisiting turnover with a global perspective. Mol Cell Proteomics. 2012;11(12):1551–1565. doi: 10.1074/mcp.O112.022186. [DOI] [PMC free article] [PubMed] [Google Scholar]
- 41.Wolfel R, et al. Virological assessment of hospitalized patients with COVID-2019. Nature. 2020;581(7809):465–469. doi: 10.1038/s41586-020-2196-x. [DOI] [PubMed] [Google Scholar]
- 42.Hajj R, et al. Basal cells of the human adult airway surface epithelium retain transit-amplifying cell properties. Stem Cells. 2007;25(1):139–148. doi: 10.1634/stemcells.2006-0288. [DOI] [PubMed] [Google Scholar]
- 43.Das D, et al. Cellular mechanisms of epithelial stem cell self-renewal and differentiation during homeostasis and repair. Wiley Interdiscip Rev Dev Biol. 2020;9(1):e361. doi: 10.1002/wdev.361. [DOI] [PubMed] [Google Scholar]
- 44.Fang Y, et al. Distinct stem/progenitor cells proliferate to regenerate the trachea, intrapulmonary airways and alveoli in COVID-19 patients. Cell Res. 2020;30(8):705–707. doi: 10.1038/s41422-020-0367-9. [DOI] [PMC free article] [PubMed] [Google Scholar]
- 45.Wyllie AL, et al. Saliva or nasopharyngeal swab specimens for detection of SARS-CoV-2. N Engl J Med. 2020;383(13):1283–1286. doi: 10.1056/NEJMc2016359. [DOI] [PMC free article] [PubMed] [Google Scholar]
- 46.Sakaguchi W, et al. Existence of SARS-CoV-2 entry molecules in the oral cavity. Int J Mol Sci. 2020;21(17):6000. doi: 10.3390/ijms21176000. [DOI] [PMC free article] [PubMed] [Google Scholar]
- 47.Hu B, et al. Characteristics of SARS-CoV-2 and COVID-19. Nat Rev Microbiol. 2021;19(3):141–154. doi: 10.1038/s41579-020-00459-7. [DOI] [PMC free article] [PubMed] [Google Scholar]
- 48.Ghanbari R, et al. Existing antiviral options against SARS-CoV-2 replication in COVID-19 patients. Future Microbiol. 2020;15:1747–1758. doi: 10.2217/fmb-2020-0120. [DOI] [PMC free article] [PubMed] [Google Scholar]
- 49.Wong JP, Damania B. SARS-CoV-2 dependence on host pathways. Science. 2021;371(6532):884–885. doi: 10.1126/science.abg6837. [DOI] [PubMed] [Google Scholar]
- 50.Keller LA, et al. Intranasal drug delivery: opportunities and toxicologic challenges during drug development. Drug Deliv Transl Res. doi: 10.1007/s13346-020-00891-5. [published online January 25, 2021]. [DOI] [PMC free article] [PubMed] [Google Scholar]
- 51.Chen H, et al. Single-cell trajectories reconstruction, exploration and mapping of omics data with STREAM. Nat Commun. 2019;10(1):1903. doi: 10.1038/s41467-019-09670-4. [DOI] [PMC free article] [PubMed] [Google Scholar]
Associated Data
This section collects any data citations, data availability statements, or supplementary materials included in this article.
Supplementary Materials
Data Availability Statement
scRNA-Seq data are available in the NCBI’s Gene Expression Omnibus database under accession numbers GSE155113 (human nasal mucosa), GSE171488 (healthy donor nasal brushing), and GSE164547 (COVID-19 patient nasal brushing). Raw expression matrix and metadata information of the public human airway single-cell data set was acquired from Human Cell Atlas, submitted into the European Genome-phenome Archive under accession code EGAS00001004082. Requests for further information on data availability or for resources and reagents should be directed to co-corresponding author GYK.


