

ABSTRACT
Background
The evolution of vitamin D status across pregnancy trimesters and its association with prepregnancy body mass index (ppBMI; in kg/m2) remain unclear.
Objectives
We aimed to 1) assess trimester-specific serum total 25-hydroxyvitamin D [25(OH)D] concentrations, 2) compare those concentrations between ppBMI categories, and 3) examine associations between 25(OH)D concentrations, ppBMI, and vitamin D intake.
Methods
As part of a prospective cohort study, 79 pregnant women with a mean age of 32.1 y and ppBMI of 25.7 kg/m2 were recruited in their first trimester (average 9.3 weeks of gestation). Each trimester, vitamin D intake was assessed by 3 Web-based 24-h recalls and a Web questionnaire on supplement use. Serum total 25(OH)D was measured by LC–tandem MS. Repeated-measures ANOVA was performed to assess the evolution of 25(OH)D concentrations across trimesters of pregnancy and comparisons of 25(OH)D concentrations between ppBMI categories were assessed by 1-factor ANOVAs. Stepwise regression analyses were used to identify determinants of 25(OH)D concentrations in the third trimester.
Results
Mean ± SD serum total 25(OH)D concentrations increased across trimesters, even after adjustments for ppBMI, seasonal variation, and vitamin D intake from supplements (67.5 ± 20.4, 86.5 ± 30.9, and 88.3 ± 29.0 nmol/L at mean ± SD 12.6 ± 0.8, 22.5 ± 0.8, and 33.0 ± 0.6 weeks of gestation, respectively; P < 0.0001). In the first and third trimesters, women with a ppBMI ≥30 had lower serum total 25(OH)D concentrations than women with a ppBMI <25 (P < 0.05); however, most had concentrations >40nmol/L by the second trimester. Vitamin D intake from supplements was the strongest determinant of third-trimester serum total 25(OH)D concentrations (r2 = 0.246, β = 0.51; P < 0.0001).
Conclusions
There was an increase in serum total 25(OH)D concentrations across trimesters, independent of ppBMI, seasonal variation, and vitamin D intake from supplements. Almost all women had serum total 25(OH)D concentrations over the 40- and 50-nmol/L thresholds, thus our study supports the prenatal use of a multivitamin across pregnancy.
Keywords: vitamin D, vitamin D status, pregnancy, 25(OH)D, 25-hydroxyvitamin D, vitamin D intake, supplements
Introduction
The prenatal period is associated with many physiological changes and adaptations that require adequate energy and nutrient intakes. Recommended intakes for almost all nutrients are increased relative to those for nonpregnant women of the same age (1, 2). In Canada, national dietary guidance recommends that all women who could become pregnant take a daily multivitamin containing 400 μg (0.4 mg) of folic acid (2). It is also recommended that pregnant women continue taking this supplement throughout pregnancy to help meet the needs for folic acid and other nutrients like iron. Although the multivitamin recommended for women of childbearing age would typically contain vitamin D, it is not specifically recommended to supplement vitamin D intake during pregnancy. Conversely, in the United Kingdom, the National Institute for Health and Care Excellence recommends that pregnant women and women planning a pregnancy take 400 international units (IU) vitamin D/d throughout pregnancy to ensure adequate vitamin D status (3). Supplemental intake of vitamin D during pregnancy is important to consider, because studies from Canada and elsewhere have reported sizable proportions of pregnant women (range: 18.9%–90%) falling below the daily Estimated Average Requirement (EAR) of 400 IU vitamin D/d (4–8). The EAR value was set in accordance with adequate serum 25-hydroxyvitamin D [25(OH)D] concentrations of 40 nmol/L (9).
Assessment of vitamin D status during pregnancy remains relevant considering that lower serum total 25(OH)D concentrations in pregnant women were previously associated with the development of gestational diabetes mellitus, pre-eclampsia, and preterm birth (10–14). Prenatal vitamin D status is also important for fetal bone mineralization and growth (15). It has also been suggested that Canadian pregnant women may be at greater risk of vitamin D deficiency, considering Canada's higher latitude and therefore reduced ultraviolet β (UVB) exposure, which is necessary for dermal synthesis of vitamin D (16, 17). Notably, the National Academy of Medicine, formerly known as the Institute of Medicine, recommends using serum total 25(OH)D concentration thresholds of 40 and 50 nmol/L for evaluating the vitamin D status of populations and individuals, respectively (9). Nevertheless, some studies still compare their population's serum total 25(OH)D concentrations with the individual threshold value of 50 nmol/L, which corresponds to an RDA of 600 IU/d. In fact, among Canadian cohort studies conducted over the last decade (16, 18–24), serum total 25(OH)D concentrations <50 nmol/L were observed in 2%–45.6% of pregnant women. This rather wide range may be explained by disparities in the timing of the assessment of serum total 25(OH)D concentrations, because some studies have assessed vitamin D status in the first trimester and others did so in the second or third trimesters (25). However, too few studies have investigated the evolution of serum total 25(OH)D concentrations across trimesters of pregnancy to suggest that concentrations <50 or 40 nmol/L are more prevalent in one trimester than in another. Furthermore, among the studies that have assessed serum total 25(OH)D concentrations during pregnancy, very few used the gold-standard method of liquid chromatography tandem mass spectroscopy (LC-MS/MS), which provides more valid and precise measurements. Thus, previously measured concentrations of serum total 25(OH)D may be over- or underestimated because of the timing and/or the method of assessment.
Moreover, only 3 of the mentioned Canadian cohort studies compared serum total 25(OH)D concentrations among prepregnancy body mass index (ppBMI) categories (21, 22, 24). They either observed no difference (21, 22) or higher serum total 25(OH)D concentrations in women with lower compared with greater ppBMI (24). The consideration of ppBMI in the assessment of vitamin D status is important, because obesity and adiposity have been associated with lower serum total 25(OH)D concentrations (26, 27) and because a considerable proportion of women now enter pregnancy with a long-standing BMI in the overweight or obese range (28). Adults with obesity also often require larger doses of vitamin D to reach similar serum total 25(OH)D concentrations to adults with a BMI in the recommended range (29). Thus, considering that the evolution of serum total 25(OH)D concentrations throughout pregnancy remains unclear and that its association with ppBMI is equivocal, we aimed to 1) assess trimester-specific serum total 25(OH)D concentrations, 2) compare those concentrations between ppBMI categories, and 3) examine associations between 25(OH)D concentrations, ppBMI, and vitamin D intake from food and supplements. We hypothesized that 1) serum total 25(OH)D concentrations would increase significantly from the first to the third trimester of pregnancy, 2) women with a higher ppBMI would have lower 25(OH)D concentrations in all trimesters, and 3) 25(OH)D concentrations would be inversely associated with ppBMI but positively associated with vitamin D intakes from food and supplements.
Methods
Participants
The present study used data from the Apports Nutritionnels durant la Grossesse (ANGE) cohort, a prospective study conducted from April 2016 to May 2017 in Québec City, Canada that followed 79 pregnant women from their first to their third trimester of pregnancy (4). Women with twin pregnancies, a severe medical condition (i.e., type 1 or type 2 diabetes, renal or liver disease, inflammatory and autoimmune disorders), and women younger than 18 y were excluded from the study. At each trimester, all participants completed various Web-based questionnaires described below and came to the Research Center for on-site visits. The ANGE study was conducted according to the Declaration of Helsinki guidelines and was approved by the Centre Hospitalier Universitaire de Québec-Université Laval Research Centre's Ethics Committee (reference number: 2016–2866) as well as by Health Canada's Research Ethics Board (reference number: 2019-032H). All women gave their informed written consent during their first on-site visit to the research center.
Vitamin D intake from dietary and supplemental sources
Dietary intakes of vitamin D were assessed by self-administered Web-based 24-h dietary recalls, through the Rappel de 24h Web (R24W) platform. Three dietary recalls were completed in each trimester (at 8.4–14.0, 19.3–28.3, and 31.9–37.7 weeks of gestation). The R24W has been described elsewhere (30, 31) and its use has been validated by our team among pregnant women (32). Briefly, on the day they receive the automatically generated e-mail, participants must report all foods and drinks consumed the day before (24-h period). All food items included in the R24W database are linked to the 2015 Canadian Nutrient File (33), thus enabling the automatic extraction of nutritional information. Daily servings of milk and alternatives, according to the 2007 version of Canada's Food Guide (34), were automatically calculated by the R24W platform. A new version of Canada's Food Guide was published in 2019 (35), but the 2007 version of Canada's Food Guide (34) was used in the present study because it was the dietary guidance in use when the participants completed the recalls. Examples of milk and alternatives servings include 250 mL of milk or plant-based beverages fortified with vitamin D, 175 g of yogurt or kefir, and 50 g of cheese (34). The dietary vitamin D intakes reported in the present study represent sums of vitamin D intakes from all food sources averaged for the 3 recalls per trimester as well as the 9 recalls completed over pregnancy, when referring to trimester-specific and mean dietary intakes of vitamin D, respectively.
Participants also had to complete, in each trimester, a Web-based questionnaire on supplement use, as previously described (4). In brief, women were asked if they were currently taking a supplement and, if so, they reported its brand name and drug identification number or natural health product number, the dose they were taking, as well as the frequency of use. The amount of vitamin D in all reported supplements was collected either from Health Canada's Licensed Natural Health Product Database (36) or from the companies’ product labels or websites. Total vitamin D intake from supplements was evaluated as trimester-specific amounts and subsequently as an average representation of the whole pregnancy (mean of the 3 trimesters). Based on the most common doses of vitamin D reported by participants, mean supplement intake of vitamin D was also categorized as <250, 250–399, 400–599, and ≥600 IU/d.
Vitamin D status
Fasting blood samples were drawn at each trimester (9.9–14.7, 20.7–25.3, and 31.6–34.6 weeks of gestation) and were centrifuged at 20ºC for 10 minutes with a force of 1500 RCF's to extract serum. All samples were stored at −80°C and were later sent to Health Canada's laboratory (Nutrition Research Division) for measurement of the serum total 25(OH)D concentrations by LC-MS/MS (Quattro Premier XE, Waters Limited). Internal standards were first mixed with 150 μL of either serum sample, quality control, or calibrator. All samples were mixed with solutions of ZnSO4 and methanol to denature and precipitate proteins and were then centrifuged at at 20ºC for 5 minutes with a force of 2000 RCF’s. Vitamin D metabolites were separated from the supernatant by solid phase extraction. For each vitamin D metabolite, MS/MS quantitation and ion transitions were obtained. A calibration curve (5-point) was plotted according to the areas of ion peak quantitation and internal standard response. Lastly, vitamin D metabolites’ concentrations in the samples were computed from the calibration curve equation according to their peak areas and adjusting for internal standard response. The Health Canada laboratory is certified by the Vitamin D Standardization Certification Program (VDSCP) as being traceable to the internationally recognized reference procedures for measurement of serum total 25(OH)D (37). Via the VDSCP, the overall accuracy of the method was −2.5% and the precision was 5.7% (2019–2020).
Other variables
Weeks of gestation were confirmed by ultrasound in the first trimester. Each woman's ppBMI was calculated by dividing her self-reported prepregnancy weight by her measured height squared (measured at 9.3 ± 0.7 weeks of gestation), and weight was subsequently measured during all on-site visits. Because only 2 women were categorized as underweight, ppBMI (in kg/m2) was categorized as follows: <25, 25–29.9, and ≥30. Analyses were performed with and without those 2 women and it did not affect the interpretation of the data. Each trimester, participants completed the Web-based French version of the Pregnancy Physical Activity Questionnaire (38, 39), from which daily minutes of moderate- and high-intensity physical activity were calculated. According to the DRIs (1), women were also categorized as sedentary (<30 min/d of moderate-intensity activity), low active (30–59 min/d of moderate-intensity activity), active (60–179 min/d of moderate- or 30–59 min/d of high-intensity activity), or very active (≥180 min/d of moderate- or ≥60 min/d of moderate- plus ≥60 min/d of high-intensity activity). Seasons at the time of blood sampling were defined as follows: spring (21 March–20 June), summer (21 June–20 September), fall (21 September–20 December), and winter (21 December–20 March). Strength of UVB rays at the time of sampling was defined as high (1 April–31 October) or low (1 November–31 March). Finally, sociodemographic variables were surveyed once through a self-administered Web-based questionnaire.
Statistical analyses
Means ± SDs and proportions were used to describe the participants. Chi-square tests and 1-factor ANOVAs were performed to compare baseline characteristics between ppBMI categories. Repeated-measures ANOVAs were used to assess differences in serum total 25(OH)D, 25-hydroxyergocalciferol [25(OH)D2], 25-hydroxycholecalciferol [25(OH)D3], and 3-epi-25-hydroxyvitamin D3 [3-epi-25(OH)D3] concentrations across trimesters, followed by Tukey's honestly significant difference (HSD) post hoc tests for specific differences. Those analyses were adjusted for season at the time of sampling, ppBMI, and vitamin D intake from supplements. One-factor ANOVAs were used to compare trimester-specific serum total 25(OH)D concentrations between ppBMI categories and, in 2 separate models, 25(OH)D concentrations were compared according to season and strength of UVB rays at the time of sampling (measured in weeks of gestation). Tukey's HSD post hoc tests were performed for specific differences. Associations between trimester-specific serum total 25(OH)D concentrations and ppBMI as well as trimester-specific physical activity and vitamin D intake were explored through Pearson's product-moment correlation. A 1-factor ANOVA was used to compare differences in third-trimester serum total 25(OH)D concentrations according to mean (all trimesters) intake of vitamin D from supplements. We chose the third-trimester concentrations because we believe these provide a better reflection of vitamin D intakes throughout the whole pregnancy, contrary to the first and second trimesters. Stepwise regression analyses were performed with the predictor variables of trimester-specific serum total 25(OH)D concentrations. Variables first entered in the stepwise regression were ppBMI, mean or trimester-specific intake of vitamin D from supplements, mean or trimester-specific intake of vitamin D from foods, mean or trimester-specific amount of daily physical activity, education level (university degree compared with no university degree), mother's age, primiparity (being pregnant with their first child), household income, and season at the time of sampling. In that model, in order for season to be a dichotomic variable, summer and fall as well as winter and spring were combined, therefore resulting in a 2-seasonal period. A cutoff of P < 0.25 was used in the stepwise regression, in order to identify which variables could be retained in the model. Finally, chi-square tests were performed to compare proportions of women with serum total 25(OH)D concentrations <40, <50, and ≥125 nmol/L, the latter being associated with adverse effects (9), across ppBMI categories (<25 and ≥25). Fisher's exact test was used instead of the chi-square tests if cells had <5 values. Proportions of women at risk of vitamin D deficiency were not tested across ppBMI categories because only 3 had serum total 25(OH)D concentrations <30 nmol/L in the first trimester and none thereafter. Statistical analyses were performed with JMP version 14 (SAS Institute Inc.) and differences were considered statistically significant at P < 0.05. One participant had extreme values of 25(OH)D concentrations in all trimesters, thus all analyses were done with and without that participant, and her inclusion did not affect the interpretation of the data. The residuals of our analyses were all normally distributed, therefore we did not normalize any of our data.
Results
Most of the 79 women of the ANGE cohort were Caucasian, multiparous, >30 y of age, sedentary, and had a ppBMI <25 (Table 1). Overall socioeconomic status was high, as shown by the proportion of women with a university degree and a household income ≥80,000 CAD. All but 5 individuals (6.3%) reported taking a vitamin D–containing supplement in ≥1 of the 3 trimesters. Vitamin D intakes from food and supplement sources did not vary among trimesters (P = 0.11 and 0.49, respectively), but daily servings of milk and alternatives increased over time (P = 0.002). Women from the 3 ppBMI categories did not differ in terms of age, primiparity, vitamin D intakes (food and supplements), physical activity level, education, and household income (data not shown).
TABLE 1.
Baseline and trimester-specific characteristics of the sample1
| Characteristic | First trimester | Second trimester | Third trimester |
|---|---|---|---|
| Age, y | 32.1 ± 3.7 | ||
| Primiparous | 28 (35.4) | ||
| Prepregnancy BMI, kg/m2 | 25.7 ± 5.8 | ||
| Underweight | 2 (2.5) | ||
| Normal weight | 43 (54.4) | ||
| Overweight | 19 (24.1) | ||
| Obese | 15 (19.0) | ||
| Ethnicity—Caucasian2 | 77 (97.5) | ||
| Education | |||
| High school | 4 (5.0) | ||
| College | 13 (16.5) | ||
| University | 62 (78.5) | ||
| Household income, CAD | |||
| <60,000 | 15 (19.0) | ||
| 60,000–79,999 | 13 (16.5) | ||
| 80,000–99,999 | 17 (21.5) | ||
| ≥100,000 | 33 (41.8) | ||
| Income not disclosed | 1 (1.2) | ||
| Gestational age at sampling, weeks of gestation | 12.6 ± 0.8 | 22.5 ± 0.8 | 33.0 ± 0.6 |
| Season of sampling | |||
| Spring | 24 (30.4) | 12 (15.2) | 15 (19.0) |
| Summer | 26 (32.9) | 26 (32.9) | 15 (19.0) |
| Fall | 21 (26.6) | 25 (31.6) | 28 (35.4) |
| Winter | 8 (10.1) | 16 (20.3) | 21 (26.6) |
| Supplement use | |||
| Multivitamin | 61 (77.2) | 62 (78.4) | 61 (77.2) |
| Multivitamin only | 57 (72.2) | 58 (73.4) | 58 (73.4) |
| Multivitamin and vitamin D | 4 (5.1) | 4 (5.1) | 3 (3.8) |
| Vitamin D supplement only | 1 (1.2) | 0 | 0 |
| No supplement containing vitamin D | 17 (21.5) | 17 (21.5) | 18 (22.8) |
| Vitamin D intake, IU/d | |||
| Dietary | 235 ± 119 | 261 ± 135 | 272 ± 150 |
| Supplemental | 397 ± 531 | 428 ± 521 | 418 ± 517 |
| Total | 632 ± 556 | 690 ± 538 | 689 ± 545 |
| Servings of milk and alternatives,3 servings/d | 2.5 ± 1.1 | 2.7 ± 1.4 | 3.0 ± 1.4 |
| Physical activity level4 | |||
| Sedentary | 40 (50.6) | 52 (65.8) | 54 (68.4) |
| Low active | 14 (17.7) | 9 (11.4) | 11 (13.9) |
| Active and very active | 25 (31.6) | 18 (22.8) | 14 (17.7) |
Values are means ± SDs or n (%), n = 79. CAD, Canadian dollars; IU, international units.
Other ethnicities include Middle-Eastern (n = 1) and Venezuelan (n = 1).
According to the 2007 version of Canada's Food Guide (cheese, yogurt, cow milk, plant-based beverages fortified with vitamin D, etc.) (34).
Physical activity level was determined by categorizing participants according to the daily amount of time engaged in moderate- and high-intensity activities as follows: Sedentary, <30 min of moderate-intensity activity; Low active, 30–59 min of moderate-intensity activity; Active, 60–179 min of moderate- or 30–59 min of high-intensity activity; Very active, ≥180 min of moderate- or ≥60 min of moderate- plus ≥60 min of high-intensity activity. The Active and Very active categories were combined owing to their small sample sizes.
Concentrations of serum total 25(OH)D, 25(OH)D2, and 25(OH)D3 all increased significantly across trimesters, even after adjustments for season at the time of sampling, ppBMI, and vitamin D intake from supplements (Table 2). Concentrations of 3-epi-25(OH)D3 did not vary across trimesters. Overall, 5 women had serum total 25(OH)D concentrations <40 nmol/L in the first trimester, compared with 2 women in the second and third trimesters (Supplemental Table 1). Proportions of women with serum total 25(OH)D concentrations <40 nmol/L were low and did not differ between ppBMI categories (Supplemental Table 1). A higher proportion of women with overweight and obesity had serum total 25(OH)D concentrations <50 nmol/L in the first trimester than for women with under- and normal weight, but these same proportions were similar, between ppBMI categories, in the second and third trimesters (Supplemental Table 1). One woman had serum total 25(OH)D concentrations ≥125 nmol/L in the first trimester, whereas 6 women were at or above that threshold in the second and third trimesters.
TABLE 2.
Comparison of pregnant women's serum total 25(OH)D, 25(OH)D2, 25(OH)D3, and 3-epi-25(OH)D3 concentrations across trimesters of pregnancy1
| First trimester (9.9–14.7 wk) | Second trimester (20.7–25.3 wk) | Third trimester (31.6–34.6 wk) | P value | |
|---|---|---|---|---|
| 25(OH)D2,2 nmol/L | 1.8 ± 0.9b | 2.2 ± 1.4a | 2.9 ± 2.2a | <0.0001 |
| 25(OH)D3, nmol/L | 65.7 ± 20.6b | 84.3 ± 30.9a | 85.3 ± 28.9a | <0.0001 |
| Total 25(OH)D, nmol/L | 67.5 ± 20.4b | 86.5 ± 30.9a | 88.3 ± 29.0a | <0.0001 |
| 3-epi-25(OH)D3,3 nmol/L | 3.0 ± 1.7 | 3.1 ± 2.4 | 3.8 ± 2.2 | 0.57 |
Values are means ± SDs, n = 79.
25(OH)D2 concentrations were under the detection limit of 3 nmol/L for 70, 60, and 44 participants in the first, second, and third trimesters, respectively. In those cases, a value of 1.5 nmol/L was used.
3-epi-25(OH)D3 concentrations were under the detection limit of 2.5 nmol/L for 31, 34, and 40 participants in the first, second, and third trimesters, respectively. In those cases, a value of 1.25 nmol/L was used. All P values refer to repeated-measures ANOVA adjusted for season at the time of sampling, prepregnancy BMI, and vitamin D intake from supplements. Labeled means in a row without a common letter differ, P < 0.05. 3-epi-25(OH)D3, 3-epi-25-hydroxyvitamin D3; 25(OH)D, 25-hydroxyvitamin D; 25(OH)D2, 25-hydroxyergocalciferol; 25(OH)D3, 25-hydroxycholecalciferol.
Women with under- and normal weight had significantly higher serum total 25(OH)D concentrations than women with overweight and obesity in the first trimester (Figure 1). Similarly, in the third trimester, women with under- and normal weight had higher serum total 25(OH)D concentrations than women with obesity. No differences were observed in serum total 25(OH)D concentrations among BMI categories in the second trimester. Serum total 25(OH)D concentrations in the first and second trimesters also differed according to season at the time of blood sampling, with higher concentrations observed when blood was drawn in summer or fall (Supplemental Table 2). Serum total 25(OH)D concentrations did not differ according to strength of UVB rays at the time of sampling (Supplemental Table 3).
FIGURE 1.
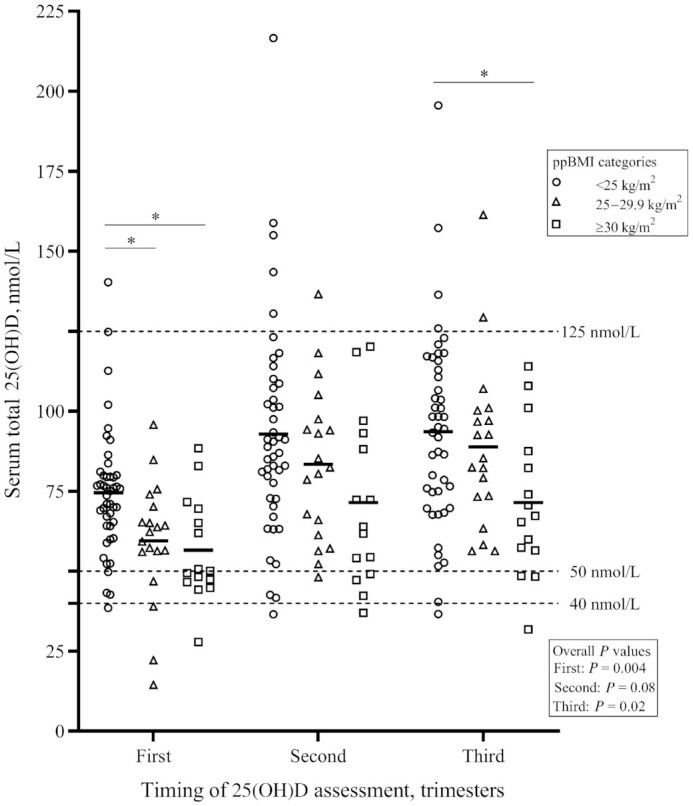
Comparison of pregnant women's trimester-specific concentrations of serum total 25(OH)D according to ppBMI categories (n = 79). Symbols represent individual 25(OH)D concentrations, thick lines represent mean 25(OH)D concentrations for each ppBMI category. Overall P values refer to 1-factor ANOVAs performed to compare serum total 25(OH)D concentrations between ppBMI categories, for each trimester and after adjustment for season at the time of sampling. *Different from women with a ppBMI <25 kg/m2, P < 0.05. ppBMI, prepregnancy body mass index; 25(OH)D, 25-hydroxyvitamin D.
In all trimesters of pregnancy, serum total 25(OH)D concentrations were inversely correlated with ppBMI (P < 0.01) and positively correlated with trimester-specific supplemental and total vitamin D intakes, even after adjustment for season at the time of sampling (Table 3). Total minutes of moderate- and high-intensity physical activity were only associated with serum total 25(OH)D concentrations in the second trimester. Positive correlations were also observed between serum total 25(OH)D concentrations and daily servings of milk and alternatives and vitamin D intakes from foods, but only in the third trimester.
TABLE 3.
Correlations between trimester-specific concentrations of pregnant women's serum total 25(OH)D, ppBMI, and trimester-specific physical activity and dietary variables1
| First trimester | Second trimester | Third trimester | ||||
|---|---|---|---|---|---|---|
| r | r adj | r | r adj | r | r adj | |
| ppBMI | −0.42** | −0.42*** | −0.33** | −0.32** | −0.33** | −0.34** |
| Physical activity, min/d | 0.08 | 0.09 | 0.38** | 0.40** | 0.12 | 0.13 |
| Vitamin D intake from foods | 0.13 | 0.14 | 0.18 | 0.13 | 0.26* | 0.27* |
| Vitamin D intake from supplements | 0.53*** | 0.58*** | 0.57*** | 0.59*** | 0.52*** | 0.50*** |
| Total intake of vitamin D | 0.53*** | 0.59*** | 0.60*** | 0.60*** | 0.56*** | 0.55*** |
| Daily servings of milk and alternatives | −0.06 | −0.09 | 0.11 | 0.06 | 0.20 | 0.22* |
Values are Pearson's r or the coefficient adjusted for season at the time of sampling (radj), n = 79. *,**,***Significant correlation: *P < 0.05, **P < 0.01, ***P < 0.0001. ppBMI, prepregnancy BMI; 25(OH)D, 25-hydroxyvitamin D.
Third-trimester serum total 25(OH)D concentrations by mean supplemental intake of vitamin D were analyzed because vitamin D intakes from supplements did not vary across trimesters (Figure 2). Women with a mean supplemental intake of vitamin D ≥600 IU/d had higher serum total 25(OH)D concentrations than women in the 3 other, lower categories of supplemental intake (P < 0.001). The median (IQR) supplemental intake of vitamin D in the ≥600 IU/d category was 667 IU/d (600–1000 IU/d) and the median (IQR) total (food and supplements) vitamin D intake was 1027 IU/d (869–1310 IU/d).
FIGURE 2.
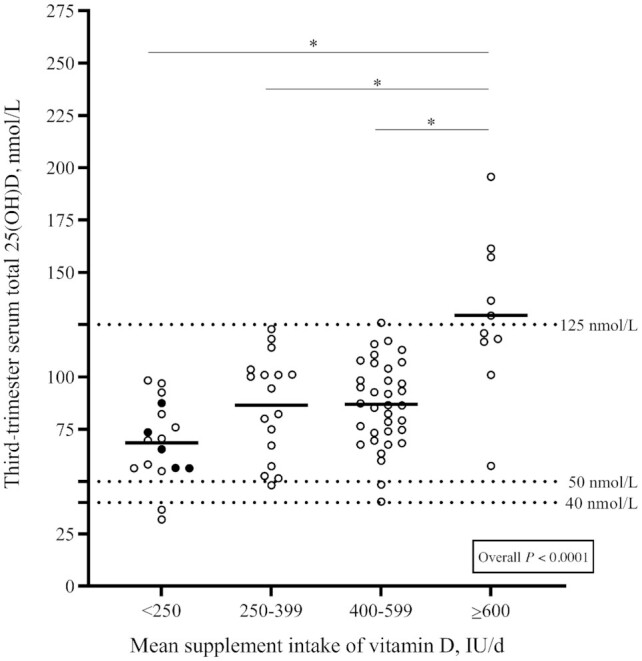
Comparison of pregnant women's third-trimester serum total 25(OH)D concentrations according to their mean intake of vitamin D from supplements (n = 79). Circles represent individual 25(OH)D concentrations, thick lines represent mean 25(OH)D concentrations for each supplement intake category. Solid black circles represent women that did not take any vitamin D–containing supplement throughout pregnancy. Overall P values refer to the 1-factor ANOVA used to compare third-trimester serum total 25(OH)D concentrations according to mean supplement intake of vitamin D, after adjustment for season at the time of sampling and prepregnancy BMI. *Different from women with a mean supplement intake ≥600 IU/d, P < 0.05. IU, international units; 25(OH)D, 25-hydroxyvitamin D.
Vitamin D intake from supplements was identified as the most significant determinant of third-trimester serum total 25(OH)D concentrations (Table 4). The same analysis was performed for the other trimesters and vitamin D intake from supplements was also identified as the most significant determinant of the first and second trimesters’ serum total 25(OH)D concentrations (Supplemental Tables 4, 5). Other significant determinants of third-trimester serum total 25(OH)D concentrations included ppBMI and blood sampling done in winter/spring compared with summer/fall, in a model that also included minutes of physical activity, vitamin D intakes from foods, education level (university degree compared with no university degree), mother's age, primiparity, and household income.
TABLE 4.
Stepwise regression analysis of pregnant women's third-trimester concentrations of serum total 25(OH)D1
| r 2 | β (95% CI) | P value | |
|---|---|---|---|
| Mean (all trimesters) intake of vitamin D from supplements, IU/d | 0.246 | 0.51 (0.25, 0.71) | <0.0001 |
| Prepregnancy BMI, kg/m2 | 0.052 | −0.23 (−0.44, 0.05) | 0.009 |
| Third-trimester sampling done in winter/spring (vs. summer/fall)2 | 0.042 | −0.21 (−0.44, 0.02) | 0.02 |
| Mean (all trimesters) amount of physical activity, min/d | 0.027 | 0.17 (−0.07, 0.39) | 0.06 |
| University degree (vs. no university degree) | 0.015 | −0.13 (−0.31, 0.12) | 0.15 |
| Total | 0.376 | <0.0001 |
n = 79. β coefficients, r2, and P values are not shown for variables that were not included in the regression model (P > 0.25) following the stepwise procedure. Other variables tested in the stepwise procedure were age, primiparity (being pregnant with first child), vitamin D intake from foods, and household income. IU, international units; 25(OH)D, 25-hydroxyvitamin D.
Seasons at the time of blood sampling were defined as follows: winter/spring (21 December–20 June), summer/fall (21 June–20 December).
Discussion
Using data from a prospective pregnancy cohort, we aimed to measure and compare trimester-specific concentrations of serum total 25(OH)D in pregnant women, as well as to compare those concentrations between ppBMI categories. We also examined the associations between serum total 25(OH)D concentrations, ppBMI, and vitamin D intakes measured by a validated repeated 24-h recall assessment of food and supplements. To our knowledge, this is the first French-Canadian study to do so. Serum total 25(OH)D, 25(OH)D2, and 25(OH)D3, but not 3-epi-25(OH)D3, increased across pregnancy, even after adjustment for ppBMI and season at the time of sampling. Very few women had serum total 25(OH)D concentrations below the thresholds of 40 and 50 nmol/L and above the limit of 125 nmol/L, indicating an overall adequate vitamin D status. Although women with obesity had significantly lower serum total 25(OH)D concentrations in the first and third trimesters than women with a ppBMI <25, at least 95% of them had serum total 25(OH)D concentrations that were within the target ranges in all trimesters. Serum total 25(OH)D concentrations were inversely associated with ppBMI in all trimesters, but more strongly so in the first. The supplemental intake of vitamin D was thus effective in improving vitamin D status among women of higher ppBMI. Vitamin D intake from supplements was positively correlated with serum total 25(OH)D concentrations in each trimester, unlike dietary vitamin D intakes, the latter reflecting the mean intakes reported by the three 24-h recalls completed at each trimester. Women who reported an average intake of ≥600 IU supplemental vitamin D/d had higher serum total 25(OH)D concentrations (all >50nmol/L) in the third trimester than women with lower intakes from supplements. Finally, mean intake of vitamin D from supplements was identified as the strongest determinant of third-trimester serum total 25(OH)D concentrations.
Other longitudinal studies around the world found that serum total 25(OH)D concentrations increased throughout pregnancy (40–48). In the present study, it could be argued that the use of multivitamins containing vitamin D by most of our sample in the first trimester is the main reason for the increase in serum total 25(OH)D concentrations from the first to the second and third trimesters. Still, the observed increase in the present study remained significant even after adjustment for vitamin D intake from supplements. Moreover, some of the previously cited studies observed an increase in serum total 25(OH)D concentrations even though none of their participants reported taking a supplement containing vitamin D throughout their whole pregnancy (40, 43, 45). For example, a Brazilian study published in 2018 measured plasma 25(OH)D concentrations in 199 women and observed a significant increase, from (mean ± SD) 65.0 ± 17.7 nmol/L in the first to 84.1 ± 24.5 nmol/L in the third trimester, which is very similar to our concentrations, even though none of their participants took a supplement containing vitamin D (43). Another study by O'Riordan et al. (45), conducted in Ireland among 43 pregnant women, observed a similar increase in serum total 25(OH)D concentrations (from mean ± SD 39.2 ± 17.9 nmol/L in the first to 53.3 ± 28.4 nmol/L in the third trimester) among women that did not take any supplement throughout their pregnancy. However, those studies did not assess trimester-specific dietary intakes of vitamin D and the increase they observed might be due to seasonal variation and sun exposure. Still, it could be hypothesized that some physiological factors, in addition to supplemental vitamin D, could influence the variations in serum total 25(OH)D concentrations across trimesters. In fact, even though it has not yet been confirmed that pregnancy itself directly affects serum total 25(OH)D concentrations, it was previously reported that some metabolites and active forms of vitamin D, as well as vitamin-D binding protein, are increased in high-estrogen states like pregnancy (49). Further longitudinal analyses of serum total 25(OH)D concentrations in pregnant women should be conducted to better understand its fluctuations throughout pregnancy.
The observed increase in serum total 25(OH)D concentrations was significant, even after an adjustment for ppBMI. Notably, the proportion of women with overweight or obesity in our sample (43.1%) was similar to that of all Canadian women aged 20–34 y, which was ∼40% in 2018 (50). It would be in accordance with the current literature to assume that, because 43% of our sample had a higher BMI, we would have observed a greater prevalence of 25(OH)D concentrations <40nmol/L. However, that was not the case. In fact, although women with obesity had lower serum total 25(OH)D concentrations in the first trimester, most (93.3%) of them were above the suggested target of 40 nmol/L by the third trimester. Therefore, they likely entered the pregnancy with lower vitamin D status, but most of them took a multivitamin or a supplement, which correlated with increased serum total 25(OH)D in the third trimester. As mentioned in the Introduction, the inverse association between vitamin D status and ppBMI has been previously reported (51, 52). In our study, vitamin D intakes from food as well as from supplements in pregnancy did not differ between women with obesity and women with normal weight. The lower first-trimester serum total 25(OH)D concentrations may reflect prepregnancy dietary intakes more so than an increased need. This is further supported by similar increments among all ppBMI categories across trimesters. Thus, women with a ppBMI ≥30 who take a multivitamin containing vitamin D appear to achieve adequate vitamin D status, indicating that supplementation during pregnancy is an effective strategy. Furthermore, our results suggest that an individual assessment of nutrient intake and risk of deficiency would be preferable, as opposed to recommending that all pregnant women with obesity should take additional vitamin D supplementation. This was also highlighted in a review of national guidelines for pregnant women with obesity (53).
Although most of our participants were of high socioeconomic status and reported taking a multivitamin and/or a single-nutrient supplement that contained vitamin D, 22% of women did not report taking a vitamin D–containing supplement in the first trimester. Some of those women started to take a multivitamin later on, but conversely, other women that did report taking a multivitamin in the first trimester stopped doing so in the second or third trimester. This is concerning, considering that Health Canada recommends that all pregnant women should take a multivitamin containing ≥0.4 mg folic acid and 16–20 mg Fe (2). Although Health Canada does not specify that the multivitamin should contain vitamin D, most multivitamins do. The promotion of multivitamin use among pregnant women has been successful in increasing folic acid intakes (54), but does require further improvements to ensure that women meet the EAR for vitamin D through diet and supplemental intakes consistently during pregnancy. Furthermore, there is no existing consensus on what dose of vitamin D should be contained in prenatal multivitamins.
Based on pregnancy cohorts in Canada, prenatal multivitamin vitamin D content typically varies from 250 to 600 IU/tablet (22). In our study, the median vitamin D content of the multivitamins was 400 IU/d, and only approached 600 IU/d by the second trimester in 25% of the women. Thus, most of our participants had an average supplemental intake of vitamin D that was <600 IU/d. Still, among the participants that did report an average vitamin D intake from supplements ≥600 IU/d, there was no evidence of inadequacy [0% had serum total 25(OH)D <50 and <40 nmol/L in the third trimester]. Similarly, Perreault et al. (22) found that most of their participants met or exceeded the target value of 50 nmol/L, and their mean total vitamin D intake was similar to ours. A recent randomized controlled trial by O'Callaghan et al. (55) found that Irish pregnant women receiving a daily supplement of 800 IU vitamin D, in addition to their baseline vitamin D intake, maintained 25(OH)D concentrations ≥50 nmol/L during their pregnancy. Ireland's higher latitude, lack of mandated vitamin D–fortified foods, as well as the fact that their participants were mostly enrolled in the winter months and that more of them were vitamin D deficient at baseline may explain why, in their study, a dose >600 IU supplemental vitamin D/d was necessary to achieve and maintain sufficient 25(OH)D concentrations. In contrast, and as mentioned in the Introduction, recommendations from the United Kingdom state that pregnant women should take a vitamin D supplement of 400 IU/d throughout pregnancy (3). Furthermore, a recent meta-analysis of 30 trials from various countries found that taking a supplement of ≥601 IU/d compared with ≤600 IU/d made little to no difference on the risk of various pregnancy outcomes (pre-eclampsia, preterm birth, and low birth weight) (56). Similar findings were obtained when comparing ≥4000 IU/d with ≤3999 IU/d. In summary, the appropriate dosage of supplemental vitamin D during pregnancy has not been determined yet and appears to vary according to the outcomes studied as well as the setting (country). Still, in consideration of our results and those of other studies from Canadian regions or provinces, a daily supplemental intake of 600 IU vitamin D appears to be sufficient to achieve adequate concentrations of serum total 25(OH)D ≥50 nmol/L, when measured by LC-MS/MS.
The present study has many strengths, including the measurement of serum total 25(OH)D concentrations with a VDSCP-certified LC-MS/MS method. The prospective design of our study is also a considerable strength, because it makes us the first study in Canada that we know of to assess serum total 25(OH)D concentrations in all trimesters of pregnancy. We also used multiple validated Web-based 24-h recalls in each trimester combined with a questionnaire on supplement use, allowing us to obtain detailed information on dietary and supplemental intakes of vitamin D, which was crucial in our study. Our study however has some limitations, namely the small size and the overall homogeneity of our sample in terms of ethnicity and socioeconomic status. This limits the generalizability of our findings; thus, our analyses should be replicated in pregnant women of various ethnic backgrounds and of lower socioeconomic status. Still, despite our small sample size, we were able to observe significant differences in vitamin D status with regards to ppBMI and supplemental intake of vitamin D. The fact that we used a self-reported weight to calculate the ppBMI of our participants, which could translate into an underestimation of actual ppBMI, is also a limitation of our study. Still, the reliability of women's self-reported weight has been previously demonstrated (57). Moreover, we did not collect detailed information regarding our participants’ sun exposure habits, but we, like other authors (18, 20–24), considered seasonal variation in all our analyses. Our study is also limited by the fact that we did not collect any preconception data regarding supplement use, nor did we draw our participants’ blood in the preconception period, which would have informed us even more regarding the evolution of maternal vitamin D status. Finally, we did not include data regarding 24,25(OH)2D3, another vitamin D metabolite, which prevented us from further exploring its potential role in the prenatal period. The LC-MS/MS method used in this study did, however, separate the 3-epi-25(OH)D3 from the total 25(OH)D concentrations, which allowed us to bypass the issues caused by its interference.
In conclusion, serum total 25(OH)D concentrations increased from the first trimester to the second and third trimesters, regardless of ppBMI, season at the time of blood sampling, and supplemental intake of vitamin D. It is however not clear if the use of supplements containing vitamin D is the sole reason behind the increase in serum total 25(OH)D concentrations, and associations between vitamin D status and estrogen should be investigated. Although very few women had serum total 25(OH)D concentrations below the 40 and 50 nmol/L and above the 125 nmol/L thresholds, our study supports the prenatal use of a multivitamin across pregnancy. Additional studies are necessary to identify what dose of vitamin D is optimal, i.e., one that promotes an adequate vitamin D status while avoiding concentrations >125 nmol/L. Furthermore, because a considerable proportion of women were not taking any vitamin D–containing supplement in their first trimester, this study reiterates the importance of promoting the use of a daily multivitamin among pregnant women.
Supplementary Material
ACKNOWLEDGEMENTS
The authors’ responsibilities were as follows—A-SM, SL, HAW, and CS: designed the research; A-SM, CS, and A-SP: conducted the research; CS, A-SP, and AB: analyzed the data; CS: wrote the first draft of the manuscript, with major contributions from all other authors; A-SM: had primary responsibility for the final content; and all authors: critically revised a first draft of the manuscript for important intellectual content and read and approved the final manuscript.
Notes
The Apports Nutritionnels durant la Grossesse (ANGE) project is funded by Danone Institute of Canada grant FO115961 (to A-SM) and by startup funds: fonds de recherche du Québec-Santé et Fondation du Centre Hospitalier Universitaire de Québec. CS was supported by Canadian Institutes of Health Research graduate student award FRN: GSD-167043.
Author disclosures: HAW is a member of the Journal’s Editorial Board and played no role in the Journal’s evaluation of the manuscript. The authors report no conflicts of interest.
All funding allowed the collection, analysis, and interpretation of data, but played no role in the writing of this article.
Supplemental Tables 1–5 are available from the “Supplementary data” link in the online posting of the article and from the same link in the online table of contents at https://academic.oup.com/jn.
Abbreviations used: ANGE, Apports Nutritionnels durant la Grossesse; EAR, Estimated Average Requirement; HSD, honestly significant difference; IU, international units; LC-MS/MS, liquid chromatography tandem mass spectroscopy; ppBMI, prepregnancy body mass index; R24W, rappel de 24h web; UVB, ultraviolet β; VDSCP, Vitamin D Standardization Certification Program; 3-epi-25(OH)D3, 3-epi-25-hydroxyvitamin D3; 25(OH)D, 25-hydroxyvitamin D; 25(OH)D2, 25-hydroxyergocalciferol; 25(OH)D3, 25-hydroxycholecalciferol.
Contributor Information
Claudia Savard, School of Nutrition, Laval University, Québec City, Québec, Canada; Endocrinology and Nephrology Unit, CHU of Québec Research Center-Laval University, Québec City, Québec, Canada; NUTRISS Research Center, Institute of Nutrition and Functional Foods, Laval University, Québec City, Québec, Canada.
Agnieszka Bielecki, Nutrition Research Division, Bureau of Nutritional Sciences, Health Products and Food Branch, Health Canada, Ottawa, Ontario, Canada.
Anne-Sophie Plante, Endocrinology and Nephrology Unit, CHU of Québec Research Center-Laval University, Québec City, Québec, Canada; NUTRISS Research Center, Institute of Nutrition and Functional Foods, Laval University, Québec City, Québec, Canada.
Simone Lemieux, School of Nutrition, Laval University, Québec City, Québec, Canada; NUTRISS Research Center, Institute of Nutrition and Functional Foods, Laval University, Québec City, Québec, Canada.
Claudia Gagnon, Endocrinology and Nephrology Unit, CHU of Québec Research Center-Laval University, Québec City, Québec, Canada; Department of Medicine, Laval University, Québec City, Québec, Canada.
Hope A Weiler, Nutrition Research Division, Bureau of Nutritional Sciences, Health Products and Food Branch, Health Canada, Ottawa, Ontario, Canada.
Anne-Sophie Morisset, School of Nutrition, Laval University, Québec City, Québec, Canada; Endocrinology and Nephrology Unit, CHU of Québec Research Center-Laval University, Québec City, Québec, Canada; NUTRISS Research Center, Institute of Nutrition and Functional Foods, Laval University, Québec City, Québec, Canada.
References
- 1. Otten J, Hellwig J, Meyers L. Dietary Reference Intakes: the essential guide to nutrient requirements. Washington (DC): US National Academies Press; 2006. [Google Scholar]
- 2. Health Canada . Prenatal nutrition guidelines for health professionals. Ottawa (Ontario): Health Canada; 2009. [Google Scholar]
- 3. Hynes C, Jesurasa A, Evans P, Mitchell C. Vitamin D supplementation for women before and during pregnancy: an update of the guidelines, evidence, and role of GPs and practice nurses. Br J Gen Pract. 2017;67:423–4. [DOI] [PMC free article] [PubMed] [Google Scholar]
- 4. Savard C, Lemieux S, Weisnagel SJ, Fontaine-Bisson B, Gagnon C, Robitaille J, Morisset AS. Trimester-specific dietary intakes in a sample of French-Canadian pregnant women in comparison with national nutritional guidelines. Nutrients. 2018;10:768. [DOI] [PMC free article] [PubMed] [Google Scholar]
- 5. Dubois L, Diasparra M, Bedard B, Colapinto CK, Fontaine-Bisson B, Morisset AS, Tremblay RE, Fraser WD. Adequacy of nutritional intake from food and supplements in a cohort of pregnant women in Quebec, Canada: the 3D Cohort Study (Design, Develop, Discover). Am J Clin Nutr. 2017;106:541–8. [DOI] [PubMed] [Google Scholar]
- 6. Giddens JB, Krug SK, Tsang RC, Guo S, Miodovnik M, Prada JA. Pregnant adolescent and adult women have similarly low intakes of selected nutrients. J Am Diet Assoc. 2000;100:1334–40. [DOI] [PubMed] [Google Scholar]
- 7. Blumfield ML, Hure AJ, Macdonald-Wicks L, Smith R, Collins CE. A systematic review and meta-analysis of micronutrient intakes during pregnancy in developed countries. Nutr Rev. 2013;71:118–32. [DOI] [PubMed] [Google Scholar]
- 8. Aghajafari F, Field CJ, Weinberg AR, Letourneau N, APrON Study Team . Both mother and infant require a vitamin D supplement to ensure that infants’ vitamin D status meets current guidelines. Nutrients. 2018;10:429. [DOI] [PMC free article] [PubMed] [Google Scholar]
- 9. Institute of Medicine Committee to Review Dietary Reference Intakes for Vitamin D and Calcium . Ross AC, Taylor CL, Yaktine AL, Del ValleHB,. Dietary Reference Intakes for calcium and vitamin D. Washington (DC): National Academies Press; 2011. [PubMed] [Google Scholar]
- 10. Amegah AK, Klevor MK, Wagner CL. Maternal vitamin D insufficiency and risk of adverse pregnancy and birth outcomes: a systematic review and meta-analysis of longitudinal studies. PLoS One. 2017;12:e0173605. [DOI] [PMC free article] [PubMed] [Google Scholar]
- 11. Lu M, Xu Y, Lv L, Zhang M. Association between vitamin D status and the risk of gestational diabetes mellitus: a meta-analysis. Arch Gynecol Obstet. 2016;293:959–66. [DOI] [PubMed] [Google Scholar]
- 12. Qin L-L, Lu F-G, Yang S-H, Xu H-L, Luo B-A. Does maternal vitamin D deficiency increase the risk of preterm birth: a meta-analysis of observational studies. Nutrients. 2016;8:301. [DOI] [PMC free article] [PubMed] [Google Scholar]
- 13. Tabesh M, Salehi-Abargouei A, Tabesh M, Esmaillzadeh A. Maternal vitamin D status and risk of pre-eclampsia: a systematic review and meta-analysis. J Clin Endocrinol Metab. 2013;98:3165–73. [DOI] [PubMed] [Google Scholar]
- 14. Zhou S-S, Tao Y-H, Huang K, Zhu B-B, Tao F-B. Vitamin D and risk of preterm birth: up-to-date meta-analysis of randomized controlled trials and observational studies. J Obstet Gynaecol Res. 2017;43:247–56. [DOI] [PubMed] [Google Scholar]
- 15. Kovacs CS. Calcium, phosphorus, and bone metabolism in the fetus and newborn. Early Hum Dev. 2015;91:623–8. [DOI] [PubMed] [Google Scholar]
- 16. Aghajafari F, Field CJ, Kaplan BJ, Rabi DM, Maggiore JA, O'Beirne M, Hanley DA, Eliasziw M, Dewey D, Weinberg Aet al. The current recommended vitamin D intake guideline for diet and supplements during pregnancy is not adequate to achieve vitamin D sufficiency for most pregnant women. PLoS One. 2016;11:e0157262. [DOI] [PMC free article] [PubMed] [Google Scholar]
- 17. Webb AR, Kline L, Holick MF. Influence of season and latitude on the cutaneous synthesis of vitamin D3: exposure to winter sunlight in Boston and Edmonton will not promote vitamin D3 synthesis in human skin. J Clin Endocrinol Metab. 1988;67:373–8. [DOI] [PubMed] [Google Scholar]
- 18. Kramer CK, Ye C, Swaminathan B, Hanley AJ, Connelly PW, Sermer M, Zinman B, Retnakaran R. The persistence of maternal vitamin D deficiency and insufficiency during pregnancy and lactation irrespective of season and supplementation. Clin Endocrinol (Oxf). 2016;84:680–6. [DOI] [PubMed] [Google Scholar]
- 19. Lacroix M, Battista MC, Doyon M, Houde G, Menard J, Ardilouze JL, Hivert MF, Perron P. Lower vitamin D levels at first trimester are associated with higher risk of developing gestational diabetes mellitus. Acta Diabetol. 2014;51:609–16. [DOI] [PubMed] [Google Scholar]
- 20. Lehotay DC, Smith P, Krahn J, Etter M, Eichhorst J. Vitamin D levels and relative insufficiency in Saskatchewan. Clin Biochem. 2013;46:1489–92. [DOI] [PubMed] [Google Scholar]
- 21. Li W, Green TJ, Innis SM, Barr SI, Whiting SJ, Shand A, von Dadelszen P. Suboptimal vitamin D levels in pregnant women despite supplement use. Can J Public Health. 2011;102:308–12. [DOI] [PMC free article] [PubMed] [Google Scholar]
- 22. Perreault M, Moore CJ, Fusch G, Teo KK, Atkinson SA. Factors associated with serum 25-hydroxyvitamin D concentration in two cohorts of pregnant women in southern Ontario, Canada. Nutrients. 2019;11:123. [DOI] [PMC free article] [PubMed] [Google Scholar]
- 23. Wei SQ, Audibert F, Hidiroglou N, Sarafin K, Julien P, Wu Y, Luo ZC, Fraser WD. Longitudinal vitamin D status in pregnancy and the risk of pre-eclampsia. BJOG. 2012;119:832–9. [DOI] [PubMed] [Google Scholar]
- 24. Woolcott CG, Giguère Y, Weiler HA, Spencer A, Forest JC, Armson BA, Dodds L. Determinants of vitamin D status in pregnant women and neonates. Can J Public Health. 2016;107:e410–e16. [DOI] [PMC free article] [PubMed] [Google Scholar]
- 25. Savard C, Gagnon C, Morisset A-S. Disparities in the timing and measurement methods to assess vitamin D status during pregnancy: a narrative review. Int J Vitam Nutr Res. 2018;88:176–89. [DOI] [PubMed] [Google Scholar]
- 26. Vilarrasa N, Maravall J, Estepa A, Sánchez R, Masdevall C, Navarro MA, Alía P, Soler J, Gómez JM. Low 25-hydroxyvitamin D concentrations in obese women: their clinical significance and relationship with anthropometric and body composition variables. J Endocrinol Invest. 2007;30:653–8. [DOI] [PubMed] [Google Scholar]
- 27. Pereira-Santos M, Costa PRF, Assis AMO, Santos CAST, Santos DB. Obesity and vitamin D deficiency: a systematic review and meta-analysis. Obes Rev. 2015;16:341–9. [DOI] [PubMed] [Google Scholar]
- 28. Public Health Agency of Canada . Obesity in Canada: a joint report from the Public Health Agency of Canada and the Canadian Institute for Health Information. [Internet]. Ottawa (Ontario): Public Health Agency of Canada; 2011; [cited July 2020]. Available from: https://www.canada.ca/content/dam/phac-aspc/migration/phac-aspc/hp-ps/hl-mvs/oic-oac/assets/pdf/oic-oac-eng.pdf. [Google Scholar]
- 29. Holick MF, Binkley NC, Bischoff-Ferrari HA, Gordon CM, Hanley DA, Heaney RP, Murad MH, Weaver CM. Evaluation, treatment, and prevention of vitamin D deficiency: an Endocrine Society clinical practice guideline. J Clin Endocrinol Metab. 2011;96:1911–30. [DOI] [PubMed] [Google Scholar]
- 30. Jacques S, Lemieux S, Lamarche B, Laramée C, Corneau L, Lapointe A, Tessier-Grenier M, Robitaille J. Development of a web-based 24-h dietary recall for a French-Canadian population. Nutrients. 2016;8:724. [DOI] [PMC free article] [PubMed] [Google Scholar]
- 31. Lafrenière J, Laramée C, Robitaille J, Lamarche B, Lemieux S. Assessing the relative validity of a new, web-based, self-administered 24 h dietary recall in a French-Canadian population. Public Health Nutr. 2018;21:2744–52. [DOI] [PMC free article] [PubMed] [Google Scholar]
- 32. Savard C, Lemieux S, Lafrenière J, Laramée C, Robitaille J, Morisset A-S. Validation of a self-administered web-based 24-hour dietary recall among pregnant women. BMC Pregnancy Childbirth. 2018;18:112. [DOI] [PMC free article] [PubMed] [Google Scholar]
- 33. Health Canada . Canadian Nutrient File (CNF). [Internet]. Ottawa (Ontario: ): Health Canada; 2015; [cited July 2020]. Available from: https://food-nutrition.canada.ca/cnf-fce/index-eng.jsp. [Google Scholar]
- 34. Health Canada . Eating well with Canada's food guide. Ottawa (Ontario): Health Canada; 2007. [Google Scholar]
- 35. Health Canada . Canada's dietary guidelines for health professionals and policy makers. Ottawa (Ontario): Health Canada; 2019. [Google Scholar]
- 36. Health Canada . Licensed natural health products database 2018. [Internet]. Ottawa (Ontario): Health Canada; 2018; [cited July 2020]. Available from: https://health-products.canada.ca/lnhpd-bdpsnh/index-eng.jsp. [Google Scholar]
- 37. CDC . VDSCP: Vitamin D Standardization-Certification Program. [Internet]. Atlanta (GA): CDC; 2017; [cited July 2020]. Available from: https://www.cdc.gov/labstandards/vdscp.html. [Google Scholar]
- 38. Chandonnet N, Saey D, Almeras N, Marc I. French Pregnancy Physical Activity Questionnaire compared with an accelerometer cut point to classify physical activity among pregnant obese women. PLoS One. 2012;7:e38818. [DOI] [PMC free article] [PubMed] [Google Scholar]
- 39. Chasan-Taber L, Schmidt MD, Roberts DE, Hosmer D, Markenson G, Freedson PS. Development and validation of a pregnancy physical activity questionnaire. Med Sci Sports Exerc. 2004;36:1750–60. [DOI] [PubMed] [Google Scholar]
- 40. Ainy E, Ghazi AAM, Azizi F. Changes in calcium, 25(OH) vitamin D3 and other biochemical factors during pregnancy. J Endocrinol Invest. 2006;29:303–7. [DOI] [PubMed] [Google Scholar]
- 41. Bartoszewicz Z, Kondracka A, Krasnodębska-Kiljańska M, Niedźwiedzka B, Popow M, Ambroziak U, Bednarczuk T. Vitamin D insufficiency in healthy pregnant women living in Warsaw. Ginekol Pol. 2013;84:363–7. [DOI] [PubMed] [Google Scholar]
- 42. Charatcharoenwitthaya N, Nanthakomon T, Somprasit C, Chanthasenanont A, Chailurkit L-o, Pattaraarchachai J, Ongphiphadhanakul B. Maternal vitamin D status, its associated factors and the course of pregnancy in Thai women. Clin Endocrinol. 2013;78:126–33. [DOI] [PubMed] [Google Scholar]
- 43. Figueiredo ACC, Cocate PG, Adegboye ARA, Franco-Sena AB, Farias DR, de Castro MBT, Brito A, Allen LH, Mokhtar RR, Holick MFet al. Changes in plasma concentrations of 25-hydroxyvitamin D and 1,25-dihydroxyvitamin D during pregnancy: a Brazilian cohort. Eur J Nutr. 2018;57:1059–72. [DOI] [PubMed] [Google Scholar]
- 44. Francis EC, Hinkle SN, Song Y, Rawal S, Donnelly SR, Zhu Y, Chen L, Zhang C. Longitudinal maternal vitamin D status during pregnancy is associated with neonatal anthropometric measures. Nutrients. 2018;10:1631. [DOI] [PMC free article] [PubMed] [Google Scholar]
- 45. O'Riordan MN, Kiely M, Higgins JR, Cashman KD. Prevalence of suboptimal vitamin D status during pregnancy. Ir Med J. 2008;101:240, 242–3. [PubMed] [Google Scholar]
- 46. Park S, Yoon H-K, Ryu H-M, Han YJ, Lee SW, Park BK, Park S-Y, Yim C-H, Kim S-H. Maternal vitamin D deficiency in early pregnancy is not associated with gestational diabetes mellitus development or pregnancy outcomes in Korean pregnant women in a prospective study. J Nutr Sci Vitaminol. 2014;60:269–75. [DOI] [PubMed] [Google Scholar]
- 47. Shen Y, Pu L, Si S, Xin X, Mo M, Shao B, Wu J, Huang M, Wang S, Muyiduli Xet al. Vitamin D nutrient status during pregnancy and its influencing factors. Clin Nutr. 2020;39:1432–9. [DOI] [PubMed] [Google Scholar]
- 48. Zasimovich A, Fijałkowska A, Chełchowska M, Maciejewski T. Maternal serum vitamin D and parathormone concentrations during gestation and in umbilical cord blood – pilot study. J Matern Fetal Neonatal Med. 2018;31:158–63. [DOI] [PubMed] [Google Scholar]
- 49. Kovacs CS, Kronenberg HM. Maternal-fetal calcium and bone metabolism during pregnancy, puerperium, and lactation. Endocr Rev. 1997;18:832–72. [DOI] [PubMed] [Google Scholar]
- 50. Statistics Canada . Health fact sheets. Overweight and obese adults, 2018. [Internet]. Ottawa (Ontario): Statistics Canada; 2019; [cited January 2021]. Available from: https://www150.statcan.gc.ca/n1/pub/82-625-x/2019001/article/00005-eng.htm. [Google Scholar]
- 51. Andersen LB, Abrahamsen B, Dalgård C, Kyhl HB, Beck-Nielsen SS, Frost-Nielsen M, Jørgensen JS, Barington T, Christesen HT. Parity and tanned white skin as novel predictors of vitamin D status in early pregnancy: a population-based cohort study. Clin Endocrinol. 2013;79:333–41. [DOI] [PubMed] [Google Scholar]
- 52. Bodnar LM, Catov JM, Roberts JM, Simhan HN. Prepregnancy obesity predicts poor vitamin D status in mothers and their neonates. J Nutr. 2007;137:2437–42. [DOI] [PMC free article] [PubMed] [Google Scholar]
- 53. Vitner D, Harris K, Maxwell C, Farine D. Obesity in pregnancy: a comparison of four national guidelines. J Matern Fetal Neonatal Med. 2019;32:2580–90. [DOI] [PubMed] [Google Scholar]
- 54. Public Health Agency of Canada . What mothers say: the Canadian Maternity Experiences Survey. [Internet]. Ottawa (Ontario): Public Health Agency of Canada; 2009; [cited September 2020]. Available from: http://www.publichealth.gc.ca/mes. [Google Scholar]
- 55. O'Callaghan KM, Hennessy A, Hull GLJ, Healy K, Ritz C, Kenny LC, Cashman KD, Kiely ME. Estimation of the maternal vitamin D intake that maintains circulating 25-hydroxyvitamin D in late gestation at a concentration sufficient to keep umbilical cord sera ≥25–30 nmol/L: a dose-response, double-blind, randomized placebo-controlled trial in pregnant women at northern latitude. Am J Clin Nutr. 2018;108:77–91. [DOI] [PMC free article] [PubMed] [Google Scholar]
- 56. Palacios C, Trak-Fellermeier MA, Martinez RX, Lopez-Perez L, Lips P, Salisi JA, John JC, Peña-Rosas JP. Regimens of vitamin D supplementation for women during pregnancy. Cochrane Database Syst Rev. 2019;10:CD013446. [DOI] [PMC free article] [PubMed] [Google Scholar]
- 57. Shin D, Chung H, Weatherspoon L, Song WO. Validity of prepregnancy weight status estimated from self-reported height and weight. Matern Child Health J. 2014;18:1667–74. [DOI] [PubMed] [Google Scholar]
Associated Data
This section collects any data citations, data availability statements, or supplementary materials included in this article.