

ABSTRACT
Background
Anemia is a global public health problem that undermines childhood development. India provides government-sponsored integrated nutrition/child development preschools.
Objectives
This double-masked, cluster-randomized controlled trial examines whether point-of-use multiple micronutrient powder (MNP) compared with placebo fortification of preschool meals impacts child development and whether effects vary by preschool quality (primary outcome) and biomarkers of anemia and micronutrients (secondary outcomes). We also measured growth and morbidity.
Methods
We randomly assigned 22 preschools in rural India to receive MNP/placebo fortification. We administered baseline and endline blood sampling and measures of childhood development (Mullen Scales of Early Learning, inhibitory control, social–emotional), anthropometry, and morbidity to preschoolers (aged 29–49 mo). Preschools added MNP/placebo to meals 6 d/wk for 8 mo. We conducted linear mixed-effects regression models accounting for preschool clustering and repeated measures. We evaluated child development, examining effects in high- compared with low-quality preschools using the Early Childhood Environment Rating Scale–Revised and the Home Observation for the Measurement of the Environment Inventory, modified for preschools.
Results
At baseline, mean age ± SD was 36.6 ± 5.7 mo, with 47.8% anemic, 41.9% stunted, and 20.0% wasted. Baseline expressive/receptive language scores were higher in high-quality compared with low-quality preschools (P = 0.02 and P = 0.03, respectively). At endline (91% retention, n = 293/321), we found MNP compared with placebo effects in expressive language (Cohen's standardized effect d = 0.4), inhibitory control (d = 0.2), and social–emotional (d = 0.3) in low-quality, not high-quality, preschools. MNP had significantly greater reduction of anemia and iron deficiency compared with placebo (37% compared with 13.5% and 41% compared with 1.2%, respectively). There were no effects on growth or morbidity.
Conclusions
Providing multiple micronutrient-fortified meals in government-sponsored preschools is feasible; reduced anemia and iron deficiency; and, in low-quality preschools, increased preschoolers’ expressive language and inhibitory control and reduced developmental disparities. Improving overall preschool quality by incorporating multiple components of nurturing care (responsive care, learning, and nutrition) may be necessary to enhance preschoolers’ development. This trial was registered at clinicaltrials.gov as NCT01660958.
Keywords: anemia, iron deficiency, preschool, child development, multiple micronutrient powders, India
See corresponding commentary on page 1684.
Introduction
Iron deficiency and anemia are major public health problems that undermine childhood development and are disproportionally concentrated in low- and middle-income countries (LMICs) (1). Ensuring nutritional adequacy during the first 1000 d (conception to 24 mo) is a primary strategy to prevent iron deficiency and anemia and also to promote early childhood development (2). Although the burdens of iron deficiency, anemia, and developmental risk remain high during the second 1000 d (preschool: ages 2–5 y), limited attention has addressed this period (3, 4).
Deficiencies of iron and other micronutrients may impact early brain development through disruptions to dopaminergic functions, including myelination and monamine neurotransmission and the structure and function of the hippocampus and the prefrontal cortex (5). These early disruptions to brain structure and function may adversely impact children's cognitive development, as has been shown in both animal and human studies (5). Observational studies have demonstrated negative associations between iron deficiency and children's cognitive development, with inconsistent results from intervention trials (6). Recommendations are for high-quality, placebo-controlled trials to examine children's development (6).
Anemia in the preschool period can disrupt social interactions through children's hesitancy to play and interact (7, 8), and severe anemia has been associated with delays in cognitive development (9). An estimated 42% of anemia among young children (aged <5 y) is iron deficiency anemia (IDA), although anemia can also be caused by deficiencies of other nutrients, including vitamin B-12, vitamin A, folate, and zinc (10–12), suggesting that multiple micronutrient (MMN) interventions may be effective in reducing anemia and micronutrient deficiencies.
An increasingly common approach to providing MMN is through point-of-use fortification with multiple micronutrient powders (MNPs). This approach is recommended by WHO for children (aged 2–12 y) where anemia prevalence exceeds 20% (13). Among children aged <6 y in LMICs, iron-containing MMN interventions have reduced anemia and increased hemoglobin (Hb), with inconsistent impact on growth, morbidity, and cognition (14–16). Evidence on introducing MNP in preschools and the impact on anemia and cognition are limited (17, 18).
Both nutrition and early learning/responsive caregiving interventions have been effective in promoting early childhood development (19), with meta-analyses showing larger effects for caregiving than for nutrition (20–22). Recommendations are to provide integrated interventions (both nutrition and early learning/responsive caregiving) and to use a bioecological framework that incorporates children's nutritional status as well as their caregiving environment, including the family and preschool (23).
India's prevalence of childhood anemia is among the highest in the world, associated with poverty, food insecurity, and a diet low in bioavailable iron and zinc (24). India has a long history of providing integrated nutrition and child development services through the government-sponsored Integrated Child Development Services (ICDS) with preschools (Anganwadi centers) throughout the country. Children attend from 09:00 to 14:00–16:00, participate in a structured teacher-delivered curriculum, and receive a midday meal prepared by an aide. Evaluations of ICDS preschools have shown beneficial effects of improved quality (e.g., indoor/outdoor space and teacher–student interactions) on academic performance (25, 26). This double-masked trial delivers MNP compared with placebo meal fortification in preschools and tests 2 hypotheses: 1) The impact of MNP meal fortification on childhood development (primary outcome) varies by preschool quality and 2) MNP meal fortification positively impacts biomarkers of anemia/micronutrients (secondary outcomes). We also measured children's growth and morbidity, but we did not hypothesize changes.
Methods
Study design
Project Grow Smart includes a home-based intervention for infants and a preschool intervention for children aged 3–5 y (the focus of this study). The preschool phase, conducted prior to the infant phase, examined whether the impact of MNP meal fortification on childhood development varied by preschool quality. The infant phase examined whether the impact of parent-delivered MNP varied by home visiting-delivered early childhood intervention. Both phases evaluated biomarkers of anemia/micronutrients and measured children's growth and morbidity (24).
Preschools were randomly assigned to MNP or placebo powders in a cluster-randomized, double-masked, controlled trial. Information about protocol development, MNP/placebo formulation, formative and pilot studies, and ethical approvals has been reported elsewhere (27) (clinicaltrials.gov NCT01660958). We obtained ethical approval from the Institutional Ethical Committee of the National Institute of Nutrition (NIN) and the Institutional Review Board of the University of Maryland School of Medicine.
The original study design was altered to adhere to the academic term (September–May). After the 1-mo May break, many of the oldest children transfer to private or primary schools. To avoid participant loss, the preschool intervention, originally intended for 12 mo with 3 evaluation points, was shortened to 8 mo. We eliminated the midline evaluation and conducted the endline assessments prior to May. Enrollment was conducted from January through July 2012.
Sample size
We determined the sample size for the evaluation of the primary outcome, childhood development, to examine whether the intervention (MNP compared with placebo) varied by preschool quality (high compared with Low quality) within a cluster-randomized controlled trial (28). Assuming an average preschool size of 15 children, a moderate effect size on childhood development (0.5 SD) using 2-sided tests (α = 0.05, 80% power), with retention of 85%, intraclass correlation (ICC) of 0.03, and repeated measures correlation of 0.4, requires a sample size of 76/group clustered in 22 preschools, or 304 children.
For the secondary outcomes (biomarkers of anemia and micronutrients), and growth and morbidity, we used a 2-cell design, pooling data across high- and low-quality preschools. We conducted a posterior power analysis (the effect size and power given the sample size) using Stata SAMPSI for repeated measures. For Hb, correlation of repeated measures is 0.7, yielding a sample size of 92/group. For growth, correlation of repeated measures is 0.97, yielding a sample size of 107/group. For morbidity, based on the average incidence of acute respiratory infections (ARIs) of 8.0 episodes/child-year (3.2 SD), a 20% reduction in ARI incidence (α = 0.05, power 80%) requires a sample size of 64/group. With a design effect of 1.5 and 15% attrition, the final sample required for secondary outcomes is 107/group.
Site, preschool quality, and randomization
We selected a rural district in the state of Telangana because children's prevalence of anemia exceeded 70%; >50% of children consumed <50% of recommended intake of many essential micronutrients (29, 30), and preschools were not receiving micronutrient supplements or fortified foods. Eligibility criteria included enrollment of ≥15 children/preschool and agreement to add fortification to the midday meal.
We evaluated 46 preschools located in 26 villages; 10 did not meet eligibility criteria. Using a computer-generated randomization procedure, the biostatistician selected 22 preschools; all agreed to participate (Figure 1). The biostatistician used a second computer-generated procedure to separate the 22 preschools into MNP and placebo. Classifications were unknown by investigators, outcome assessors, preschool staff, and parents.
FIGURE 1.

CONSORT diagram—preschool phase. CONSORT, Consolidated Standards of Reporting Trials.
For the analysis of childhood development, we considered preschool quality. As previously reported (27), we combined 2 validated scales—the Early Childhood Environment Rating Scale–Revised (31) and the Home Observation for the Measurement of the Environment (HOME) Inventory (32)—to construct an observational scale. The HOME Inventory was modified to refer to teachers in preschools rather than parents at home. The 109 items assessed structural aspects (e.g., indoor and outdoor play space), learning opportunities (e.g., provision of appropriate play and learning material), organization (e.g., organization of environment), teacher–child interactions (e.g., teacher's emotional and verbal responsiveness and involvement with children's activities), and practices (e.g., opportunities for variety in daily stimulation). After training and establishing ICCs >0.80, 2 psychologists spent 4 h in each preschool and independently completed the observation. Scores were summed and averaged.
The biostatistician used a median split to categorize preschools into high compared with low quality. Preschool quality was nested within MNP/placebo preschools. Classifications of quality were unknown by investigators, outcome assessors, preschool staff, and parents.
Recruitment
Research staff recruited parents of children aged 29–49 mo from preschools. Exclusion criterion was intention to move from the area. All families chose mothers as the primary respondent. Exclusion criteria for children were chronic morbidity, severe anemia (Hb <7 g/dL), and physical disabilities or developmental delays that interfered with performance on standardized developmental assessments. We evaluated 336 mothers and children for eligibility: 1 refused, 9 left the preschool, and 5 children with severe anemia were referred to a local hospital for evaluation and treatment, leaving an enrollment sample of 321. Mothers provided written informed consent for themselves and their preschooler; provisions were made for mothers who could not read or write.
MNPs and placebo masking
The MNP formulation was informed by WHO and Indian recommendations regarding MNP and age-specific nutrient requirements (27). It included 13 mg iron (encapsulated ferrous fumarate), 5 mg zinc, 20 μg folic acid, 150 μg vitamin A, 20 mg vitamin C, 0.5 μg vitamin B-12, and 0.5 mg riboflavin. The placebo contained 0.5 mg riboflavin, which has no known effects on the outcome measures. The manufacturer provided initial stability testing, and NIN conducted ongoing stability testing. Overages (5–30%) were added for each nutrient. The MNP/placebo was supplied in identical packets of 200 g, including 2 measuring spoons of 1 and 5 g and a manufacturer-assigned alphabetic code to differentiate MNP from placebo.
Intervention
Preschools operate 6 d/wk (excluding Sundays and holidays). ICDS provides 300 g of cooked food/child for the midday meal—either upma (broken wheat) or kichidi (rice and green gram dhal). Both are cooked soft with oil and spices. To ensure complete consumption of the MNP/placebo, we trained teachers and aides to measure and mix the MNP/placebo in a small portion of food (100–125 g/child) using spoons provided. Detailed instructions were printed on the packet in the local language (Telugu). Training was complete when workers correctly measured amounts of food and MNP/placebo for 5 groups of children. The fortified portion was served first (“first bite”); on completion, children received the remaining unfortified portion. Preschool workers recorded each child's daily consumption as 1 for ≥50% of the fortified portion consumed and as 0 for <50% consumed. Adherence was calculated by attendance and average daily consumption. Quality assurance was conducted by weekly monitoring visits to review procedures, collect attendance and meal consumption records, and supply fortification packets, ensuring that preschools had a spare sealed packet.
Assessments
We conducted assessments at the preschool or at a local community center; HOME Inventory was conducted at the family home. We conducted baseline assessments following enrollment, prior to randomization and initiation of the intervention. We conducted endline assessments 8 mo after baseline. Standardized protocols and procedures are reported elsewhere (27).
Childhood development
Childhood development refers to performance on an ordinal sequence of age-related skills, including gross and fine motor development, communication, problem-solving, memory, social–emotional development, and impulse inhibition. Children are asked to perform a series of age-standardized tasks. We included measures of inhibitory control (33) and social–emotional behavior (34) based on findings linking iron status to these outcomes (35, 36). Instructions were translated into Telugu. Materials were altered to include local items, following adaptation guidelines, and pretested during a pilot phase (27). For each test, high scores are optimal.
Training
We trained 5 master's-level psychologists to administer the assessments during an 8-wk, 3-phase training period—consensus building, establishing ICCs >0.80, and quality control—as reported previously (27). Pilot tests were conducted prior to baseline, with weekly supervision and boosters throughout the trial.
Mullen scales
The Mullen Scales of Early Learning (MSEL) (37) measures skills in 5 areas: fine motor (drawing), gross motor (jumping), visual reception (pegboard), receptive language (pointing to named pictures), and expressive language (naming pictures) (37). MSEL is a well-validated, individually administered test that covers birth to 68 mo, has excellent psychometric properties, and has been used successfully in LMICs in Asia, Africa, and Latin America (38–40). Raw scores were converted to age-standardized T scores (mean ± SD = 50 ± 10).
Inhibitory control tests the ability to follow instructions by inhibiting responses along two domains (size and color) as instructions switch (33) (pick up small black pieces; pick up large white pieces). The ability to inhibit a previous response is sensitive to iron deficiency (35). Success/failure raw scores were recorded, summed, and adjusted for mean-centered score.
Social–emotional behavior is measured by the Behavior Observation Inventory of the Bayley Scales of Infant and Toddler Development, Version III. Parents rate the typicality of their child's everyday social–emotional behaviors, such as following directions and getting along with others. Raw scores were adjusted for mean-centered scores.
Biomarkers and inflammation
A trained phlebotomist collected 2 mL of nonfasting blood from the ante cubital vein between 10:00 and 12:00 into heparinized vacutainers. Blood was transported in thermally insulated boxes with ice to NIN; plasma was separated and stored in aliquots at –20°C. Procedures for collection and analyses of blood samples have been reported previously and are reviewed briefly below (41).
Hemoglobin analysis was done in whole blood, on the same day of blood collection, using a commercial kit (HemoCor-D; Coral Clinical Systems). We used an in-house sandwich ELISA to measure serum ferritin concentrations; details are provided elsewhere (41). Soluble transferrin receptor (sTfR) was analyzed using a sandwich ELISA kit with a minimum detectable dose of 0·5 nmol/L (R&D Systems) and C-reactive protein (CRP) using a human CRP assay kit (Alpha Diagnostic) with a minimum detectable limit of 10 ng/mL and assay range of 100–10,000 ng/mL. Folate and vitamin B-12 were analyzed using a competitive protein-binding dual RIA kit (Siemens). Plasma zinc was analyzed using atomic absorption spectrophotometry (AA7000 series; Shimadzu) by using flame atomic absorption with fetal bovine serum as external quality control. Definitions of anemia, iron deficiency, and micronutrient deficiencies and explanations of cutoffs are reported elsewhere (41). For correction of inflammation-related changes in serum ferritin concentrations, a factor of 0.67 was used with a corresponding CRP >5 mg/L (42).
Anthropometry
Weight and height of mothers and preschoolers and midupper arm circumference (MUAC) for preschoolers were measured by 2 trained anthropometrists, following a standardized protocol (27). Weight was measured using a calibrated digital scale to 0.1 kg (Seca). Height was measured using a portable stadiometer to 0.1 cm (Galaxy Scientific). Height was measured twice and repeated until 2 measurements agreed within 0.2 cm. MUAC was measured using nonstretchable measuring tape precise to 0.2 cm. Weight-for-age, BMI-for-age, height-for-age, and MUAC were converted to z scores (WAZ, BAZ, HAZ, and MUACZ, respectively) using WHO standards. Underweight, wasting, and stunting were defined as <–2 WAZ, BAZ, and HAZ, respectively.
Morbidity
The morbidity questionnaire, based on the Demographic and Health Survey, was administered at baseline and monthly for 8 mo through household surveillance. Mothers recalled symptoms of fever, vomiting, diarrhea, and cough with short, rapid breaths or difficulty breathing during the past 15 d. A study physician was consulted when necessary. Diarrhea episodes and ARI episodes were calculated. There were no adverse events.
Control variables
Demographic characteristics
Mothers provided information on family characteristics, including household composition, maternal and paternal age, years of schooling, occupation(s), and marital status. Questions were adapted from UNICEF's Multiple Indicator Cluster Surveys and prior questionnaires administered in this population (30). Mothers reported the number of years of schooling completed; classified as no schooling, primary (grades 1–5), or secondary (beyond grade 5).
Home Inventory
The HOME Inventory is an observation of the home environment quality (32). We used the Early Childhood version of the HOME scale, modified for India (43), revised by removing or modifying items that were not culturally appropriate, and translating instructions to Telugu. Scores were summed; high scores indicate higher quality.
Household assets
Economic resources were defined by a systematic, India-developed questionnaire on family ownership of household assets (44). Scores, weighted by the relative significance of ownership, ranged from –0.2 to 8.3; high scores indicate more assets.
Household food insecurity
The Household Food Insecurity Access Scale (45) is a 9-item universal measure of household food insecurity, defined by endorsement of >1 item. The scale has been used globally and in India, and it is associated with poverty and low parental education (45).
Statistical analysis
For the primary outcome, childhood development, we conducted an intent-to-treat analysis using linear mixed-effects regression models with random preschool and subject intercepts accounting for the clustered design and baseline scores. We used 3-way (endline × intervention × quality) and 2-way (endline × intervention and endline × quality) interaction terms to test for endline differences; results were stratified by quality (high compared with low). Because residuals did not depart from normality, no continuous outcomes were transformed. We calculated effect sizes using Cohen's d, difference in change scores from baseline to endline comparing intervention groups, with 0.20, 0.50, and 0.80 interpreted as small, medium, and large, respectively (46).
For the analyses on biomarkers and growth, we conducted an intent-to-treat analysis using linear mixed-effects regression models with random preschool and subject intercepts accounting for the clustered design, adjusting for baseline. We used chi-square tests (or Fisher's exact test, where appropriate) to compare the prevalence of anemia and micronutrient deficiencies between MNP and placebo or between baseline and endline. To analyze morbidity, we fitted generalized linear mixed-effects models. Analyses were conducted using SPSS version 19.0 and SAS version 9.3 (SAS Institute), with significance at P < 0.05.
Results
The sample included 321 children from 22 preschools. There were no significant baseline differences in family socioeconomic status, number of household members, household food security, HOME Inventory scores, maternal age, education, or marital status, nor were there significant differences in child age, gender, micronutrient status, or anthropometric measures based on preschool quality or intervention group (Table 1).
TABLE 1.
Baseline household, mother, and child characteristics by intervention group and preschool quality among children attending 22 preschools (n = 321)1
| MNP preschools | Placebo preschools | |||||
|---|---|---|---|---|---|---|
| High quality (n = 93) | Low quality (n = 77) | High quality (n = 65) | Low quality (n = 86) | MNP group difference2 | Quality group difference3 | |
| Household | ||||||
| Food insecurity, n (%) | 13 (14.0) | 14 (18.2) | 13 (20.0) | 7 (8.1) | 0.40 | 0.21 |
| Household assets, n | 3.0 ± 0.2 | 3.1 ± 0.2 | 3.2 ± 0.2 | 2.9 ± 0.2 | 0.83 | 0.71 |
| HOME Inventory score | 25.5 ± 1.2 | 23.4 ± 1.3 | 26.3 ± 1.4 | 26.1 ± 1.3 | 0.20 | 0.39 |
| Mother | ||||||
| Age, y | 24.6 ± 0.3 | 25.2 ± 0.4 | 25.6 ± 0.4 | 24.7 ± 0.4 | 0.51 | 0.71 |
| Married, n (%) | 91 (97.8) | 76 (98.7) | 65 (100) | 86 (100) | 0.10 | 0.55 |
| BMI, kg/m2 | 20.0 ± 4.1 | 20.4 ± 4.6 | 20.6 ± 4.9 | 19.5 ± 3.1 | 0.66 | 0.51 |
| No schooling, n (%) | 29 (31.2) | 20 (26.0) | 15 (23.1) | 24 (28.2) | 0.54 | 0.98 |
| Child | ||||||
| Age, mo | 37.4 ± 5.1 | 37.5 ± 5.6 | 36.9 ± 4.0 | 36.3 ± 4.6 | 0.38 | 0.67 |
| Male sex, n (%) | 40 (43.0) | 39 (50.6) | 34 (52.3) | 42 (48.8) | 0.44 | 0.76 |
| WAZ | –1.9 ± 0.1 | –1.9 ± 0.1 | –1.9 ± 0.1 | –2.1 ± 0.1 | 0.37 | 0.20 |
| HAZ | –1.6 ± 0.1 | –1.8 ± 0.1 | −1.9 ± 0.1 | –1.9 ± 0.1 | 0.25 | 0.52 |
| BAZ | –1.2 ± 0.1 | –1.1 ± 0.1 | –1.0 ± 0.1 | –1.3 ± 0.1 | 0.91 | 0.23 |
| MUACZ | –1.2 ± 0.1 | –1.3 ± 0.1 | –1.2 ± 0.1 | –1.4 ± 0.1 | 0.93 | 0.31 |
| Stunted, n (%) | 36 (38.7) | 31 (40.8) | 28 (43.1) | 35 (40.7) | 0.73 | 0.98 |
| Underweight, n (%) | 39 (41.9) | 32 (42.1) | 31 (47.7) | 46 (53.5) | 0.11 | 0.58 |
| Wasted, n (%) | 19 (20.4) | 15 (19.7) | 11 (16.9) | 19 (22.1) | 0.95 | 0.65 |
Characteristic values are means ± SDs unless otherwise indicated. BAZ, BMI-for-age z score; HAZ, height-for-age z score; HOME, Home Observation for the Measurement of the Environment Inventory; MNP, multiple micronutrient powder; MUACZ, midupper arm circumference z score; WAZ, weight-for-age z score.
Statistical difference (P value) in characteristic between MNP and placebo group.
Statistical difference (P value) in characteristic between high and low preschool quality.
The mean ± SD age of mothers was 25.0 ± 3.3 y, and 99% were married. Most mothers (73%) had attended formal schooling. Mean ± SD maternal BMI (in kg/m2) was 22.2 ± 4.4; 43% had BMI <18.5. Mean ± SD preschooler age was 36.6 ± 5.7 mo; 47.6% were boys. Anemia prevalence was 47.8%; 41.1% were stunted, 46.1% underweight, and 20.0% wasted. At endline, 293/321 children (91%) were retained (Figure 1), with no retention differences by baseline characteristics, preschool quality, or intervention group (data not shown).
Adherence
Fortified meals were offered for 8 mo (184 d). Preschool attendance ranged from 20 to 178 d and did not vary significantly by preschool quality or intervention group. High-quality and low-quality centers had mean ± SD attendance of 140.7 ± 6.9 and 134.6 ± 6.9 d, respectively. MNP/placebo groups had mean ± SD attendance of 139.2 ± 6.9 and 136.2 ± 7.0 d, respectively.
Consumption did not vary by preschool quality or intervention group. High-quality and low-quality centers had mean ± SD daily consumption of 140.2 ± 7.0 and 131.9 ± 7.0 d, respectively. Consumption of the fortified meal on attendance days did not vary between MNP (mean ± SD: 137.1 ± 7.0 d) and placebo (mean ± SD: 135.0 ± 7.0 d).
Child development
At baseline, children in high-quality preschools had higher mean scores compared with children in low-quality preschools in expressive language (mean ± SE: 40.6 ± 1.1 compared with 37.4 ± 1.1, respectively; P = 0.02) and receptive language (mean ± SE: 43.3 ± 0.8 compared with 41.2 ± 0.8, respectively; P = 0.03), with no difference in other MSEL scales, inhibitory control or social–emotional behavior, or by intervention group. The pattern of changes from baseline to endline differed by fortification group (MNP compared with placebo), as illustrated by significant 2- and 3-way interactions between fortification group and preschool quality (Table 2).
TABLE 2.
Measures of child development by preschool quality, in preschoolers administered MNP or placebo from baseline to endline (8 mo)1
| Time effects (P values) | ||||||||||||||
|---|---|---|---|---|---|---|---|---|---|---|---|---|---|---|
| High-quality preschools | Effect size | Low-quality preschools | Effect size | Baseline preschool | Endline × | Endline × | Endline × MNP × | |||||||
| ∆2 | n | MNP | Placebo | P 3 | (95% CI) | MNP | Placebo | P 3 | (95% CI)4 | quality | MNP | quality | quality | |
| Expressive language score5 | BL | 321 | 41.6 ± 1.2 | 40.1 ± 1.4 | 0.34 | 38.2 ± 1.3 | 36.8 ± 1.3 | 0.34 | 0.02 | |||||
| EL | 293 | 40.5 ± 1.4 | 40.8 ± 1.6 | 0.89 | 40.2 ± 1.5 | 34.4 ± 1.4 | 0.003 | 0.02 | 0.11 | 0.01 | ||||
| ∆ | –1.0 ± 1.2 | 0.6 ± 1.5 | 0.36 | –0.2 (–0.6, 0.2) | 2.0 ± 1.4 | –2.3 ± 1.2 | 0.02 | 0.4 (0.1, 0.8) | ||||||
| Receptive language score5 | BL | 321 | 43.7 ± 0.8 | 43.0 ± 0.9 | 0.52 | 41.5 ± 0.9 | 40.8 ± 0.8 | 0.52 | 0.03 | |||||
| EL | 293 | 37.4 ± 0.9 | 37.0 ± 1.1 | 0.74 | 34.5 ± 1.0 | 35.3 ± 0.9 | 0.57 | 0.28 | 0.70 | 0.49 | ||||
| ∆ | –6.2 ± 0.9*** | –6.1 ± 1.0*** | 0.88 | 0.0 (−0.4, 0.4) | –6.9 ± 1.0*** | –5.5 ± 0.9*** | 0.28 | –0.2 (–0.5, 0.2) | ||||||
| Fine motor score4 | BL | 321 | 46.5 ± 1.4 | 46.5 ± 1.5 | 1.00 | 44.1 ± 1.5 | 44.1 ± 1.4 | 1.00 | 0.15 | |||||
| EL | 293 | 47.8 ± 1.5 | 46.5 ± 1.5 | 0.81 | 44.5 ± 1.6 | 44.2 ± 1.5 | 0.90 | 0.89 | 0.73 | 0.92 | ||||
| ∆ | 47.3 ± 1.7 | 0.79 | 0.0 (–0.3, 0.3) | 0.4 ± 1.4 | 0.1 ± 1.3 | 0.89 | 0.0 (–0.3, 0.3) | |||||||
| Visual reception score5 | BL | 321 | 43.9 ± 1.2 | 42.3 ± 1.4 | 0.27 | 42.3 ± 1.3 | 40.6 ± 1.3 | 0.27 | 0.27 | |||||
| EL | 293 | 42.7 ± 1.3 | 42.7 ± 1.6 | 1.00 | 41.0 ± 1.5 | 40.0 ± 1.4 | 0.57 | 0.74 | 0.52 | 0.64 | ||||
| ∆ | –1.2 ± 1.1 | 0.5 ± 1.4 | 0.34 | –0.2 (–0.5, 0.2) | –1.2 ± 1.3 | –0.7 ± 1.2 | 0.74 | –0.1 (–0.4, 0.3) | ||||||
| Inhibitory control score6 | BL | 319 | 2.8 ± 0.4 | 2.3 ± 0.4 | 0.36 | 2.6 ± 0.4 | 2.2 ± 0.4 | 0.36 | 0.73 | |||||
| EL | 293 | 4.3 ± 0.4 | 5.0 ± 0.5 | 0.26 | 4.4 ± 0.5 | 3.0 ± 0.4 | 0.02 | 0.07 | 0.001 | 0.004 | ||||
| ∆ | 1.5 ± 0.4*** | 2.7 ± 0.4*** | 0.04 | –0.3 (–0.7, 0.0) | 1.8 ± 0.4*** | 0.8 ± 0.4* | 0.07 | 0.2 (–0.1, 0.6) | ||||||
| Social–emotional development score6 | BL | 321 | 24.7 ± 0.4 | 24.1 ± 0.4 | 0.19 | 23.8 ± 0.4 | 23.2 ± 0.4 | 0.19 | 0.07 | |||||
| EL | 293 | 22.8 ± 0.5 | 23.3 ± 0.6 | 0.47 | 23.3 ± 0.5 | 21.9 ± 0.5 | 0.03 | 0.26 | 0.48 | 0.04 | ||||
| ∆ | –1.9 ± 0.5** | –0.8 ± 0.6 | 0.13 | –0.3 (–0.8, 0.1) | –0.5 ± 0.6 | –1.3 ± 0.5* | 0.26 | 0.2 (–0.2, 0.6) | ||||||
Values are means ± SEs unless otherwise indicated. *P < 0.05, **P < 0.001, ***P < 0.0001. BL, baseline; EL, endline; MNP, multiple micronutrient powder.
Within-intervention group change from baseline.
P value for MNP compared with placebo difference in baseline mean, endline mean, and change from baseline.
Cohen's d for the difference in change scores from baseline to endline comparing MNP with placebo. Conventions: small = 0.2, medium = 0.5, large = 0.8 (38).
Mean T scores ± SEs, age-standardized.
Raw score, adjusted for mean-centered age.
In low-quality preschools, there were significant differences in expressive language, inhibitory control, and social–emotional scores. In expressive language, the MNP group had significantly higher endline scores than the placebo group (P = 0.003). In inhibitory control, both the MNP and placebo groups had significantly higher scores from baseline to endline (P = 0.0001 and P = 0.05, respectively); at endline, the MNP group scores were significantly higher than the placebo group scores (P = 0.02). In social–emotional behavior, scores declined slightly in the MNP and placebo groups, with significantly higher endline scores in the MNP group compared with the placebo group (P = 0.03). Figure 2 illustrates that by endline, MNP scores in expressive language in low-quality schools (Figure 2B) improved significantly and approximated scores in high-quality preschools (Figure 2A).
FIGURE 2.
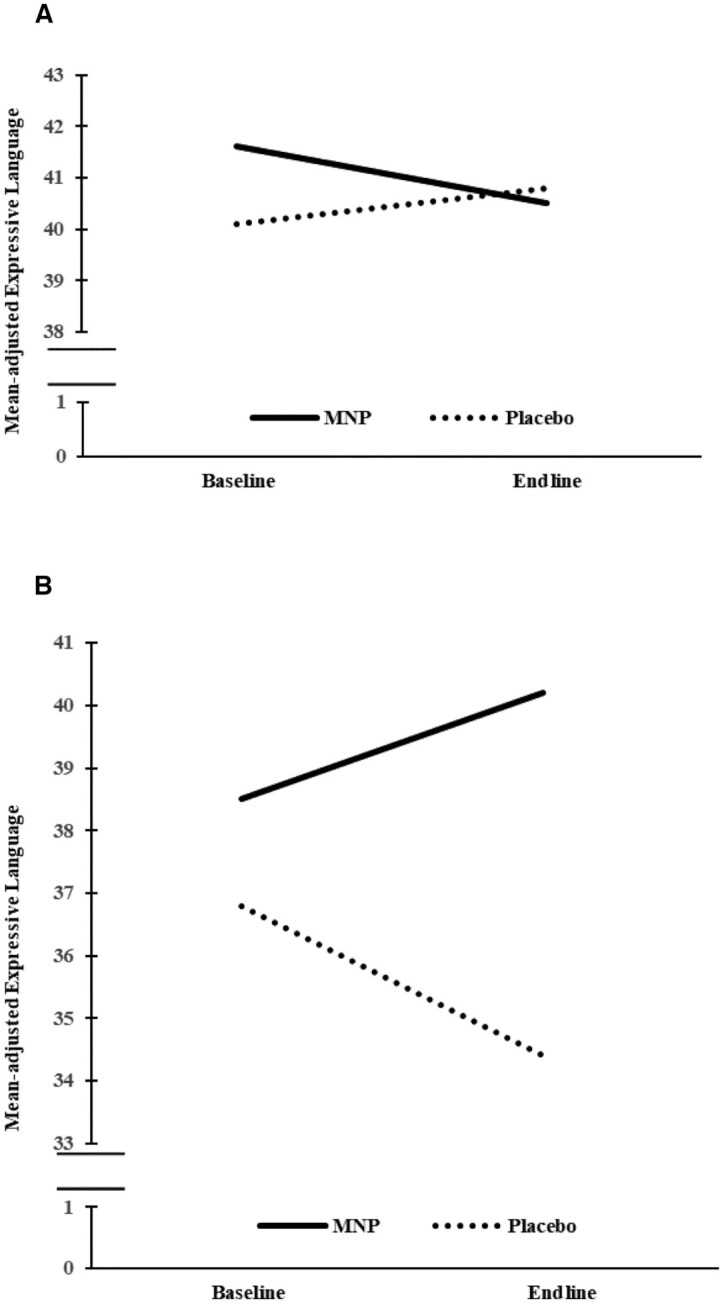
Change in expressive language score in preschoolers from high-quality (A) and low-quality (B) preschools administered MNP or placebo from baseline to endline (8 mo). In A, MNP = 93 and 84 and placebo = 65 and 59 at baseline and endline, respectively. In B, MNP = 77 and 67 and placebo = 86 and 83 at baseline and endline, respectively. Lines are adjusted means of expressive language score from linear mixed-effect regression models. MNP, multiple micronutrient powder.
In the high-quality preschools, there were no significant endline differences in any area. Scores in inhibitory control improved from baseline to endline in both the MNP and placebo groups, with no differences at endline. Across both high- and low-quality preschools, there were significant declines in receptive language across both the MNP and placebo groups from baseline to endline, with no endline differences.
Anemia, iron deficiency, and micronutrients
At baseline, there were no significant differences in Hb, micronutrient biomarkers, and CRP concentrations across intervention groups (Table 3). There were no significant differences based on biomarkers of iron (Figure 3), folic acid (4.8% MNP and 3.4% placebo), vitamin B-12 (4.7% MNP and 5.1% placebo), zinc (7.2% MNP and 14.5% placebo), or in CRP >5 mg/L (9.6% MNP and 11.4% placebo).
TABLE 3.
MNP compared with placebo mean differences on measures of hemoglobin, biomarkers of micronutrient status, and CRP in preschoolers from baseline to endline1
| MNP vs. placebo2 | Time effect (P values) Endline × MNP | ||||||
|---|---|---|---|---|---|---|---|
| n | MNP | Placebo | P 4 | Effect size (95% CI)5 | |||
| Hemoglobin, g/dL | BL | 316 | 10.9 ± 0.1 | 10.9 ± 0.1 | 0.85 | ||
| EL | 289 | 12.1 ± 0.1 | 11.2 ± 0.1 | <0.0001 | <0.0001 | ||
| ∆3 | 1.2 ± 0.1**** | 0.3 ± 0.1** | <0.0001 | 0.6 (0.4, 0.8) | |||
| Ferritin, μg/L | BL | 314 | 19.5 ± 1.3 | 15.8 ± 1.4 | 0.06 | ||
| EL | 288 | 24.6 ± 1.4 | 14.3 ± 1.5 | <0.0001 | 0.0004 | ||
| ∆ | 5.1 ± 1.3*** | –1.5 ± 1.3 | 0.0004 | 0.3 (0.1, 0.6) | |||
| sTfR, mg/L | BL | 299 | 3.3 ± 0.1 | 3.4 ± 0.1 | 0.38 | ||
| EL | 287 | 2.3 ± 0.1 | 3.3 ± 0.1 | <0.0001 | <0.0001 | ||
| ∆ | –1.0 ± 0.1**** | –0.1 ± 0.1* | <0.0001 | 0.6 (0.4, 0.7) | |||
| sTfR/log ferritin index, mg/μg | BL | 299 | 3.4 ± 0.2 | 3.5 ± 0.2 | 0.66 | ||
| EL | 287 | 1.8 ± 0.2 | 3.3 ± 0.2 | <0.0001 | <0.0001 | ||
| ∆ | –1.6 ± 0.1**** | –0.2 ± 0.1 | <0.0001 | 0.7 (0.5, 0.9) | |||
| Folate, nmol/L | BL | 314 | 5.4 ± 0.2 | 5.1 ± 0.2 | 0.19 | ||
| EL | 287 | 7.0 ± 0.2 | 6.1 ± 0.2 | 0.002 | 0.09 | ||
| ∆ | 1.6 ± 0.2**** | 1.0 ± 0.2**** | 0.09 | 0.3 (0.0, 0.5) | |||
| Vitamin B-12, pmol/L | BL | 314 | 448.6 ± 18.8 | 411.1 ± 19.8 | 0.17 | ||
| EL | 287 | 492.6 ± 19.8 | 443.1 ± 20.3 | 0.08 | 0.72 | ||
| ∆ | 44.0 ± 22.9 | 32.0 ± 23.6 | 0.72 | 0.0 (–0.4, 0.2) | |||
| Zinc, μmol/L | BL | 307 | 14.3 ± 0.6 | 13.4 ± 0.7 | 0.35 | ||
| EL | 289 | 14.3 ± 0.6 | 13.9 ± 0.7 | 0.68 | 0.35 | ||
| ∆ | 0.0 ± 0.3 | 0.5 ± 0.4 | 0.35 | –0.1 (–0.4, 0.2) | |||
| CRP, mg/L | BL | 303 | 1.9 ± 0.2 | 1.8 ± 0.2 | 0.83 | ||
| EL | 287 | 1.2 ± 0.2 | 1.1 ± 0.2 | 0.88 | 0.96 | ||
| ∆ | –0.7 ± 0.3* | –0.7 ± 0.3* | 0.96 | 0.0 (–0.3, 0.3) | |||
Values are means ± SEs unless otherwise indicated. Linear mixed-effects regression models with random preschool and subject intercepts fitted for each outcome. *P < 0.05, **P < 0.01, ***P < 0.001, ****P < 0.0001. BL, baseline; CRP, C-reactive protein; EL, endline; MNP, multiple micronutrient powder; sTfR, soluble transferrin receptor.
No evidence of differing MNP compared with placebo effects on biochemical values by preschool quality; pooled analysis results presented.
Within-intervention group change from baseline.
P value for MNP compared with placebo difference in baseline mean, endline mean, and change from baseline.
Cohen's d for the difference in change scores from baseline to endline comparing MNP with placebo. Conventions: small = 0.2, medium = 0.5, large = 0.8 (38).
FIGURE 3.

Prevalence of anemia, ferritin deficiency (<12 μg/L), sTfR deficiency (>2.5 mg/L), STfR/log ferritin deficiency (≥1.9 mg/μg), and iron deficiency (low ferritin and/or high sTfR regardless of anemia status) at baseline and endline in preschoolers who received MNP or placebo. Prevalence of anemia (means ± SEs): MNP = 46.7 ± 7.6% (n = 167) and 10.1 ± 4.9% (n = 148), placebo = 49.0 ± 8.0% (n = 149) and 35.5 ± 7.9% (n = 141) at baseline and endline, respectively. Prevalence of ferritin deficiency (means ± SEs): MNP = 43.1 ± 7.5% (n = 166) and 9.5 ± 4.8% (n = 147), placebo = 47.6 ± 8.1% (n = 148) and 50.3 ± 8.3% (n = 141) at baseline and endline, respectively. Prevalence of sTfR deficiency (means ± SEs): MNP = 67.3 ± 7.4% (n = 153) and 24.0 ± 6.9% (n = 147), placebo = 66.4 ± 7.7% (n = 146) and 65.3 ± 7.9% (n = 141) at baseline and endline, respectively. Prevalence of sTfR/log ferritin deficiency (means ± SEs): MNP = 62.9 ± 7.1% (n = 153) and 25.7 ± 7.4% (n = 147), placebo = 71.8 ± 7.2% (n = 146) and 73.8 ± 7.3% (n = 141) at baseline and endline, respectively. Prevalence of iron deficiency (means ± SEs): MNP = 73.0 ± 6.8% (n = 166) and 32.4 ± 7.5% (n = 148), placebo = 77.8 ± 6.7% (n = 148) and 76.6 ± 7.0% (n = 141) at baseline and endline, respectively. Chi-square test was used to compare prevalence at baseline and endline; statistically significant P values are shown. MNP, multiple micronutrient powder; sTfR, soluble transferrin receptor.
Both the MNP and placebo groups had significantly higher Hb values at endline than at baseline, with MNP group values significantly higher than placebo (P < 0.0001; effect size: d = 0.6) (Table 3). The MNP group had significantly higher values than the placebo group in ferritin (P = 0.0004; d = 0.3) and significantly lower values in sTfR (P < 0.0001; d = 0.6) and the sTfR/log ferritin index (P < 0.0001; d = 0). Both groups had significantly higher folate values compared to baseline, with a trend toward higher value in MNP compared to placebo and no significant differences in vitamin B-12, zinc status, or CRP (Table 3). The significant reductions in the prevalence of low ferritin and elevated sTfR and sTfR/log ferritin index in the MNP group resulted in a significant reduction in iron deficiency (73.0% to 32.4%) in the MNP group compared to the placebo group (77.8% to 76.6%) (Figure 3).
There were significant changes in the prevalence and distribution of anemia severity. At endline, among MNP group children with anemia (10.1%), the majority (8.1%) had mild anemia. Among placebo group children with anemia (35.5%), the majority (19.2%) had moderate anemia (Figure 4). The baseline prevalence of IDA across the total sample (42.1%) declined to 4.8% in the MNP group and 34.3% in the placebo group.
FIGURE 4.

Proportion of preschoolers without anemia (Hb >110 g/L), with mild anemia (Hb = 100–110 g/L), with moderate anemia (Hb = 70–100 g/L), and with severe anemia (Hb <70 g/L) in MNP and placebo groups at baseline and endline separately. At baseline (means ± SEs), 53.3 ± 3.9% (n = 167) and 51.0 ± 4.1% (n = 148) did not have anemia, 21.6 ± 3.2% (n = 167) and 26.2 ± 3.6% (n = 148) had mild anemia, and 25.1 ± 3.3% (n = 167) and 22.8 ± 3.4% (n = 148) had moderate anemia in MNP and placebo, respectively; there were no preschoolers with severe anemia. At endline, 89.9 ± 4.8% (n = 148) and 64.5 ± 7.9% (n = 141) did not have anemia, 8.1 ± 4.4% (n = 148) and 15.6 ± 6.0% (n = 141) had mild anemia, 2.0 ± 2.3% (n = 148) and 19.2 ± 6.5% (n = 141) had moderate anemia, and 0 ± 0% (n = 148) and 0.7 ± 1.4% (n = 141) had severe anemia in MNP and placebo, respectively. Fisher's exact test was used to compare anemia severity in MNP and placebo groups at baseline and endline separately. Significant P value at endline is shown. Hb, hemoglobin; MNP, multiple micronutrient powder.
Growth and morbidity
There were no differences in growth indicators (WAZ, BAZ, HAZ, or MUACZ) by intervention group at baseline (Table 1) or endline (Table 4). Morbidity indicators did not differ at baseline. At endline, prevalence of ARI did not differ by intervention group Table 5; the placebo group had a significant increase in ARI over time. The prevalence of diarrhea decreased in both intervention groups, with a significant reduction in the placebo group and no difference between intervention groups.
TABLE 4.
MNP compared with placebo mean differences on measures of standardized anthropometric growth in preschoolers from baseline to endline1
| MNP vs. placebo2 | |||||||
|---|---|---|---|---|---|---|---|
| n | MNP | Placebo | P 4 | Effect size (95% CI)5 | Endline × MNP6 | ||
| HAZ | BL | 321 | –1.7 ± 0.1 | –1.9 ± 0.1 | 0.27 | ||
| EL | 293 | –1.5 ± 0.1 | –1.7 ± 0.1 | 0.15 | 0.22 | ||
| ∆3 | 0.2 ± 0.02**** | 0.1 ± 0.02**** | 0.22 | 0.14 (–0.02, 0.3) | |||
| WAZ | BL | 321 | –1.9 ± 0.1 | –2.0 ± 0.1 | 0.34 | ||
| EL | 293 | –1.7 ± 0.1 | –1.9 ± 0.1 | 0.13 | 0.13 | ||
| ∆ | 0.2 ± 0.03**** | 0.1 ± 0.03*** | 0.13 | 0.12 (–0.04, 0.3) | |||
| BAZ | BL | 321 | –1.2 ± 0.1 | –1.1 ± 0.1 | 0.96 | ||
| EL | 293 | –1.1 ± 0.1 | –1.1 ± 0.1 | 0.72 | 0.42 | ||
| ∆ | 0.1 ± 0.04 | 0.02 ± 0.04 | 0.42 | 0.02 (–0.1, 0.2) | |||
| MUACZ | BL | 321 | –1.2 ± 0.1 | –1.3 ± 0.1 | 0.84 | ||
| EL | 293 | –1.0 ± 0.1 | –1.1 ± 0.1 | 0.65 | 0.62 | ||
| ∆ | 0.2 ± 0.0**** | 0.2 ± 0.0**** | 0.62 | 0.03 (–0.1, 0.2) | |||
Values are means ± SEs unless otherwise indicated. Linear mixed-effects regression models with random preschool and subject intercepts fitted for each outcome. ***P < 0.001, ****P < 0.0001. BAZ, BMI-for-age z score; BL, baseline; EL, endline; HAZ, height-for-age z score; MNP, multiple micronutrient powder; MUACZ, midupper arm circumference z score; WAZ, weight-for-age z score.
No evidence of differing MNP compared with placebo effects on biochemical values by preschool quality; pooled analysis results presented.
Within-intervention group change from baseline.
P value for MNP compared with placebo difference in baseline mean, endline mean, and change from baseline.
Cohen's d for the difference in change scores from baseline to endline comparing MNP with placebo. Conventions: small = 0.2, medium = 0.5, large = 0.8 (38).
Time/MNP interaction effect on standardized measures of anthropometric growth.
TABLE 5.
Effects of MNP compared with placebo fortification on morbidity measures in preschoolers over time1,2
| Time (T1 vs. T0) | OR (95% CI) | P 3 | |
|---|---|---|---|
| Acute respiratory infection, episodes | MNP | 1.58 (0.7, 3.6) | 0.27 |
| Placebo | 1.15 (1.01, 1.3) | 0.03 | |
| MNP vs. placebo | 1.38 (0.7, 2.9) | 0.39 | |
| Time × MNP | — | 0.944 | |
| Diarrhea, incidents | MNP | 0.82 (0.4, 1.7) | 0.61 |
| Placebo | 0.78 (0.7, 0.9) | 0.003 | |
| MNP vs. placebo | 1.05 (0.5, 2.1) | 0.89 | |
| Time × MNP | — | 0.074 |
Generalized linear mixed-effects regression models with random preschool and subject intercepts fitted for each outcome; Time in months is treated as continuous. MNP, multiple micronutrient powder.
Recall by month over 15 d.
P value for OR ≠ 1.00.
P value for time–MNP interaction effect.
Discussion
There were 2 major findings from this cluster-randomized controlled trial among preschoolers in rural Indian villages. First, as hypothesized, the impact of MNP meal fortification on childhood development varied by preschool quality. MNP fortification had a positive effect on expressive language and, to a lesser extent, inhibitory control and social–emotional development in low-quality preschools. In high-quality preschools, the MNP intervention did not impact childhood development. Second, MNP meal fortification reduced the prevalence of anemia and iron deficiency, but it did not alter concentrations of other micronutrients, growth, or morbidity.
Child development and preschool quality
At baseline, children's language scores varied by preschool quality, with higher scores in better quality preschools. These findings illustrate the variability in ICDS preschools demonstrated previously (25, 26). In addition, the findings are consistent with the beneficial effects of high-quality preschool attendance demonstrated in other LMICs (47) and in high-income countries, particularly in language development (48, 49).
The beneficial effects of MNP fortification among children in low-quality preschools illustrate the distinctions that are often seen in childhood development interventions (50). Children at greatest risk often experience greatest benefit. The MNP may have enabled children in low-quality schools to maximize existing opportunities, resulting in scores in expressive language and inhibitory control that approximated scores in high-quality preschools.
The disparity reduction is striking. After the 8-mo intervention, disparities in expressive language associated with preschool quality were eliminated or reduced, largely due to improvements among the MNP group children in low-quality schools. Language learning is a complex process that occurs during sensitive periods in a social context (51). Children's language skills can be compromised by exposure to low socioeconomic contexts, but they can also be responsive to enriched environmental opportunities (51). Preschool language skills map onto school-age academic performance (52). Although the mechanisms underlying the association remain unclear, advancing language skills may promote learning through ongoing exploration and interactions.
Preschool executive functioning skills, such as inhibitory control, are sensitive to iron deficiency (35), consistent with our finding of advances in inhibitory control among the MNP groups in both low- and high-quality preschools. Executive functioning is also enhanced by play and has been incorporated into preschool activities (53, 54). Further investigation is warranted to determine if the increase in inhibitory control scores observed among the placebo group in the high-quality preschools is related to the opportunities for play and the preschool curriculum.
Social-emotional development is also sensitive to iron deficiency (7, 8), consistent with the finding that in low-quality preschools, the MNP group had higher scores than the placebo group. The decline in social–emotional development and other domains (e.g., receptive language) during the 8-mo period in both high- and low-quality preschools is not uncommon among young children in low-income settings (55) and has been associated with a history of iron deficiency (36). Poverty negatively impacts children's brain development and functioning, particularly in the preschool years when children are expected to acquire increasingly complex language and problem-solving skills (56). In addition, preschools in low-income communities may lack resources and personnel to provide stimulating and engaging activities that enhance children's development. Additional research is warranted to identify strategies to prevent the declines in developmental scores that occurred among preschool-age children.
The impact of the MNP intervention on preschoolers’ expressive language, inhibitory control, and social–emotional development was positive but modest. Evidence from the bioecological framework has shown that advances in child development require nurturing care, including responsive care, learning opportunities, and security and safety, in addition to adequate health and nutrition (23). Thus, intervention trials that incorporate nutrition, along with responsive care and learning, may have a higher likelihood of impacting childhood development compared with single-component trials.
Reduction in anemia and iron deficiency
The reduction of anemia from 46.7% to 10.1% and the corresponding reduction in iron deficiency from an 8-mo preschool-based delivery of MNP represent major improvements in preschool children's health. Studies conducted in India and elsewhere with high rates of anemia have shown improvements in Hb and ferritin (3, 57) when MNP containing iron and other micronutrients are provided. The effects of the MNP were direct (measured through biomarkers), illustrating that the children received the MNP through the preschool delivery mechanism.
The remarkable reduction in anemia in children with IDA (at endline, 51% of the children with IDA had Hb within normal levels) may be attributed to the strong absorption and utilization of iron that occurs in deficient conditions and to cofactors needed for Hb formation and absorption in the MNP formulation. Reductions in anemia and iron deficiency reduce risks throughout life, including not completing secondary school and negative feelings of dissociation/detachment described among young adults from Chile with an early history of chronic iron deficiency (58). Thus, reduction of rates of anemia and iron deficiency could lead to substantial enhancements in adult social and economic capital.
Micronutrients, growth, and morbidity
The absence of significant differences in the prevalence of inadequacies in folate, zinc, and vitamin B-12 possibly stems from low prevalence of deficiencies at baseline, consistent with recent findings from the Comprehensive National Nutrition Survey (59). MNP fortification did not impact children's growth, consistent with prior reports of variable growth effects (14–16). The significant z score declines in children's height, weight, and upper arm circumference across groups illustrate the ongoing threats to children's growth in the community. The significant changes in inflammation (reduction in CRP) across groups may suggest improved hygienic practices either in preschools or among older children. The trial did not demonstrate differential effects of MNP compared with placebo on morbidity.
The second 1000 d and scaling
The optimal timing for micronutrient supplementation or fortification has been a critical public health concern with a primary focus on the first 1000 d (2). Findings from this investigation highlight the importance of including preschoolers (the second 1000 d). Preschoolers have transitioned to the family diet, feed themselves, and frequently play and explore independently, potentially increasing their exposure to infections. The brain continues to develop rapidly and plasticity is high, providing an extended period of both vulnerability and opportunity (60). Childhood disadvantages, such as anemia, micronutrient deficiencies, and lack of access to early learning and responsive caregiving, increase the risk for lifelong disparities in growth, health, academic performance, and earning capacity (61). Interventions that overcome disadvantages prior to age 5 y are “powerful equalizers” (19, 62) because they promote the neural connections that form the basis for subsequent health and development, thereby reducing risks of long-term disparities (63).
Delivery platforms are a major concern in nutritional interventions. This trial demonstrates the programmatic and health advantages of providing MNP within preschools, where delivery protocols can be managed and monitored. The midday meal provided in the Indian ICDS system facilitated the addition of MNP fortification. Consumption of the initial fortified portion (first bite) was nearly universal, ensuring that children received the food with the added MNP.
This trial emphasizes the potential for scaling an integrated intervention into preschools. Findings are consistent with a recent Cochrane review of food supplementation trials that found that children receive 85% of the energy provided when food is given in child care settings and only 35% when it is given at home (64).
Methodological considerations
There are 3 methodological considerations. First, the trial was conducted within a government-sponsored program, the ICDS. The intervention was shortened to 8 mo to correspond with the academic year. Second, the sample size, although calculated to detect a moderate effect, is relatively small, limiting our power to detect small differences in childhood development. Third, the distinction of high-quality compared with low-quality preschools is relative and sample defined, but it illustrates the importance of preschool quality relative to young children's development and the importance of considering context when evaluating interventions. Improvements in child development are most likely to occur when interventions include attention to the caregiving environment, including early learning/responsive caregiving as recommended by the nurturing care framework (23) and incorporated into the All Children Surviving and Thriving Framework (65). Additional research is needed to link micronutrients and preschool quality, including activities to promote executive functioning.
Conclusions
In this sample, the prevalence of underweight, stunting, and anemia exceeded 40%, consistent with other reports from India (22, 59) and indicating the enormity of nutritional and micronutrient deficiencies among preschoolers in LMICs. The preschool-based meal fortification and examination of preschool quality illustrate the power of utilizing a bioecological framework to evaluate the impact of a nutritional intervention on childhood development (23). Implications from the trial inform the timing, platform, and context of point-of-use micronutrient fortification among young children: 1) Micronutrient intervention during the second 1000 d reduces disparities by improving expressive language and reducing anemia and iron deficiency; 2) adding preschool-delivered micronutrients to “first bites” of the midday meal is feasible with high adherence and benefits to young children; and 3) the impact of micronutrient interventions varies by context, with greater impact among children in low-quality preschools. Enhancing preschool quality and ensuring nutritional adequacy, along with incorporating other aspects of nurturing care (e.g., responsive care and learning), may reduce disparities, advance child development, and promote equity among preschoolers.
ACKNOWLEDGEMENTS
The late Shahnaz Vazir, former Deputy Director and Emeritus Scientist, National Institute of Nutrition (ICMR), and B Sesikeran, former Director, ICMR, provided leadership and multiple contributions. Annie Wesley, formerly with Micronutrient Initiative (which is now Nutrition International) and currently with the International Development Research Centre in Ottawa, provided initial leadership with design and funding. G Subbarao and Little Flower Augustine, both with the ICMR, provided supervision of the data collection team and assistance in micronutrient analysis, respectively. Piramal Healthcare Limited, Mumbai, produced the multiple micronutrient powder and placebo without charge. The authors’ responsibilities were as follows—MMB and KMN: were the principal investigators; MMB: coordinated the preparation of the manuscript; SF-R: was the project coordinator and supervised the data collection; KMN: coordinated the development of the fortification and supervised the biochemical analyses; NB, NT, and DPY: conducted the analyses; KMH and NT: developed the tracking and data entry systems; KVR: provided pediatric consultation; PR: conducted micronutrient analysis; MMB and KMH: wrote the proposal; and all authors: wrote sections of the manuscript, made critical comments and contributions, and read and approved the final manuscript.
Notes
Supported by Nutrition International, The Mathile Institute for the Advancement of Human Nutrition, and Eunice Kennedy National Institute of Child Health and Human Development grant F31 HD095615.
Author disclosures: KBH is an employee of Nutrition International (formerly Micronutrient Initiative), and GR is an employee of The Mathile Institute for the Advancement of Human Nutrition. They participated in discussions regarding the scientific conduct and interpretation of the study but did not direct the study or conduct the analyses. All other authors report no conflicts of interest.
Abbreviations used: ARI, acute respiratory infection; BAZ, BMI-for-age z score; CRP, C-reactive protein; HAZ, height-for-age z score; Hb, hemoglobin; HOME, Home Observation for the Measurement of the Environment Inventory; ICC, intraclass correlation; ICDS, Integrated Child Development Services; IDA, iron deficiency anemia; LMIC, low- and middle-income country; MMN, multiple micronutrient; MNP, multiple micronutrient powder; MSEL, Mullen Scales of Early Learning; MUAC, midupper arm circumference; MUACZ, midupper arm circumference z score; NIN, National Institute of Nutrition; sTfR, soluble transferrin receptor; WAZ, weight-for-age z score.
Contributor Information
Maureen M Black, Department of Pediatrics, University of Maryland School of Medicine, Baltimore, MD, USA; RTI International, Research Triangle Park, NC, USA.
Sylvia Fernandez-Rao, Department of Behavioral Science, National Institute of Nutrition, Indian Council of Medical Research, Hyderabad, India.
Krishnapillai Madhavan Nair, Department of Micronutrient Research, National Institute of Nutrition, Indian Council of Medical Research, Hyderabad, India.
Nagalla Balakrishna, Department of Biostatistics, National Institute of Nutrition, Indian Council of Medical Research, Hyderabad, India.
Nicholas Tilton, Department of Epidemiology and Public Health, University of Maryland School of Medicine, Baltimore, MD, USA.
Kankipati Vijaya Radhakrishna, Clinical Division, National Institute of Nutrition, Indian Council of Medical Research, Hyderabad, India.
Punjal Ravinder, Department of Micronutrient Research, National Institute of Nutrition, Indian Council of Medical Research, Hyderabad, India.
Kimberly B Harding, Nutrition International, Ottawa, Canada.
Gregory Reinhart, The Mathile Institute for the Advancement of Human Nutrition, Dayton, OH, USA.
Doris P Yimgang, Department of Epidemiology and Public Health, University of Maryland School of Medicine, Baltimore, MD, USA.
Kristen M Hurley, Department of International Health, Johns Hopkins Bloomberg School of Public Health, Baltimore, MD, USA.
Data Availability
The data, code book, and analytic code will be made available from a public repository, “University of Maryland at Baltimore (UMB) Digital Archive,” upon request.
References
- 1. Stevens GA, Finucane MM, De-Regil LM, Paciorek CJ, Flaxman SR, Branca F, Danaei G, Li G, White RA, Flaxman SRet al. ; Nutrition Impact Model Study Group. Global, regional, and national trends in haemoglobin concentration and prevalence of total and severe anaemia in children and pregnant and non-pregnant women for 1995–2011: a systematic analysis of population-representative data. Lancet Glob Health. 2013;1(1):e16–25. [DOI] [PMC free article] [PubMed] [Google Scholar]
- 2. Adair LS. Long-term consequences of nutrition and growth in early childhood and possible preventive interventions. Nestle Nutrition Institute Workshop Series. 2014;78:111–20. [DOI] [PubMed] [Google Scholar]
- 3. Thompson J, Biggs BA, Pasricha SR. Effects of daily iron supplementation in 2- to 5-year-old children: systematic review and meta-analysis. Pediatrics. 2013;131(4):739–53. [DOI] [PubMed] [Google Scholar]
- 4. Black MM, Perez-Escamilla R, Fernandez Rao S. Integrating nutrition and child development interventions: scientific basis, evidence of impact, and implementation considerations. Adv Nutr. 2015;6(6):852–9. [DOI] [PMC free article] [PubMed] [Google Scholar]
- 5. Georgieff MK, Ramel SE, Cusick SE. Nutritional influences on brain development. Acta Paediatr. 2018;107(8):1310–21. [DOI] [PMC free article] [PubMed] [Google Scholar]
- 6. Larson LM, Phiri KS, Pasricha S-R. Iron and cognitive development: what is the evidence?. Ann Nutr Metab. 2017;71(Suppl 3):25–38. [DOI] [PubMed] [Google Scholar]
- 7. Lozoff B. Early iron deficiency has brain and behavior effects consistent with dopaminergic dysfunction. J Nutr. 2011;141(4):740S–6S. [DOI] [PMC free article] [PubMed] [Google Scholar]
- 8. Allali S, Brousse V, Sacri A-S, Chalumeau M, de Montalembert M. Anemia in children: prevalence, causes, diagnostic work-up, and long-term consequences. Expert Rev Hematol. 2017;10(11):1023–8. [DOI] [PubMed] [Google Scholar]
- 9. Ssemata AS, Opoka RO, Ssenkusu JM, Nakasujja N, John CC, Bangirana P. Neurodevelopmental performance among pre-schoolers treated for severe anaemia at Lira Regional Referral Hospital, Uganda. PLoS One. 2020;15(11):e0240694. [DOI] [PMC free article] [PubMed] [Google Scholar]
- 10. George J, Yiannakis M, Main B, Devenish R, Anderson C, An US, Williams SM, Gibson RS. Genetic hemoglobin disorders, infection, and deficiencies of iron and vitamin A determine anemia in young Cambodian children. J Nutr. 2012;142(4):781–7. [DOI] [PMC free article] [PubMed] [Google Scholar]
- 11. WHO . The global prevalence of anaemia in 2011.2015; [Internet]. [Cited 2021 Apr 6]. Available from: https://www.who.int/nutrition/publications/micronutrients/global_prevalence_anaemia_2011/en. [Google Scholar]
- 12. Palacios AM, Hurley KM, De-Ponce S, Alfonso V, Tilton N, Lambden KB, Reinhart GA, Freeland-Graves JH, Villanueva LM, Black MM. Zinc deficiency associated with anaemia among young children in rural Guatemala. Matern Child Nutr. 2020;16(1):e12885. [DOI] [PMC free article] [PubMed] [Google Scholar]
- 13. WHO . Use of multiple micronutrient powders for point-of-use fortification of foods consumed by infants and young children aged 6–23 months and children aged 2–12 years. Geneva (Switzerland): WHO; 2016; [cited 2021 Jan 5] [Internet]. Available from: http://www.who.int/nutrition/publications/micronutrients/guidelines/mmpowders-infant6to23mons-children2to12yrs/en. [PubMed] [Google Scholar]
- 14. Salam RA, MacPhail C, Das JK, Bhutta ZA. Effectiveness of micronutrient powders (MNP) in women and children. BMC Public Health. 2013;13(3):1. [DOI] [PMC free article] [PubMed] [Google Scholar]
- 15. De-Regil LM, Jefferds MED, Peña-Rosas JP. Point-of-use fortification of foods with micronutrient powders containing iron in children of preschool and school-age. Cochrane Database Syst Rev. 2017;11(11):CD009666. [DOI] [PMC free article] [PubMed] [Google Scholar]
- 16. Tam E, Keats EC, Rind F, Das JK. Micronutrient supplementation and fortification interventions on health and development outcomes among children under-five in low- and middle-income countries: a systematic review and meta-analysis. Nutrients. 2020;12(2):289. [DOI] [PMC free article] [PubMed] [Google Scholar]
- 17. Ogunlade AO, Kruger HS, Jerling JC, Smuts CM, Covic N, Hanekom SM, Mamabolo RL, Kvalsvig J. Point-of-use micronutrient fortification: lessons learned in implementing a preschool-based pilot trial in South Africa. Int J Food Sci Nutr. 2011;62(1):1–16. [DOI] [PubMed] [Google Scholar]
- 18. Hirve S, Martini E, Juvekar SK, Agarwal D, Bavdekar A, Sari M, Molwane M, James S, Haselow N, Yeung DL. Delivering Sprinkles Plus through the Integrated Child Development Services (ICDS) to reduce anemia in pre-school children in India. Indian J Pediatr. 2013;80(12):990–5. [DOI] [PubMed] [Google Scholar]
- 19. Britto PR, Lye SJ, Proulx K, Yousafzai AK, Matthews SG, Vaivada T, Perez-Escamilla R, Rao N, Ip P, Fernald LCHet al. Nurturing care: promoting early childhood development. Lancet North Am Ed. 2017;389(10064):91–102. [DOI] [PubMed] [Google Scholar]
- 20. Hurley KM, Yousafzai AK, Lopez-Boo F. Early child development and nutrition: a review of the benefits and challenges of implementing integrated interventions. Adv Nutr. 2016;7(2):357–63. [DOI] [PMC free article] [PubMed] [Google Scholar]
- 21. Aboud FE, Yousafzai AK. Global health and development in early childhood. Annu Rev Psychol. 2015;66:433–57. [DOI] [PubMed] [Google Scholar]
- 22. Prado EL, Larson LM, Cox K, Bettencourt K, Kubes JN, Shankar AH. Do effects of early life interventions on linear growth correspond to effects on neurobehavioural development? A systematic review and meta-analysis. Lancet Glob Health. 2019;7(10):e1398–e413. [DOI] [PubMed] [Google Scholar]
- 23. Black MM, Walker SP, Fernald LC, Andersen CT, DiGirolamo AM, Lu C, McCoy DC, Fink G, Shawar YR, Shiffman Jet al. Early childhood development coming of age: science through the life course. Lancet North Am Ed. 2017;389(10064):77–90. [DOI] [PMC free article] [PubMed] [Google Scholar]
- 24. Black RE, Victora CG, Walker SP, Bhutta ZA, Christian P, de Onis M, Ezzati M, Grantham McGregor S, Katz J, Martorell Ret al. Maternal and child undernutrition and overweight in low-income and middle-income countries. Lancet North Am Ed. 2013;382(9890):427–51. [DOI] [PubMed] [Google Scholar]
- 25. Ade A, Gupta SS, Maliye C, Deshmukh PR, Garg BS. Effect of improvement of pre-school education through Anganwadi center on intelligence and development quotient of children. Indian J Pediatr. 2010;77(5):541–6. [DOI] [PubMed] [Google Scholar]
- 26. Chudasama RK, Patel UV, Kadri AM, Mitra A, Thakkar D, Oza J. Evaluation of integrated child development services program in Gujarat, India for the years 2012 to 2015. Indian J Public Health. 2016;60(2):124–30. [DOI] [PubMed] [Google Scholar]
- 27. Fernandez-Rao S, Hurley KM, Nair KM, Balakrishna N, Radhakrishna KV, Ravinder P, Tilton N, Harding KB, Reinhart GA, Black MM. Integrating nutrition and early child-development interventions among infants and preschoolers in rural India. Ann NY Acad Sci. 2014;1308:218–31. [DOI] [PubMed] [Google Scholar]
- 28. Brown AW, Li P, Bohan Brown MM, Kaiser KA, Keith SW, Oakes JM, Allison DB. Best (but oft-forgotten) practices: designing, analyzing, and reporting cluster randomized controlled trials. Am J Clin Nutr. 2015;102(2):241–8. [DOI] [PMC free article] [PubMed] [Google Scholar]
- 29. National Nutrition Monitoring Bureau . Technical report no 22: prevalence of micronutrient deficiencies. Hyderabad (India): National Institute of Nutrition; 2003. [Google Scholar]
- 30. Vazir S, Engle P, Balakrishna N, Griffiths PL, Johnson SL, Creed-Kanashiro H, FernandezRao S, Shroff MR, Bentley ME. Cluster-randomized trial on complementary and responsive feeding education to caregivers found improved dietary intake, growth and development among rural Indian toddlers. Matern Child Nutr. 2013;9:99–117. [DOI] [PMC free article] [PubMed] [Google Scholar]
- 31. Harms T, Clifford RM, CryerD,editors. Early Childhood Environmental Rating Scale–Revised. New York: Teachers College Press; 2005. [Google Scholar]
- 32. Bradley RH, Caldwell BM, Corwyn RF. The child care HOME Inventories: assessing the quality of family child care homes. Early Childhood Res Q. 2003;18(3):294–309. [Google Scholar]
- 33. Dowsett SM, Livesey DJ. The development of inhibitory control in preschool children: effects of “executive skills” training. Dev Psychobiol. 2000;36(2):161–74. [DOI] [PubMed] [Google Scholar]
- 34. Bayley N. Bayley Scales of Infant and Toddler Development, version III. San Antonio (TX); Psychological Corporation; 2006. [Google Scholar]
- 35. Algarin C, Nelson CA, Peirano P, Westerlund A, Reyes S, Lozoff B. Iron-deficiency anemia in infancy and poorer cognitive inhibitory control at age 10 years. Dev Med Child Neurol. 2013;55(5):453–8. [DOI] [PMC free article] [PubMed] [Google Scholar]
- 36. East P, Lozoff B, Blanco E, Delker E, Delva J, Encina P, Gahagan S. Infant iron deficiency, child affect, and maternal unresponsiveness: testing the long-term effects of functional isolation. Dev Psychol. 2017;53(12):2233. [DOI] [PMC free article] [PubMed] [Google Scholar]
- 37. Mullen EM. Mullens Scales of Early Learning: AGS edition. Circle Pines (MN): American Guidance Service; 1995. [Google Scholar]
- 38. Xie W, Kumar S, Kakon SH, Haque R, Petri WA, Nelson CA. Chronic inflammation is associated with neural responses to faces in Bangladeshi children. Neuroimage. 2019;202:116110. [DOI] [PMC free article] [PubMed] [Google Scholar]
- 39. Atukunda P, Muhoozi GK, van den Broek TJ, Kort R, Diep LM, Kaaya AN, Iversen PO, Westerberg AC. Child development, growth and microbiota: follow-up of a randomized education trial in Uganda. J Glob Health. 2019;9(1):010431. [DOI] [PMC free article] [PubMed] [Google Scholar]
- 40. Boivin MJ, Maliwichi-Senganimalunje L, Ogwang LW, Kawalazira R, Sikorskii A, Familiar-Lopez I, Kuteesa A, Nyakato M, Mutebe A, Namukooli JLet al. Neurodevelopmental effects of ante-partum and post-partum antiretroviral exposure in HIV-exposed and uninfected children versus HIV-unexposed and uninfected children in Uganda and Malawi: a prospective cohort study. Lancet HIV. 2019;6(8):e518–e30. [DOI] [PMC free article] [PubMed] [Google Scholar]
- 41. Nair KM, Fernandez-Rao S, Nagalla B, Kankipati RV, Punjal R, Augustine LF, Hurley KM, Tilton N, Harding KB, Reinhart Get al. Characterisation of anaemia and associated factors among infants and pre-schoolers from rural India. Public Health Nutr. 2016;; 19(5):861–71. [DOI] [PMC free article] [PubMed] [Google Scholar]
- 42. Thurnham DI, McCabe LD, Haldar S, Wieringa FT, Northrop-Clewes CA, McCabe GP. Adjusting plasma ferritin concentrations to remove the effects of subclinical inflammation in the assessment of iron deficiency: a meta-analysis. Am J Clin Nutr. 2010;92(3):546–55. [DOI] [PubMed] [Google Scholar]
- 43. Mohite K. Indian adaptation of the HOME Scale. New Delhi (India): University of Delhi Library; 1992. [Google Scholar]
- 44. Filmer D, Pritchett LH. Estimating wealth effects without expenditure data—or tears: an application to educational enrollments in states of India. Demography. 2001;38(1):115–32. [DOI] [PubMed] [Google Scholar]
- 45. Coates J, Frongillo EA, Rogers BL, Webb P, Wilde PE, Houser R. Commonalities in the experience of household food insecurity across cultures: what are measures missing?. J Nutr. 2006;136(5):1438S–48S. [DOI] [PubMed] [Google Scholar]
- 46. Cohen J, Cohen P, West S, AikenL,editors. Applied multiple regression/correlation analysis for the behavioral sciences. New York: Wiley; 2003. [Google Scholar]
- 47. Berlinski S, Schady N. The early years: child well-being and the role of public policy. Development in the Americas Series. New York/Washington (DC): Macmillan/Inter-American Development Bank; 2015. [Google Scholar]
- 48. Keys TD, Farkas G, Burchinal MR, Duncan GJ, Vandell DL, Li W, Ruzek, EA, Howes, C. Preschool center quality and school readiness: quality effects and variation by demographic and child characteristics. Child Dev. 2013;84(4):1171–90. [DOI] [PMC free article] [PubMed] [Google Scholar]
- 49. Martin A, Johnson AD, Castle S. Reframing high-quality public preschool as a vehicle for narrowing child health disparities based on family income. Acad Pediatr. 2020;S1876–2859(20):30424–1. [DOI] [PMC free article] [PubMed] [Google Scholar]
- 50. Bann CM, Wallander JL, Do B, Thorsten V, Pasha O, Biasini FJ, Bellad R, Goudar S, Chomba E, McClure Eet al. Home-based early intervention and the influence of family resources on cognitive development. Pediatrics. 2016;137(4):e20153766. [DOI] [PMC free article] [PubMed] [Google Scholar]
- 51. Kuhl PK. Early language learning and literacy: neuroscience implications for education. Mind Brain Educ. 2011;5(3):128–42. [DOI] [PMC free article] [PubMed] [Google Scholar]
- 52. Einarsdóttir JT, Björnsdóttir A, Símonardóttir I. The predictive value of preschool language assessments on academic achievement: a 10-year longitudinal study of Icelandic children. Am J Speech Lang Pathol. 2016;25(1):67–79. [DOI] [PubMed] [Google Scholar]
- 53. Kochanska G, Murray K, Jacques TY, Koenig AL, Vandegeest KA. Inhibitory control in young children and its role in emerging internalization. Child Dev. 1996;67(2):490–507. [PubMed] [Google Scholar]
- 54. Rosas R, Espinoza V, Porflitt F, Ceric F. Executive functions can be improved in preschoolers through systematic playing in educational settings: evidence from a longitudinal study. Front Psychol. 2019;10:2024. [DOI] [PMC free article] [PubMed] [Google Scholar]
- 55. John CC, Black MM, Nelson CA. Neurodevelopment: the impact of nutrition and inflammation during early to middle childhood in low-resource settings. Pediatrics. 2017;139(Suppl 1):S59–71. [DOI] [PMC free article] [PubMed] [Google Scholar]
- 56. Hair NL, Hanson JL, Wolfe BL, Pollak SD. Association of child poverty, brain development, and academic achievement. JAMA. 2015;169(9):822–9. [DOI] [PMC free article] [PubMed] [Google Scholar]
- 57. Bortolini GA, Vitolo MR. Relationship between iron deficiency and anemia in children younger than 4 years. J Pediatr. 2010;86(6):488–92. [DOI] [PubMed] [Google Scholar]
- 58. Lozoff B, Smith JB, Kaciroti N, Clark KM, Guevara S, Jimenez E. Functional significance of early-life iron deficiency: outcomes at 25 years. J Pediatr. 2013;163(5):1260–6. [DOI] [PMC free article] [PubMed] [Google Scholar]
- 59. Ministry of Health and Family Welfare, Government of India, UNICEF and Population Council . Comprehensive National Nutrition Survey (CNNS) national report. New Delhi (India): Ministry of Health and Family Welfare; 2019; [Internet]. [Cited 2021 Apr 6]. Available from: https://www.popcouncil.org/uploads/pdfs/2019RH_CNNSreport.pdf. [Google Scholar]
- 60. Weaver IC. Integrating early life experience, gene expression, brain development, and emergent phenotypes: unraveling the thread of nature via nurture. Adv Genet. 2014;86:277–307. [DOI] [PubMed] [Google Scholar]
- 61. Martorell R, Melgar P, Maluccio JA, Stein AD, Rivera JA. The nutrition intervention improved adult human capital and economic productivity. J Nutr. 2010;140(2):411–4. [DOI] [PMC free article] [PubMed] [Google Scholar]
- 62. Irwin LG, Siddiqi A, Hertzman C. Early child development: a powerful equalizer. Final Report to the WHO Commission on Social Determinants of health, Geneva; 2007. [Google Scholar]
- 63. Gertler P, Heckman J, Pinto R, Zanolini A, Vermeersch C, Walker S, Chang SM, Grantham McGregor S. Labor market returns to an early childhood stimulation intervention in Jamaica. Science. 2014;344(6187):998–1001. [DOI] [PMC free article] [PubMed] [Google Scholar]
- 64. Kristjansson E, Francis DK, Liberato S, Benkhalti Jandu M, Welch V, Batal M, Greenhalgh T, Radar T, Noonan E, Shea Bet al. Food supplementation for improving the physical and psychosocial health of socio-economically disadvantaged children aged three months to five years. Cochrane Database Syst Rev. 2015(3):CD009924. [DOI] [PMC free article] [PubMed] [Google Scholar]
- 65. Black MM, Lutter CK, Trude AC. All children surviving and thriving: re-envisioning UNICEF's conceptual framework of malnutrition. Lancet Glob Health. 2020;8(6):e766–e7. [DOI] [PubMed] [Google Scholar]
Associated Data
This section collects any data citations, data availability statements, or supplementary materials included in this article.
Data Availability Statement
The data, code book, and analytic code will be made available from a public repository, “University of Maryland at Baltimore (UMB) Digital Archive,” upon request.