Abstract
The human diet consists of a complex mixture of components. To realistically assess dietary impacts on health, new statistical tools that can better address nonlinear, collinear, and interactive relationships are necessary. Using data from 1,928 healthy participants in the Coronary Artery Risk Development in Young Adults (CARDIA) cohort (1985–2006), we explored the association between 12 dietary factors and 10-year predicted risk of atherosclerotic cardiovascular disease (ASCVD) using an innovative approach, Bayesian kernel machine regression (BKMR). Employing BKMR, we found that among women, unprocessed red meat was most strongly related to the outcome: An interquartile range increase in unprocessed red meat consumption was associated with a 0.07-unit (95% credible interval: 0.01, 0.13) increase in ASCVD risk when intakes of other dietary components were fixed at their median values (similar results were obtained when other components were fixed at their 25th and 75th percentile values). Among men, fruits had the strongest association: An interquartile range increase in fruit consumption was associated with −0.09-unit (95% credible interval (CrI): −0.16, −0.02), −0.10-unit (95% CrI: −0.16, −0.03), and −0.11-unit (95% CrI: −0.18, −0.04) lower ASCVD risk when other dietary components were fixed at their 25th, 50th (median), and 75th percentile values, respectively. Using BKMR to explore the complex structure of the total diet, we found distinct sex-specific diet-ASCVD relationships and synergistic interaction between whole grain and fruit consumption.
Keywords: cardiovascular diseases, complex mixtures, machine learning
Abbreviation
- ASCVD
atherosclerotic cardiovascular disease
- BKMR
Bayesian kernel machine regression
- CARDIA
Coronary Artery Risk Development in Young Adults
- CrI
credible interval
- CVD
cardiovascular disease
- IQR
interquartile range
- NCC
Nutrition Coordinating Center
- PIP
posterior inclusion probability
- PCE
Pooled Cohort Equations
- SD
standard deviation
A suboptimal diet is associated with substantial mortality due to heart disease, stroke, and type 2 diabetes, both in the United States and globally (1, 2). Current statistical methods for investigating nutritional impacts on health have yielded many insights but also have critical limitations, necessitating the development of novel approaches that can appropriately capture the complexity of nutrition data.
A large body of evidence exists in nutritional epidemiology regarding the health effects of single nutrients or foods. While such evidence has significantly furthered understanding of the role of dietary factors in many diseases (3, 4), this approach is limited in that it does not necessarily reflect the complexity of the human diet (5), wherein individuals consume a combination of various nutrients and foods. Further, with multiple nutrients or foods as exposures, it can be challenging to manually specify a conventional regression model that incorporates possible nonlinear and interactive relationships (such as vitamin C as an enhancer of iron absorption (6)) with the health outcome. Additionally, a high degree of collinearity among dietary factors can result in unstable estimations of association (7). Nutritional epidemiologists also investigate the joint effects of dietary factors on health using dietary pattern analyses, such as cluster analysis, factor analysis, and index analysis. While these methods capture overall dietary information, pattern analysis may limit us from understanding the biological relationships between specific dietary factors and health outcomes and may dilute the estimated health effect of specific dietary factors within the total diet (5).
In their 2016 workshop entitled “Extending Methods in Dietary Patterns Research,” the National Cancer Institute and the National Institutes of Health identified 10 main research gaps to further advance dietary pattern research (7). Two of the gaps, the “need to develop methods and models that fully capture the richness within the total dietary pattern” (7, p. 4) and the “need to clarify the appropriate methods and models to interpret substitution effects for single components within the context of a total dietary pattern” (7, p. 4), highlight the necessity to apply innovative tools that help elucidate relationships between foods or nutrients and health outcomes while considering the complex structure of the human diet.
One such innovative method is Bayesian kernel machine regression (BKMR), a machine-learning approach that allows flexibility in modeling complex exposure-outcome relationships along with interpretable estimates of joint, single-component, and interactive effects of the exposures on health. These characteristics make BKMR a suitable response to the need to advance methods for studying the diet-disease relationship by overcoming the limitations of the current approaches (5, 8–11).
Our objective in the current study was to explore the associations between 12 dietary factors, as individual components and in totality, and cardiovascular disease (CVD) risk in a middle-aged US population using BKMR, which can flexibly incorporate the potential interactions and nonlinearities between dietary factors and health outcomes. We anticipated that our application of the data-driven BKMR approach would supplement traditional models of the associations of single nutrients, foods, and dietary patterns with health outcomes by generating novel hypotheses through identifying new relationships (e.g., interactions, nonlinearities), as well as through strengthening existing evidence based on consistent results.
METHODS
Study population
The Coronary Artery Risk Development in Young Adults (CARDIA) Study is a population-based prospective cohort study aiming to identify risk factors for CVDs among healthy young adults in the United States (12). Briefly, the study began in 1985–1986 with 5,115 participants aged 18–30 years from 4 US cities (Birmingham, Alabama; Chicago, Illinois; Minneapolis, Minnesota; and Oakland, California). At baseline recruitment, the numbers of participants in race/ethnicity, sex, age, and educational-level subgroups were approximately equal. The cohort was followed through years 2, 5, 7, 10, 15, 20, 25, and 30. In this study, we used year 20 data (n = 3,546), the point at which most participants (92%) had reached age 40 years, the minimum age needed to derive the outcome score (13). At year 20, the rate of follow-up from baseline was 72%.
We excluded participants who 1) were under age 40 years (n = 301), 2) had a history of cancer or heart problems (n = 503) or were missing medical history records (n = 74), 3) had an implausible total energy intake (males: <800 kcal/day or >8,000 kcal/day; females: <600 kcal/day or >6,000 kcal/day) (n = 81), or 4) were missing information on exposures, outcome, or covariates included in the analyses (n = 659) (see Web Figure 1, available online at https://doi.org/10.1093/aje/kwab004).
Dietary exposures
Diet was assessed with a validated, interviewer-administrated food frequency questionnaire (14, 15). The food items reportedly consumed over the past month were assigned to one of the 166 food groups developed by the University of Minnesota Nutrition Coordinating Center (NCC). The NCC calculated standard serving sizes per day based on the 2000 Dietary Guidelines for Americans and the US Food and Drug Administration standard (16). Nutrients and energy intakes were computed from the NCC Food and Nutrient Database (16).
We further selected from and aggregated the 166 NCC food groups into 12 dietary factors for which there is established probable or convincing evidence of associations with CVD (17) or that are substantially consumed among US adults and linked to major health outcomes (18). We standardized the dietary intakes based on 2,000-kcal/day energy intake using the residual method (19). We averaged the energy-adjusted intakes at baseline, year 7, and year 20 to represent the cumulative intakes during young adulthood (20). Sodium data were not available for year 7; hence, only sodium values from baseline and year 20 were averaged.
Atherosclerotic cardiovascular disease risk outcome
Each participant’s 10-year risk of atherosclerotic cardiovascular disease (ASCVD) was predicted using the revised Pooled Cohort Equations (PCE) for estimating atherosclerotic CVD risk score (13). Briefly, this continuous score was constructed on the basis of the participant’s sex, age, race/ethnicity (Black/White), ratio of total cholesterol to high-density lipoprotein cholesterol, systolic blood pressure, hypertension treatment (yes/no), smoking status (current smoker/current nonsmoker), and diabetes status (yes/no). Compared with the original 2013 PCE (21), the revised PCE improve the accuracy of the prediction through updated data and an improved statistical method (13).
Covariates
The covariates included in this analysis were sociodemographic factors (age, race/ethnicity, family income, education), lifestyle factors (physical activity), and body mass index (weight (kg)/height (m)2), all recorded at year 20. To avoid overadjustment, we did not adjust for variables included in the revised PCE, other than age and race/ethnicity. Sociodemographic information was obtained through a standard questionnaire. Physical activity was assessed using the CARDIA Physical Activity History questionnaire, a self-report measurement of participation in leisure, job, and household activities over a year. A total activity score, in exercise units, was computed based on the intensity and frequency of activity in 13 moderate or intense physical-activity categories (22).
Statistical analysis
We assessed sex differences in population characteristics, dietary factors, and predicted ASCVD risk and its risk factors using a 2-sample t test (for normally distributed continuous variables), the Mann-Whitney U test (for nonnormal continuous variables), and the χ2 test (for categorical variables). The pairwise correlations among dietary factors were assessed by Spearman correlation. We log-transformed data on the outcome to meet the linear regression assumption. All analyses were stratified by sex due to the significant differences in dietary intakes between women and men (Web Table 1).
Linear regression.
We first evaluated the association between a single dietary factor and the predicted ASCVD risk using linear regression. Then, we fitted a model that included all dietary factors concurrently. All models adjusted for covariates.
Given the limited ability of a regression model to represent a high-dimensional parameter space that includes nonlinearities and interactions, we employed BKMR, a method developed to handle such complexities, in the second stage of analysis.
Bayesian kernel machine regression.
BKMR can flexibly model the relationship between multiple dietary factors and predicted ASCVD risk in the context of the total diet, by regressing the health outcome on a smooth function, h, of the exposure variables, adjusting for covariates. BKMR models the function through a nonparametric kernel machine representation. Among various choices of kernels (e.g., linear, quadratic), we chose the Gaussian kernel, which has been found to well-approximate a range of underlying functional forms. The Gaussian kernel machine representation assumes that 2 individuals with similar exposure profiles will have similar outcomes. Further details regarding the BKMR model specification are available in Web Appendix 1.
Although it is not possible to visualize the high-dimensional h function on a 2-dimensional surface, in the figures shown here we present spatial cross-sections of the multidimensional function. From the fitted BKMR model, we estimated several parameters to summarize key features of the diet-ASCVD relationship: 1) the association between total diet and predicted ASCVD risk; 2) the component-specific associations between an interquartile range (IQR) change in each dietary factor and predicted ASCVD risk, including an exploration of possible exposure-exposure interactions; 3) the dose-response relationship for each component; and 4) the relative importance of dietary components responsible for the outcome through variable selection, measured by means of posterior inclusion probabilities (PIPs). Methods for calculating these summary parameters are available through the R “bkmr” package (11, 23). All analyses were performed with R software (R Foundation for Statistical Computing, Vienna, Austria), version 3.6.1 (24).
Sensitivity analysis
We performed sensitivity analyses for 2 aspects of the modeling, described in Web Appendix 2. Briefly, we first fitted the BKMR model with 4 alternative prior distributions because the results of variable selection can be sensitive to the choice of the prior distribution (11). Second, we additionally incorporated the consumption of “some whole grains” as an exposure to represent a more comprehensive dietary totality and allow for its potential interactions with other dietary components.
RESULTS
Population characteristics, exposures, and outcome
After exclusions, the primary analysis included 1,928 CARDIA participants (1,045 female and 883 male) with an average age of 45.8 years (standard deviation (SD), 3.1). Data on population characteristics and the predicted 10-year ASCVD risk and its risk factors are presented in Table 1. Compared with men, women included a higher proportion of African Americans (46.8% vs. 36.8%) and had higher body mass index (29.7 (SD, 7.2) vs. 28.8 (SD, 5.0)), lower physical activity scores (281.0 exercise units (SD, 238.9) vs. 415.5 exercise units (SD, 280.8)), and lower annual family income (8.8% vs. 6.3% for the lowest income category ($12,000–$15,999); 29.0% vs. 39.2% for the highest income category (≥$100,000)). The median predicted 10-year ASCVD risk in the study population was 1% (IQR, 1–3), and women had lower risk than men (1% (IQR, 0–1) vs. 2% (IQR, 2–4)).
Table 1.
Characteristics of Participants in the CARDIA Study at Year 20, by Sex, 2005–2006
| Characteristic | Total (n = 1,928) | Women (n = 1,045) | Men (n = 883) | P Value a | |||
|---|---|---|---|---|---|---|---|
| Mean (SD) | % | Mean (SD) | % | Mean (SD) | % | ||
| Age, years | 45.8 (3.1) | 45.8 (3.1) | 45.9 (3.0) | 0.54 | |||
| Race/ethnicity | <0.001 | ||||||
| White | 57.8 | 53.2 | 63.2 | ||||
| African-American | 42.2 | 46.8 | 36.8 | ||||
| Highest grade of schooling completed | 0.90 | ||||||
| 12 (high school) | 20.8 | 20.9 | 20.7 | ||||
| 13 (1 year of college) | 5.5 | 5.1 | 6.0 | ||||
| 14 (2 years of college) | 15.5 | 15.4 | 15.6 | ||||
| 15 (3 years of college) | 5.3 | 5.6 | 5.0 | ||||
| 16 (4 years of college) | 27.3 | 27.9 | 26.5 | ||||
| 17 (graduate study) | 25.6 | 25.2 | 26.2 | ||||
| Family income, dollars/year | <0.001 | ||||||
| 12,000–15,999 | 7.7 | 8.8 | 6.3 | ||||
| 16,000–24,999 | 4.5 | 5.6 | 3.2 | ||||
| 25,000–34,999 | 6.6 | 7.5 | 5.5 | ||||
| 35,000–49,999 | 12.6 | 14.1 | 11.0 | ||||
| 50,000–74,999 | 19.5 | 19.6 | 19.4 | ||||
| 75,000–99,999 | 15.4 | 15.5 | 15.4 | ||||
| ≥100,000 | 33.7 | 29.0 | 39.2 | ||||
| Body mass indexb | 29.3 (6.3) | 29.7 (7.2) | 28.8 (5.0) | 0.002 | |||
| Total physical activity score, EUc | 342.6 (267.4) | 281.0 (238.9) | 415.5 (280.8) | <0.001 | |||
| Predicted 10-year ASCVD risk, %d | 1 (1–3) | 1 (0–1) | 2 (2–4) | <0.001 | |||
| Total cholesterol, mg/dL | 187.1 (35.2) | 186.9 (32.7) | 187.3 (38.0) | 0.80 | |||
| HDL cholesterol, mg/dL | 53.7 (16.4) | 59.3 (16.3) | 47.2 (14.1) | <0.001 | |||
| Systolic blood pressure, mm Hg | 116.8 (15.0) | 114.1 (15.6) | 119.9 (13.7) | <0.001 | |||
| Hypertension treatment | 16.2 | 16.9 | 15.4 | 0.40 | |||
| Current smoker | 17.8 | 17.1 | 18.6 | 0.44 | |||
| Diabetes | 6.8 | 7.9 | 5.5 | 0.05 | |||
Abbreviations: ASCVD, atherosclerotic cardiovascular disease; CARDIA, Coronary Artery Risk Development in Young Adults; EU, exercise units; HDL, high-density lipoprotein; SD, standard deviation.
a P values from a 2-sample t test for continuous variables (the Mann-Whitney U test was used for 10-year ASCVD risk because of its nonnormal data distribution) and a χ2 test for categorical variables. All tests were 2-sided.
b Weight (kg)/height (m)2.
c Total physical activity score was computed on the basis of the intensity and frequency of activity in 13 moderate or intense physical-activity categories.
d Values are expressed as median (interquartile range).
A summary of the energy-adjusted dietary intakes is presented in Web Table 1. The correlations among dietary factors were weak to moderate (Web Figure 2). A number of CARDIA participants (n = 530) missed at least 1 food frequency questionnaire measurement during follow-up. Web Table 2 shows the distributions of the outcome and covariates between the complete cases and those with missed food frequency questionnaire data.
Linear regression
Results from the linear regression models are presented in Web Appendix 3.
Bayesian kernel machine regression
The BKMR models converged after 50,000 iterations. Convergence diagnostics are shown in Web Figures 3 and 4. We first examined the association between total diet and predicted ASCVD risk. This association was estimated as the expected change in the outcome when values for all 12 dietary factors changed simultaneously from their median values to a particular quantile. Among women (Figure 1A), we found an increasing trend in the predicted risk with jointly increasing percentiles of all dietary components. In contrast, the result in men (Figure 1B) indicated a reduction in disease risk with increased dietary totality. All 95% credible intervals included the null value for both sexes.
Figure 1.
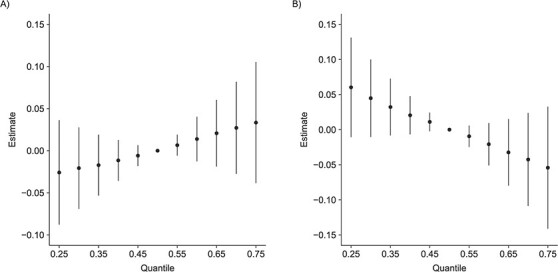
Overall association between the total diet and predicted risk of atherosclerotic cardiovascular disease (ASCVD) among women (A) and men (B) in the CARDIA Study, 1985–2006. The figure shows the expected change in (natural log) predicted ASCVD risk when values for all 12 dietary factors changed simultaneously from their median values to a particular quantile. Bars, 95% credible intervals. CARDIA, Coronary Artery Risk Development in Young Adults.
Figure 2 depicts the component-specific exposure-outcome relationships and potential exposure-exposure interactions. We estimated the changes in the predicted risk for an IQR change in a single dietary factor while fixing all of the other factors at their 25th, 50th (median), or 75th percentiles. Among women (Figure 2A), unprocessed red meat demonstrated the strongest association with the outcome. An IQR increase in unprocessed red meat consumption was associated with a 0.07-unit (95% credible interval (CrI): 0.01, 0.13) increase in (natural log) predicted ASCVD risk when all other dietary factors were fixed at their medians (similar results were obtained when other dietary factors were fixed at their 25th and 75th percentiles). Additionally, starchy vegetables were also weakly associated with increased predicted risk (0.04; 95% CrI: −0.01, 0.09) when all other dietary factors were fixed at their medians (similar results were found with their 25th and 75th percentiles). Among men (Figure 2B), for an IQR increase in fruit consumption, (natural log) predicted ASCVD risk changed by −0.09 units (95% CrI: −0.16, −0.02), −0.10 units (95% CrI: −0.16, −0.03), and −0.11 units (95% CrI: −0.18, −0.04), respectively, when all other dietary components were set at their 25th, 50th, and 75th percentiles. A similar change in the predicted risk was estimated for an IQR increase in whole-grain consumption: –0.07 units (95% CrI: −0.14, 0.00), −0.08 units (95% CrI: −0.14, −0.01), and −0.09 units (95% CrI: −0.16, −0.02) when other factors were set to their 25th, 50th, and 75th percentiles, respectively. The associations for both fruits and whole grains appeared stronger at higher percentiles of other dietary factors, suggesting potential interactions among the dietary components.
Figure 2.
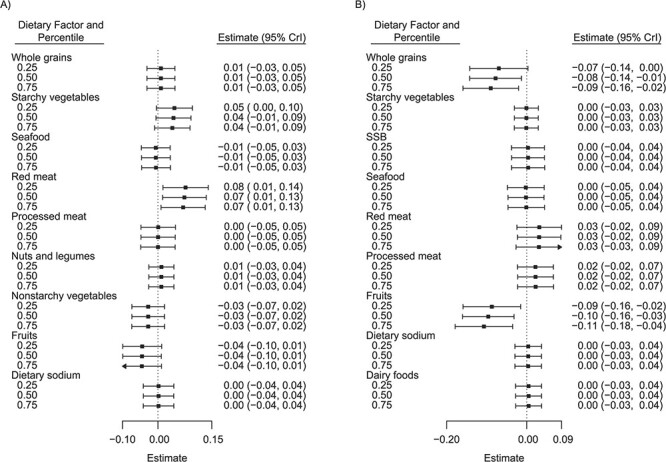
Associations of single dietary components with predicted risk of atherosclerotic cardiovascular disease (ASCVD) among women (A) and men (B) in the CARDIA Study, 1985–2006. The figure shows the estimated change in predicted ASCVD risk for an interquartile range change (25th–75th percentiles) in a single dietary component while all of the other components are fixed at their 25th, 50th (median), or 75th percentiles. The right side of the vertical dotted line indicates a more harmful association, whereas the left side indicates a more protective association. Only dietary components that passed Bayesian kernel machine regression variable selection were plotted. Bars, 95% credible intervals (CrIs). CARDIA, Coronary Artery Risk Development in Young Adults; SSB, sugar-sweetened beverages.
To further investigate the possible pairwise interactions, we plotted the bivariate dose-response functions of a single dietary factor when a second factor was fixed at various percentiles (and the remaining factors were fixed at their medians). The results, shown in Figure 3, suggested an interaction between fruits and whole grains in the association with predicted ASCVD risk among men. In particular, the negative slope for fruits was steeper at higher levels of whole-grain consumption (Figure 3A). The same trend was found for whole grains while fixing fruit consumption at various levels (Figure 3B).
Figure 3.
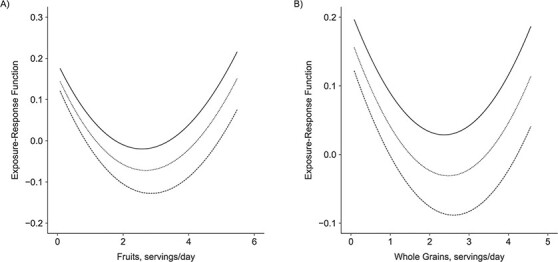
Bivariate exposure-response functions for the relationship of fruit and whole-grain consumption with risk of atherosclerotic cardiovascular disease while all of the other dietary components were fixed at the 50th percentile (median) among men in the CARDIA Study, 1985–2006. The solid, short-dashed, and long-dashed lines represent the dose-response functions when the second dietary factor was fixed at the 25th, 50th, and 75th percentiles, respectively. A) Dose-response function for fruit intake when whole-grain consumption was fixed at the 25th, 50th, and 75th percentiles; B) dose-response function for whole-grain intake when fruit consumption was fixed at the 25th, 50th, and 75th percentiles. CARDIA, Coronary Artery Risk Development in Young Adults.
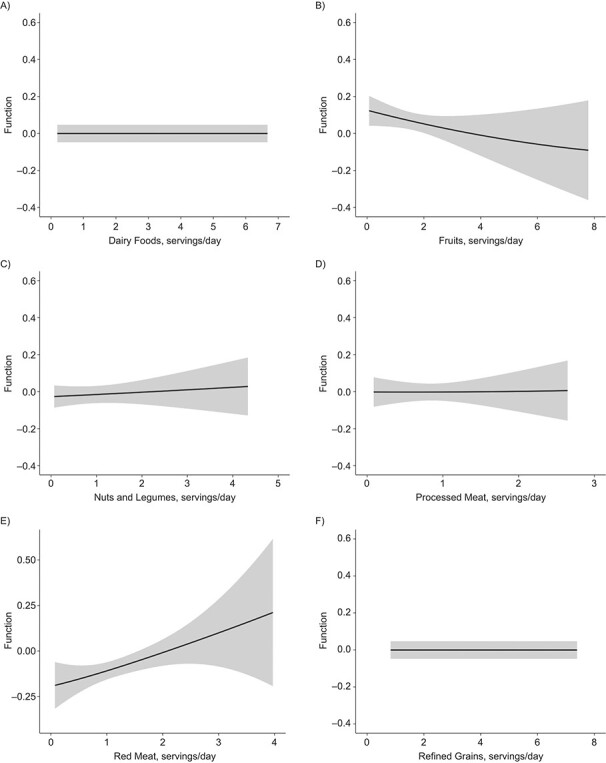
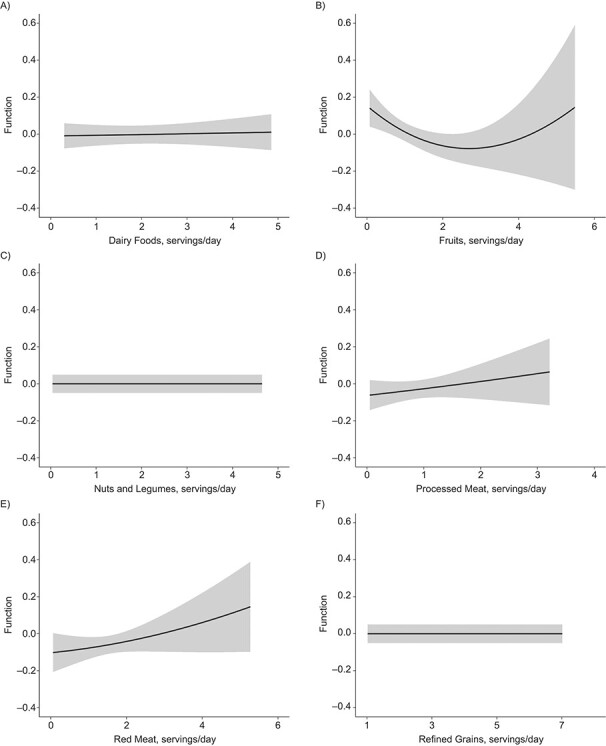
Figures 4 and 5 illustrate the dose-response relationship for each dietary factor while setting the other factors at their median values for women and men, respectively. The plot for women suggests linearly increasing dose-response relationships with the predicted ASCVD risk for unprocessed red meat (Figure 4E) and starchy vegetables (Figure 4I). Results for nonstarchy vegetables (Figure 4J) and fruits (Figure 4B) indicated moderate downward trends. Among men, the plot suggested nonlinear relationships for fruits (Figure 5B) and whole grains (Figure 5K), where the protective association appeared stronger at lower consumption, though there was notable variability at high consumption.
Figure 4 .
Continues
Figure 5 .
Continues
Figure 4.
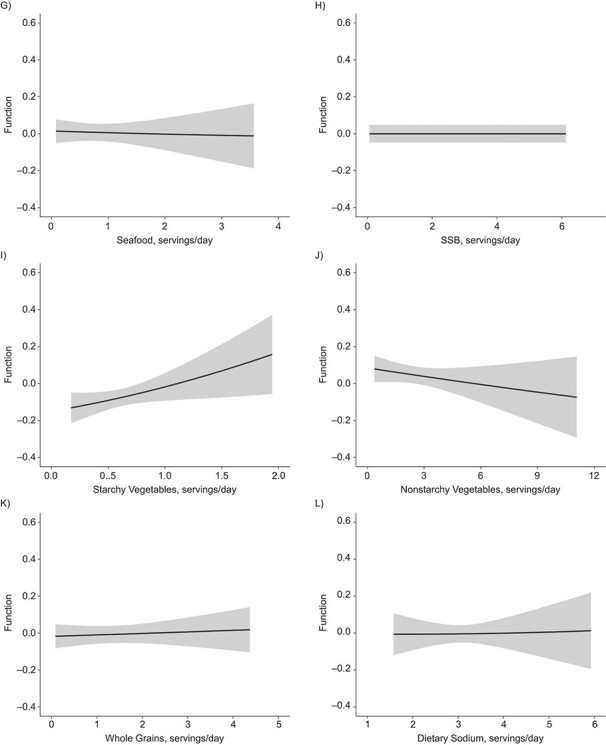
Univariate dose-response functions (solid lines) and 95% credible intervals (shaded areas) for the associations between individual dietary factors and atherosclerotic cardiovascular disease risk (with all of the other factors fixed at their median values) among women in the CARDIA Study, 1985–2006. A) Dairy foods; B) fruits; C) nuts and legumes; D) processed meat; E) red meat; F) refined grains; G) seafood; H) sugar-sweetened beverages (SSB); I) starchy vegetables; J) nonstarchy vegetables; K) whole grains; L) dietary sodium. CARDIA, Coronary Artery Risk Development in Young Adults.
Figure 5.
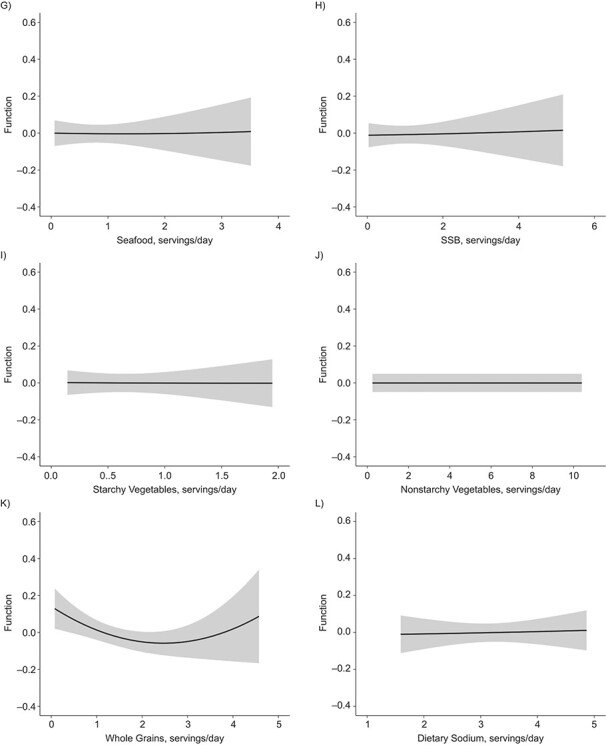
Univariate dose-response functions (solid lines) and 95% credible intervals (shaded areas) for the associations between individual dietary factors and atherosclerotic cardiovascular disease risk (with all other factors fixed at their median values) among men in the CARDIA Study, 1985–2006. A) Dairy foods; B) fruits; C) nuts and legumes; D) processed meat; E) red meat; F) refined grains; G) seafood; H) sugar-sweetened beverages (SSB); I) starchy vegetables; J) nonstarchy vegetables; K) whole grains; L) dietary sodium. CARDIA, Coronary Artery Risk Development in Young Adults.
Last, we assessed the relative importance of dietary factors, indicated by PIPs, through BKMR variable selection (11). PIPs range from 0 to 1, with higher values indicating greater importance. Figure 6 shows that among women (Figure 6A), unprocessed red meat had the highest PIP (0.46), followed by starchy vegetables (0.21), with a clear separation from the other dietary factors (all other PIPs were less than 0.05). Among men (Figure 6B), fruits were estimated to have the highest PIP (0.58), followed by whole grains (0.35) and unprocessed red meat (0.05).
Figure 6.
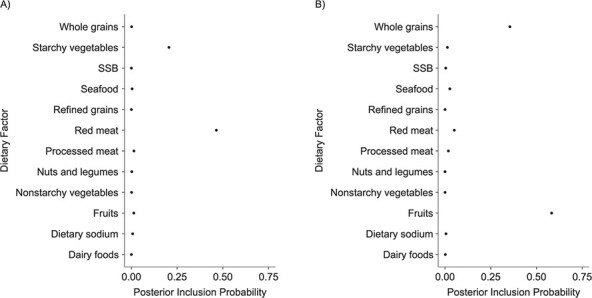
Posterior inclusion probabilities from Bayesian kernel machine regression variable selection, by dietary factor, among women (A) and men (B) in the CARDIA Study, 1985–2006. CARDIA, Coronary Artery Risk Development in Young Adults; SSB, sugar-sweetened beverages.
Results for the sensitivity analyses and the secondary outcome analysis using systolic blood pressure are given in Web Appendices 2 and 4, respectively.
DISCUSSION
Here we report on the novel use of BKMR, a flexible machine-learning approach that models multidimensional exposure-response surfaces to explore the joint, individual, and interactive relationships between cumulative intakes of 12 dietary factors and predicted 10-year risk of ASCVD in a healthy middle-aged US population. The results of the analyses differed by sex due to distinct differences in dietary intakes.
We found that among women, unprocessed red meat was the most crucial dietary component associated with an increased predicted risk, as indicated by the highest PIP and the largest estimate of association. The current evidence for the effects of red meat consumption on cardiometabolic health differs on the basis of study design and duration (25–28). In a meta-analysis of 24 random control trials O’Connor et al. (27) found that daily consumption of a half serving or more (1.25 ounces (35 g)) of total red meat did not influence several CVD risk factors. However, the trials included were conducted over shorter periods of time (2–32 weeks) than our study (about 20 years), and the red meat intakes included both unprocessed and processed meat. On the other hand, prospective cohort studies with more extended follow-up periods found that consumption of unprocessed red meat was significantly associated with the incidence of total and ischemic stroke (28, 29), as well as an increased risk of CVD mortality (26), but not coronary heart disease (30).
Among men, we found that fruit was the dominant protective dietary factor contributing to predicted ASCVD risk, followed by whole grains, both of which demonstrated nonlinearities with the outcome. The independent protective association and the pattern of nonlinearity with a more substantial reduction in CVD risk at lower consumption were consistent with evidence from large-scale meta-analyses of prospective studies (31–35). However, the quantification of the dose-response functions should be interpreted with caution within our study and in comparison with other studies because of the large variability in our estimates at higher levels of consumption and the inconsistent definition of whole grains across studies (31). Furthermore, the 2 dietary factors showed a synergistic interaction, as the dose-response curves of one factor were steeper when the other factor was consumed at higher percentiles. However, to our knowledge, no study has identified an effect of a synergistic interaction between fruit and whole grains on CVD risk, though one has been hypothesized in the context of the Mediterranean diet (36). Future studies could further explore this finding to assess its biological plausibility.
We conducted analyses of BKMR and linear regression using the same set of exposures, outcome, and covariates. Overall, the strengths of associations were consistent between the 2 methods. However, we observed narrower 95% credible intervals from BKMR estimates than from the multicomponent regression model, which may have been due to the confounding effect of the total diet in the regression model. BKMR, in contrast, incorporated the complex structure of the total diet, and therefore produced a less biased estimate and a narrowed 95% credible interval. In addition, BKMR variable selection ranked the contribution of dietary factors to the outcome, which is an important feature given the large number of exposure variables in the model. Traditional linear regression with many exposure variables may produce statistically significant relationships by chance (5). For example, the multicomponent linear regression identified an increasing ASCVD risk with higher nonstarchy vegetable consumption, which contradicts existing evidence (37). In contrast, BKMR did not select the nonstarchy vegetable (PIP = 0), indicating it was not a critical dietary factor related to ASCVD risk.
To our knowledge, our study was the first to apply BKMR to investigate the relationship between the total diet and health outcomes, although this method is increasingly being applied in environmental epidemiology to study the effects of exposure to chemical mixtures on a variety of health outcomes (10, 38–42). BKMR has also been used in parallel with the conventional and other innovative statistical approaches, such as generalized linear regression (10, 38, 39, 41, 42), principal component analysis (41), weighted quantile sum regression (38, 42), and the generalized additive model (10), and has proved to be a complementary tool for elucidating complex exposure-outcome relationships.
Our application of BKMR as a novel tool with which to explore complex nutritional data has several strengths. First, it can estimate the relationship between dietary factors and health outcomes, individually and jointly, in the context of the total diet. Second, it can flexibly model the nonlinear exposure-response functions while accounting for potential interactions among exposure components through a kernel machine representation, which alleviates the issue of model misspecification in the conventional parametric approaches. Further, variable selection allows for ranking of the dietary components in order of their importance to the outcome. The other strengths of our study include the use of cumulative diet measurements to capture long-term dietary habits, the prospective study design, and the inclusion of healthy participants, which reduced the risk of reverse causation between diet and disease.
Some limitations of our approach should also be considered. First, the CARDIA cohort had a low CVD risk (the median predicted 10-year ASCVD risk was 1%, and 90% of the sample were below the threshold for borderline risk (43)) compared with the general US population (44), which may limit the generalizability of our results. Second, 242 male participants were excluded because of missing dietary data. They were at higher predicted ASCVD risk, were younger, were more likely to be African-American, had lower socioeconomic status, and adopted less healthy lifestyles than men without missing dietary data, which may have been a source of bias in the results. Third, while using the predicted 10-year ASCVD risk score may be viewed as a limitation given that it was not a direct observation of CVD outcomes, it has been validated against actual CVD incidence and mortality in US populations similar to our cohort (45) and used in a variety of epidemiologic studies (46–50). We utilized the ASCVD risk score, an outcome of major public health significance relevant to behavioral risk factors, as a representation of preclinical cardiovascular health.
We have extended the application of BKMR, a flexible machine-learning method that allows assessment of the health effects of complex mixtures, from environmental epidemiology to nutritional epidemiology, applying it to assessment of ASCVD risk related to diet in middle-aged Americans. Using this method, we identified unprocessed red meat and fruits as the most important dietary factors contributing to the predicted 10-year risk of ASCVD for female and male CARDIA participants, respectively. Our results were broadly consistent with the existing evidence on which dietary components increase or decrease ASCVD risk. The results from BKMR modeling were more robust than those from standard linear regression, because BKMR provided less biased estimates and narrower 95% credible intervals. These results suggest that BKMR has broad utility for assessment of the diet-disease relationship using large and complex dietary data sets.
Supplementary Material
ACKNOWLEDGMENTS
Author affiliations: Department of Nutrition Epidemiology and Data Science, Friedman School of Nutrition Science and Policy, Tufts University, Boston, Massachusetts, United States (Yi Zhao, Elena N. Naumova, Gitanjali M. Singh); Biostatistics Unit, Kaiser Permanente Washington Health Research Institute, Seattle, Washington, United States (Jennifer F. Bobb); Department of Biostatistics, School of Public Health, University of Washington, Seattle, Washington, United States (Jennifer F. Bobb); and Department of Environmental Health, School of Public Health, Boston University, Boston, Massachusetts, United States (Birgit Claus Henn).
Y.Z. and G.M.S. were supported by grant R00HL124321 from the National Heart, Lung, and Blood Institute.
We thank Dr. Paul Jacques, Dr. Nicola McKeown, Dr. Fangfang Zhang, and Silvia Berciano for their insight and expertise.
Preliminary results of this project were presented at Nutrition 2019, the flagship meeting of the American Society for Nutrition, Baltimore, Maryland, June 8–11, 2019.
Conflict of interest: none declared.
REFERENCES
- 1. Micha R, Peñalvo JL, Cudhea F, et al. Association between dietary factors and mortality from heart disease, stroke, and type 2 diabetes in the United States. JAMA. 2017;317(9):912–924. [DOI] [PMC free article] [PubMed] [Google Scholar]
- 2. Mozaffarian D. Dietary and policy priorities for cardiovascular disease, diabetes, and obesity: a comprehensive review. Circulation. 2016;133(2):187–225. [DOI] [PMC free article] [PubMed] [Google Scholar]
- 3. Joshipura KJ, Ascherio A, Manson JE, et al. Fruit and vegetable intake in relation to risk of ischemic stroke. JAMA. 1999;282(13):1233–1239. [DOI] [PubMed] [Google Scholar]
- 4. Liu S, Manson JE, Lee IM, et al. Fruit and vegetable intake and risk of cardiovascular disease: the Women’s Health Study. Am J Clin Nutr. 2000;72(4):922–928. [DOI] [PubMed] [Google Scholar]
- 5. Hu FB. Dietary pattern analysis: a new direction in nutritional epidemiology. Curr Opin Lipidol. 2002;13(1):3–9. [DOI] [PubMed] [Google Scholar]
- 6. Lynch SR, Cook JD. Interaction of vitamin C and iron. Ann N Y Acad Sci. 1980;355:32–44. [DOI] [PubMed] [Google Scholar]
- 7. Reedy J, Subar AF, George SM, et al. Extending methods in dietary patterns research. Nutrients. 2018;10(5):Article 571. [DOI] [PMC free article] [PubMed] [Google Scholar]
- 8. Gleason PM, Boushey CJ, Harris JE, et al. Publishing nutrition research: a review of multivariate techniques—part 3: data reduction methods. J Acad Nutr Diet. 2015;115(7):1072–1082. [DOI] [PubMed] [Google Scholar]
- 9. Reedy J, Wirfält E, Flood A, et al. Comparing 3 dietary pattern methods—cluster analysis, factor analysis, and index analysis—with colorectal cancer risk: The NIH-AARP Diet and Health Study. Am J Epidemiol. 2010;171(4):479–487. [DOI] [PMC free article] [PubMed] [Google Scholar]
- 10. Valeri L, Mazumdar MM, Bobb JF, et al. The joint effect of prenatal exposure to metal mixtures on neurodevelopmental outcomes at 20–40 months of age: evidence from rural Bangladesh. Environ Health Perspect. 2017;125(6):067015. [DOI] [PMC free article] [PubMed] [Google Scholar]
- 11. Bobb JF, Valeri L, Claus Henn B, et al. Bayesian kernel machine regression for estimating the health effects of multi-pollutant mixtures. Biostatistics. 2015;16(3):493–508. [DOI] [PMC free article] [PubMed] [Google Scholar]
- 12. Cutter GR, Burke GL, Dyer AR, et al. Cardiovascular risk factors in young adults: the CARDIA baseline monograph. Control Clin Trials. 1991;12(1 suppl):1S–77S. [DOI] [PubMed] [Google Scholar]
- 13. Yadlowsky S, Hayward RA, Sussman JB, et al. Clinical implications of revised pooled cohort equations for estimating atherosclerotic cardiovascular disease risk. Ann Intern Med. 2018;169(1):20–29. [DOI] [PubMed] [Google Scholar]
- 14. McDonald A, Van Horn L, Slattery M, et al. The CARDIA Dietary History: development, implementation, and evaluation. J Am Diet Assoc. 1991;91(9):1104–1112. [PubMed] [Google Scholar]
- 15. Liu K, Slattery M, Jacobs D Jr, et al. A study of the reliability and comparative validity of the CARDIA Dietary History. Ethn Dis. 1994;4(1):15–27. [PubMed] [Google Scholar]
- 16. Schakel SF, Sievert YA, Buzzard IM. Sources of data for developing and maintaining a nutrient database. J Am Diet Assoc. 1988;88(10):1268–1271. [PubMed] [Google Scholar]
- 17. Imamura F, Micha R, Khatibzadeh S, et al. Dietary quality among men and women in 187 countries in 1990 and 2010: a systematic assessment. Lancet Glob Health. 2015;3(3):e132–e142. [DOI] [PMC free article] [PubMed] [Google Scholar]
- 18. Rehm CD, Peñalvo JL, Afshin A, et al. Dietary intake among US adults, 1999–2012. JAMA. 2016;315(23):2542–2553. [DOI] [PMC free article] [PubMed] [Google Scholar]
- 19. Willett WC, Howe GR, Kushi LH. Adjustment for total energy intake in epidemiologic studies. Am J Clin Nutr. 1997;65(4 suppl):1220S–1228S. [DOI] [PubMed] [Google Scholar]
- 20. Willett WC, McCullough ML. Dietary pattern analysis for the evaluation of dietary guidelines. Asia Pac J Clin Nutr. 2008;17(suppl 1):75–78. [PubMed] [Google Scholar]
- 21. Goff DC Jr, Lloyd-Jones DM, Bennett G, et al. 2013 ACC/AHA guideline on the assessment of cardiovascular risk: a report of the American College of Cardiology/American Heart Association Task Force on Practice Guidelines. Circulation. 2014;129(25 suppl 2):S49–S73. [DOI] [PubMed] [Google Scholar]
- 22. Jacobs DR Jr, Hahn LP, Haskell WL, et al. Validity and reliability of short physical activity history: CARDIA and the Minnesota Heart Health Program. J Cardiopulm Rehabil. 1989;9(11):448–459. [DOI] [PMC free article] [PubMed] [Google Scholar]
- 23. Bobb JF, Claus Henn B, Valeri L, et al. Statistical software for analyzing the health effects of multiple concurrent exposures via Bayesian kernel machine regression. Environ Health. 2018;17(1):Article 67. [DOI] [PMC free article] [PubMed] [Google Scholar]
- 24. R Core Team . R: A Language and Environment for Statistical Computing. Vienna, Austria: R Foundation for Statistical Computing; 2019. [Google Scholar]
- 25. Cui K, Liu Y, Zhu L, et al. Association between intake of red and processed meat and the risk of heart failure: a meta-analysis. BMC Public Health. 2019;19(1):Article 354. [DOI] [PMC free article] [PubMed] [Google Scholar]
- 26. Abete I, Romaguera D, Vieira AR, et al. Association between total, processed, red and white meat consumption and all-cause, CVD and IHD mortality: a meta-analysis of cohort studies. Br J Nutr. 2014;112(5):762–775. [DOI] [PubMed] [Google Scholar]
- 27. O’Connor LE, Kim JE, Campbell WW. Total red meat intake of ≥0.5 servings/d does not negatively influence cardiovascular disease risk factors: a systemically searched meta-analysis of randomized controlled trials. Am J Clin Nutr. 2017;105(1):57–69. [DOI] [PMC free article] [PubMed] [Google Scholar]
- 28. Yang C, Pan L, Sun C, et al. Red meat consumption and the risk of stroke: a dose-response meta-analysis of prospective cohort studies. J Stroke Cerebrovasc Dis. 2016;25(5):1177–1186. [DOI] [PubMed] [Google Scholar]
- 29. Chen GC, Lv DB, Pang Z, et al. Red and processed meat consumption and risk of stroke: a meta-analysis of prospective cohort studies. Eur J Clin Nutr. 2013;67(1):91–95. [DOI] [PubMed] [Google Scholar]
- 30. Micha R, Wallace SK, Mozaffarian D. Red and processed meat consumption and risk of incident coronary heart disease, stroke, and diabetes mellitus: a systematic review and meta-analysis. Circulation. 2010;121(21):2271–2283. [DOI] [PMC free article] [PubMed] [Google Scholar]
- 31. Aune D, Keum N, Giovannucci E, et al. Whole grain consumption and risk of cardiovascular disease, cancer, and all cause and cause specific mortality: systematic review and dose-response meta-analysis of prospective studies. BMJ. 2016;353:i2716. [DOI] [PMC free article] [PubMed] [Google Scholar]
- 32. Zhang B, Zhao Q, Guo W, et al. Association of whole grain intake with all-cause, cardiovascular, and cancer mortality: a systematic review and dose-response meta-analysis from prospective cohort studies. Eur J Clin Nutr. 2018;72(1):57–65. [DOI] [PubMed] [Google Scholar]
- 33. Chen GC, Tong X, Xu JY, et al. Whole-grain intake and total, cardiovascular, and cancer mortality: a systematic review and meta-analysis of prospective studies. Am J Clin Nutr. 2016;104(1):164–172. [DOI] [PubMed] [Google Scholar]
- 34. Aune D, Giovannucci E, Boffetta P, et al. Fruit and vegetable intake and the risk of cardiovascular disease, total cancer and all-cause mortality—a systematic review and dose-response meta-analysis of prospective studies. Int J Epidemiol. 2017;46(3):1029–1056. [DOI] [PMC free article] [PubMed] [Google Scholar]
- 35. Zhan J, Liu YJ, Cai LB, et al. Fruit and vegetable consumption and risk of cardiovascular disease: a meta-analysis of prospective cohort studies. Crit Rev Food Sci Nutr. 2017;57(8):1650–1663. [DOI] [PubMed] [Google Scholar]
- 36. Jacobs DR Jr, Gross MD, Tapsell LC. Food synergy: an operational concept for understanding nutrition. Am J Clin Nutr. 2009;89(5):1543S–1548S. [DOI] [PMC free article] [PubMed] [Google Scholar]
- 37. Wang X, Ouyang Y, Liu J, et al. Fruit and vegetable consumption and mortality from all causes, cardiovascular disease, and cancer: systematic review and dose-response meta-analysis of prospective cohort studies. BMJ. 2014;349:g4490. [DOI] [PMC free article] [PubMed] [Google Scholar]
- 38. Zhang Y, Dong T, Hu W, et al. Association between exposure to a mixture of phenols, pesticides, and phthalates and obesity: comparison of three statistical models. Environ Int. 2019;123:325–336. [DOI] [PubMed] [Google Scholar]
- 39. Coker E, Chevrier J, Rauch S, et al. Association between prenatal exposure to multiple insecticides and child body weight and body composition in the VHEMBE South African birth cohort. Environ Int. 2018;113:122–132. [DOI] [PMC free article] [PubMed] [Google Scholar]
- 40. Park SK, Zhao Z, Mukherjee B. Construction of environmental risk score beyond standard linear models using machine learning methods: application to metal mixtures, oxidative stress and cardiovascular disease in NHANES. Environ Health. 2017;16(1):Article 102. [DOI] [PMC free article] [PubMed] [Google Scholar]
- 41. Chiu YH, Bellavia A, James-Todd T, et al. Evaluating effects of prenatal exposure to phthalate mixtures on birth weight: a comparison of three statistical approaches. Environ Int. 2018;113:231–239. [DOI] [PMC free article] [PubMed] [Google Scholar]
- 42. Deyssenroth MA, Gennings C, Liu SH, et al. Intrauterine multi-metal exposure is associated with reduced fetal growth through modulation of the placental gene network. Environ Int. 2018;120:373–381. [DOI] [PMC free article] [PubMed] [Google Scholar]
- 43. Arnett DK, Blumenthal RS, Albert MA, et al. 2019 ACC/AHA guideline on the primary prevention of cardiovascular disease: executive summary: a report of the American College of Cardiology/American Heart Association Task Force on Clinical Practice Guidelines. Circulation. 2019;140(11):e563–e595. [DOI] [PMC free article] [PubMed] [Google Scholar]
- 44. Dehmer SP, Maciosek MV, Flottemesch TJ. Aspirin Use to Prevent Cardiovascular Disease and Colorectal Cancer: A Decision Analysis. (U.S. Preventive Services Task Force Evidence Syntheses, formerly Systematic Evidence Reviews). (AHRQ publication no. 15-05229-EF-1). Rockville, MD: Agency for Healthcare Research and Quality; 2015. [PubMed] [Google Scholar]
- 45. Grundy SM, Stone NJ, Bailey AL, et al. 2018 AHA/ACC/AACVPR/AAPA/ABC/ACPM/ADA/AGS/APhA/ASPC/NLA/PCNA guideline on the Management of Blood Cholesterol: a report of the American College of Cardiology/American Heart Association Task Force on Clinical Practice Guidelines. Circulation. 2019;139(25):e1082–e1143. [DOI] [PMC free article] [PubMed] [Google Scholar]
- 46. Boateng D, Galbete C, Nicolaou M, et al. Dietary patterns are associated with predicted 10-year risk of cardiovascular disease among Ghanaian populations: the Research on Obesity and Diabetes in African Migrants (RODAM) Study. J Nutr. 2019;149(5):755–769. [DOI] [PMC free article] [PubMed] [Google Scholar]
- 47. Edwards MK, Crush E, Loprinzi PD. Dietary behavior and predicted 10-year risk for a first atherosclerotic cardiovascular disease event using the pooled cohort risk equations among US adults. Am J Health Promot. 2018;32(6):1447–1451. [DOI] [PubMed] [Google Scholar]
- 48. Mainous AG 3rd, Tanner RJ, Rahmanian KP, et al. Effect of sedentary lifestyle on cardiovascular disease risk among healthy adults with body mass indexes 18.5 to 29.9 kg/m2. Am J Cardiol. 2019;123(5):764–768. [DOI] [PubMed] [Google Scholar]
- 49. Nong Q, Zhang Y, Guallar E, et al. Arsenic exposure and predicted 10-year atherosclerotic cardiovascular risk using the pooled cohort equations in U.S. hypertensive adults. Int J Environ Res Public Health. 2016;13(11):Article 1093. [DOI] [PMC free article] [PubMed] [Google Scholar]
- 50. Vercammen KA, Moran AJ, McClain AC, et al. Food security and 10-year cardiovascular disease risk among U.S. adults. Am J Prev Med. 2019;56(5):689–697. [DOI] [PMC free article] [PubMed] [Google Scholar]
Associated Data
This section collects any data citations, data availability statements, or supplementary materials included in this article.


