Abstract
Background
An accurate diagnosis of deep caries and pulpitis on periapical radiographs is a clinical challenge.
Methods
A total of 844 radiographs were included in this study. Of the 844, 717 (85%) were used for training and 127 (15%) were used for testing the three convolutional neural networks (CNNs) (VGG19, Inception V3, and ResNet18). The performance [accuracy, precision, sensitivity, specificity, and the area under the receiver operating characteristic curve (AUC)] of the CNNs were evaluated and compared. The CNN model with the best performance was further integrated with clinical parameters to see whether multi-modal CNN could provide an enhanced performance. The Gradient-weighted Class Activation Mapping (Grad-CAM) technique illustrates what image feature was the most important for the CNNs.
Results
The CNN of ResNet18 demonstrated the best performance [accuracy =0.82, 95% confidence interval (CI): 0.80–0.84; precision =0.81, 95% CI: 0.73–0.89; sensitivity =0.85, 95% CI: 0.79–0.91; specificity =0.82, 95% CI: 0.76–0.88; and AUC =0.89, 95% CI: 0.86–0.92], compared with VGG19 and Inception V3 as well as the comparator dentists. Therefore, ResNet18 was chosen to integrate with clinical parameters to produce the multi-modal CNN of ResNet18 + C, which showed a significantly enhanced performance (accuracy =0.86, 95% CI: 0.84–0.88; precision =0.85, 95% CI: 0.76–0.94; sensitivity =0.89, 95% CI: 0.83–0.95; specificity =0.86, 95% CI: 0.79–0.93; and AUC =0.94, 95% CI: 0.91–0.97).
Conclusions
The CNN of ResNet18 showed good performance (accuracy, precision, sensitivity, specificity, and AUC) for the diagnosis of deep caries and pulpitis. The multi-modal CNN of ResNet18 + C (ResNet18 integrated with clinical parameters) demonstrated a significantly enhanced performance, with promising potential for the diagnosis of deep caries and pulpitis.
Keywords: Artificial intelligence (AI), deep learning, convolutional neural network (CNNs), caries, pulpitis, carious lesions
Introduction
Dental caries remains the most common chronic disease worldwide and a major global health problem (1). Oral epidemiology findings show that untreated caries in permanent teeth accounts for 65.71% of oral disorders (2). Untreated caries, especially deep caries, can cause pulpitis, necrosis of the pulp, periapical abscess, and tooth loss (3). Though there is still debate regarding the various methods used to treat deep carious lesions, it is agreed that a precise assessment of the depth of carious lesions and the status of the pulp tissue is considered to be of great clinical importance for timely, appropriate treatment (4).
Radiographic penetration is usually used for evaluating caries depth and pulp status to establish a clinical diagnosis (deep caries or pulpits). The depth of carious penetration to the pulp cavity is an important differential factor between deep caries and pulpitis. However, there is little mineral density variation in demineralized tissue of deep carious lesions, which increases the difficulty of accurate clinical diagnosis from radiographs (5). It has been found that carious lesions may not be evident on radiographs until the demineralization is greater than 40% (6). Therefore, the accuracy of visual inspection of the radiographic penetration depth can be significantly influenced by a dental practitioner’s clinical experience; the accuracy rate of experienced clinicians is nearly four times greater than that of inexperienced clinicians (6,7).
Computer-based artificial intelligence (AI) diagnostic systems have been found useful and successful in the clinical diagnosis of eye disorders (8-10), breast cancer (11), oral cancer (12), and periapical pathologies (13). Of the available AI currently used, CNNs have achieved a great success in the field of image recognition (14). They have become a dominant method for recognizing and interpreting image tasks, outperforming even human experts in identifying subtle visual differences in images (14,15). It has been found that CNNs have good accuracy and efficiency in detecting initial caries lesions on bitewings (16-18); however, these studies focused on early carious lesions and only used radiographs as an imaging modality, without integrating with clinical parameters (19).
The study aimed to evaluate and compare three CNNs for analyzing the radiographic penetration depth of carious lesions to assist in clinical diagnosis; the CNN with the best performance was further enhanced and validated by integrating clinical parameters for the automated detection of deep caries and pulpitis.
We present the article following the Standards for Reporting of Diagnostic accuracy studies (STARD) reporting checklist (available at http://dx.doi.org/10.21037/atm-21-119).
Methods
Datasets and pre-processing
All periapical radiographs were collected from the Hospital of Stomatology, Chongqing Medical University, Chongqing, China, between January and December 2019. The study was conducted in accordance with the Declaration of Helsinki (as revised in 2013). The study was approved by the Research Ethics Committee of College of Stomatology, Chongqing Medical University, Chongqing, China [CQHS-REC-2020 (LSNo.158)]. Verbal informed consent was obtained from all patients. The inclusion criteria were: (I) permanent teeth diagnosed as deep caries or pulpitis; (II) accessibility of clinical electronic medical record; (III) accessibility of periapical radiographs; and (IV) periapical radiographs that radiographic penetration depth of caries was more than 3/4 of the dentine thickness. The exclusion criteria were: (I) teeth with a full restorative crown; (II) teeth with abnormal anatomical structures and position; (III) unqualified periapical radiographs with noise, dimness, misshaping, and darkness; (IV) missing important clinical parameters; and (V) teeth with multiple carious lesions. All periapical radiographs were cropped to show only one tooth per image and optimal position. The clinical diagnosis of deep caries or pulpitis was further conducted by a panel of three endodontists with more than ten years clinical experience according to clinical guidelines (20). A total of 844 periapical radiographs were enrolled, and 717 (85%) were randomly selected to train the CNN models, 127 (15%) were used to test the CNN models.
Image digital pre-processing strategies were conducted before training the CNN algorithm: (I) the maxillary teeth were rotated to the direction of the mandibular teeth; (II) the images were uniformly resized to 256×256 pixels and the pixel values were normalized to 0–1 range; (III) a global histogram equalization algorithm of the original periapical radiographs was used to increase the contrast and enhance the clarity of subtle image details. Also, the following data augmentation strategies were used: random rotation (±15°), random panning (±5% in height and width), and random inversion (horizontal and vertical).
CNN models and training
Three pre-trained CNN models, including VGG19, Inception V3 and ResNet18, were used and compared in this study. Because these three models had been widely adopted and recognized as state-of-the-art in both general and medical image classification tasks (21); and these three models were also widely used in in identifying periapical radiographs (22-25). The prediction performance of the three CNN models was evaluated via a five-fold cross-validation and independent test dataset. The training dataset was randomly partitioned into five folds equally. Fold 1 was used as the validation set and the others as the training set. The next set of experiments began with Fold 2 as the validation set and the others as the training set, and then the five-fold cross-validation was conducted in this order.
Instead of training the CNN model from scratch, the initial models were migrated with weights pre-trained on the ImageNet dataset. The last 1,000 nodes fold count (FC) layer was replaced with our specifically designed single FC layer. Meanwhile, the sigmoid function was used as an activation function. The adaptive moment estimation (ADAM) optimizer was used in this study. The training dataset was separated randomly into 16 batches for every epoch, and 300 epochs were run at a learning rate of 0.001. The performance of the model on the validation set was monitored. When the loss of the validation set did not decrease for 40 consecutive rounds, the training was stopped in advance to prevent over-fitting. The whole process of training a CNN consists of two steps including forward propagation and backward propagation. In the training phase, the images were input into the network, the output of the network was used as the classification result through forward propagation, and the loss between the output and the real label was calculated (the binary cross-entropy was selected as the loss function). Then, the model parameters were updated through backward propagation.
Evaluation of the performance of CNNs
The evaluation metrics, including accuracy, precision, sensitivity, specificity, and the AUC were calculated and used to evaluate the performance of CNNs in diagnosing deep caries and pulpitis according to the literature (26). The receiver operating characteristic (ROC) curve plots were the true-positive rate against the false-positive rate as a function of varying discrimination threshold. The AUC was the quantitative assessment of the classification performance of ROC curve.
Comparator dentists
Performance of the CNNs was also compared with a cohort of five dentists with 5–10 years clinical experience. The 127 radiographs used in the testing set were randomly ordered and evaluated by the comparator dentists in a quiet environment following double-blind principle. The same evaluation metrics (that were used for the evaluation of CNNs’ performance) were calculated.
Integration of clinical parameters in the CNN
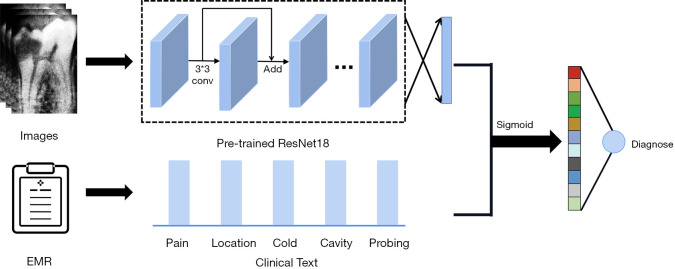
Based on the clinical diagnostic guidelines of the American Association of Endodontists (AAE) (27) and American Dental Association (ADA) (20), clinical parameters should also be included as essential references in the diagnosis process, therefore patients’ clinical conditions were collected, including chief complaint, pain history (spontaneous pain and location of pain), and clinical examination (deep cavity, probing and cold test). The Spearman’s rank correlation coefficient was used to evaluate the correlation within the clinical parameters. The correlation between the clinical factors and imaging factors were also evaluated. For the construction of this multi-modal CNN, these clinical parameters were directly inputted into the penultimate FC layer of the CNN model with the best performance.
Visual explanation of the CNN prediction
Grad-CAM (28) was employed to enable the interpretability of the CNNs’ decisions, to explore what was the most important feature the CNNs screened for in the prediction progress.
Statistical analysis
A two-sided paired t-test was conducted by SPSS 21.0 (IBM, USA) to confirm whether the difference between the model and the dentists’ performance was significant (P value <0.05).
Results
The baseline characteristics of the patients included in this study are summarized in Table 1. A total of 844 patients (523 females and 321 males, mean age 40.81±15.09 years) were enrolled in this study, including 411 patients with deep caries and 433 patients with pulpitis. The clinical parameters, including spontaneous pain, location, cold, deep caries cavity, and exploration probing, are presented in Table 2.
Table 1. Demographic characteristics in this study.
| Characteristic | Deep caries | Pulpitis | Total |
|---|---|---|---|
| Number of patients | 411 | 433 | 844 |
| Female/male | 261/150 | 262/171 | 523/321 |
| Age (mean ± standard deviation) | 37.90±13.43 | 43.57±16.05 | 40.81±15.09 |
Table 2. Clinical parameters.
| Index results | Spontaneous pain | Location | Cold | Deep caries cavity | Exploration probing |
|---|---|---|---|---|---|
| Negative | 438 | 472 | 309 | 488 | 468 |
| Positive | 406 | 372 | 535 | 356 | 376 |
The screening performances of the three models tested in this study were summarized in Table 3. The ResNet18 model showed the best performance, with the highest AUC of 0.89 (95% CI: 0.86–0.92), accuracy of 0.82 (95% CI: 0.80–0.84), precision of 0.81 (95% CI: 0.73–0.89), sensitivity of 0.85 (95% CI: 0.79–0.91), and specificity of 0.82 (95% CI: 0.76–0.88), compared with VGG19, Inception V3, and the comparator dentists. Therefore, ResNet18 was selected to integrate the clinical parameters (Figure 1) to test its performance further.
Table 3. The screening performance of different base models. Date represents mean (95% confidence interval).
| Model | AUC | Accuracy | Precision | Sensitivity | Specificity |
|---|---|---|---|---|---|
| VGGNet | 0.83 [0.79, 0.87] | 0.75 [0.72, 0.78] | 0.76 [0.66, 0.86] | 0.77 [0.71, 0.83] | 0.76 [0.70, 0.82] |
| GoogLeNet | 0.84 [0.80, 0.88] | 0.77 [0.76, 0.78] | 0.78 [0.72, 0.84] | 0.79 [0.75, 0.83] | 0.77 [0.74, 0.80] |
| ResNet | 0.89 [0.86, 0.92] | 0.82 [0.80, 0.84] | 0.81 [0.73, 0.89] | 0.85 [0.79, 0.91] | 0.82 [0.76, 0.88] |
| ResNet+C | 0.94 [0.91, 0.97] | 0.86 [0.84, 0.88] | 0.85 [0.76, 0.94] | 0.89 [0.83, 0.95] | 0.86 [0.79, 0.93] |
| Dentists | – | 0.79 [0.75, 0.83] | 0.81 [0.80, 0.82] | 0.84 [0.83, 0.85] | 0.73 [0.71, 0.75] |
AUC, the area under the ROC (receiver operating characteristic) curve.
Figure 1.
The schematic diagram of ResNet18 + C.
The Spearman correlation coefficients between the clinical factors and imaging factors were all positive, with all P values less than 0.01, indicating that there was a significant positive correlation between the five parameters (Table 4). The conversion from deep caries to pulpitis was positively correlated with the occurrence of spontaneous pain. While the correlation coefficients of spontaneous pain, location, exploration probing and the disease were 0.938, 0.905, and 0.701 [all were greater than 0.7 (29)], suggesting that these three clinical factors were strong factors among the five indicators.
Table 4. The results of Spearman’s rank correlation coefficient of Clinical parameters.
| Parameters | Disease | Spontaneous pain | Location | Cold | Deep caries cavity | Exploration probing |
|---|---|---|---|---|---|---|
| Disease | 1 | |||||
| Spontaneous pain | 0.938** | 1 | ||||
| Location | 0.867** | 0.905** | 1 | |||
| Cold | 0.694** | 0.685** | 0.654** | 1 | ||
| Deep caries cavity | 0.827** | 0.781** | 0.723** | 0.572** | 1 | |
| Exploration probing | 0.858** | 0.854** | 0.795** | 0.633** | 0.701** | 1 |
**P<0.01.
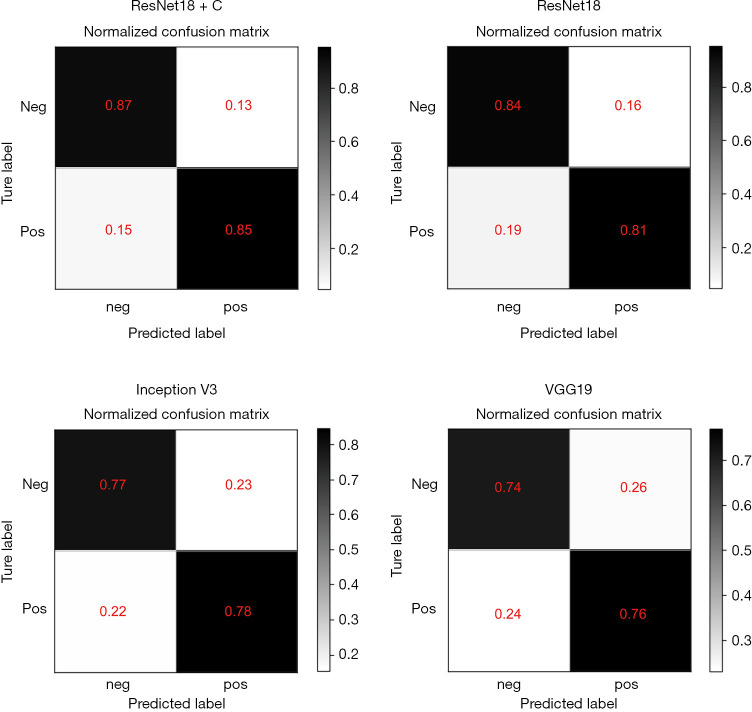
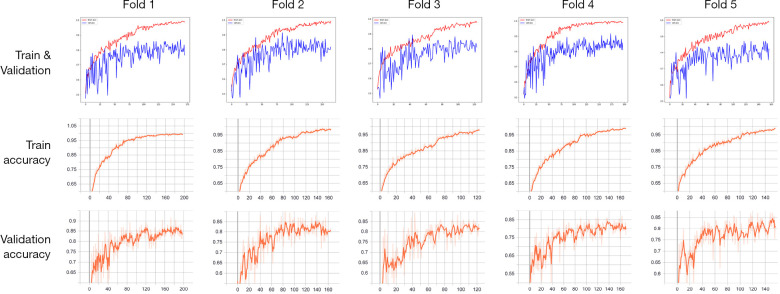
ResNet18 + C (ResNet18 integrated with clinical parameters) showed a significantly enhanced performance compared with ResNet18, with the highest AUC of 0.94 (95% CI: 0.91–0.97), accuracy of 0.86 (95% CI: 0.84–0.88), precision of 0.85 (95% CI: 0.76–0.94), sensitivity of 0.89 (95% CI: 0.83–0.95), and specificity of 0.86 (95% CI: 0.79–0.93) (Table 3 and Figure 2). The normalized confusion matrix was presented in Figure 3, showing the results of the four models prediction results. The training process graph of Resnet18 + C is shown in Figure 4. The red line represents the accuracy over the course of training, and the blue line represents the accuracy over the course of validation.
Figure 2.
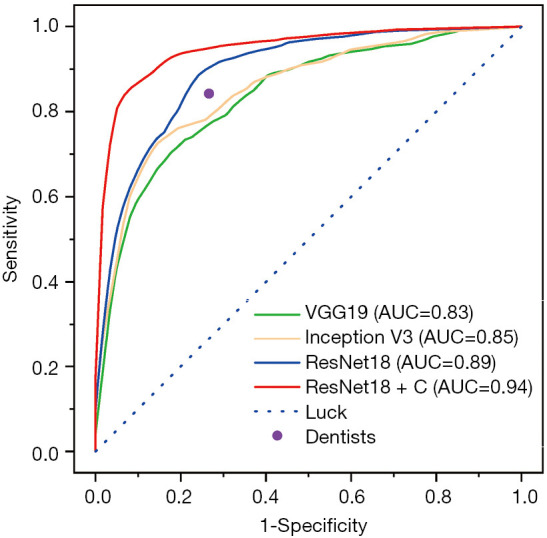
The ROC curve of four models and the accuracy of dentists. The AUC of the four models is labelled. The purple point represents the average levels of comparator dentists.
Figure 3.
The confusion matrix of VGG19, Inception V3, ResNet18 and ResNet18 + C. The black portion represents the agreement between the predicted and actual values. The white portion represents the inconsistency between the predicted and actual values.
Figure 4.
The training and validation curves of ResNet18 + C of five-fold cross validation.
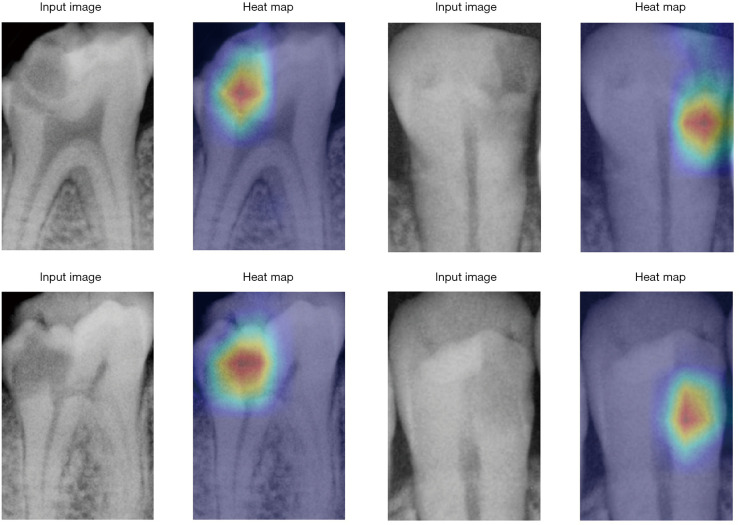
The heatmaps predicted by the Grad-CAM technique were compared with the original radiographs (Figure 5), suggesting that the density reduction area was the main image feature used by the CNNs as a classification.
Figure 5.
Heatmaps predicted by the Grad-CAM technique. The red area represents the main focus point of the deep learning model.
Discussion
An accurate assessment and diagnosis of deep caries and pulpitis from radiographs is clinically challenging. With the rapid development of AI, CNNs have shown good accuracy and efficiency in detecting early interproximal caries lesions on bitewing radiographs (18). This study evaluated and compared three CNNs (VGG19, Inception V3 and ResNet18) for assessing the penetration depth on periapical radiographs for the diagnosis of deep caries and pulpitis and found that ResNet18 had a greater performance (accuracy, precision sensitivity, specificity, and AUC) than VGG19 and Inception V3 as well as the comparator dentists (P=0.001). After integrating clinical parameters, the multi-modal CNN of ResNet18 + C showed significantly enhanced performance, promising potential for clinical diagnosis of deep caries and pulpitis. This was the first study using CNNs to diagnose deep caries and pulpitis to the best of our knowledge.
Remarkable progress has been made in image processing with the development of CNNs, which enable the learning of data-driven, highly representative, hierarchical image features from sufficient training data. A large dataset is usually required to develop and train a CNN model for a robust diagnostic performance (30). The dataset used in this study, and some previous studies (16,17,26), were relatively small due to the cost in time and labour. To address limited clinical samples, it has been recommended to use pre-trained CNN models (31,32) and data augmentation techniques (33) performed in this study.
The evaluation metrics used for assessing the performance of CNNs usually include accuracy, precision, sensitivity, specificity, and AUC. The value of AUC represents the probability of a correct diagnosis and is effective in evaluating the overall diagnostic accuracy (34). An AUC value of 0.8 to 0.9 is considered excellent, and more than 0.9 is considered outstanding. The AUC of ResNet18 + C in this study was 0.94, therefore it could be considered outstanding. The ROC curves contain all thresholds of the predicted results and reflect the performance of CNN models. The closer the ROC curve is to the point [0,1], the higher the probability of accurate diagnosis (34). In this study, the ROC curve of ResNet18 + C was the closest to the point [0,1], which confirmed an outstanding performance.
Clinical examination and periapical radiography are the main methods for evaluating the status of pulp with deep carious lesion, according to the clinical diagnostic guidelines (20). The radiographic penetration depth of caries has been found to be associated with the bacterial penetration level and the inflammatory status of pulp (4). Even for experienced clinicians on a good quality image, it is difficult to accurately distinguish the healthy and diseased areas (35). Visual evaluation of the penetration depth on radiographs can be subjective and influenced by dentists’ clinical experience (35). Using AI, such as CNNs, could capture subtle abnormalities in radiographic images that are generally considered hard to detect with the naked eye, and do not rely on a dentist’s clinical training and experience. In this study, the CNNs of ResNet18 and ResNet18 + C indeed demonstrated greater accuracy and precision than the dentists with 5–10 years clinical experience. The multi-modal CNN (ResNet18 +C), which took the clinical parameters into account, showed the greatest performance, suggesting a potential to serve as an automated tool to assist in the diagnosis of deep caries and pulpitis. In comparison with the other studies of deep learning for caries detection, this study integrated the clinical parameters and periapical radiography, showed significantly better diagnostic performances in predicting deep caries and pulpitis.
Grad-CAM technique is often used for feature visualization to explain what subtle abnormalities on a radiograph are used for decision making (28). Subtle abnormalities in visualization, however, has not been widely used in CNN studies in the field of dentistry. In this study, the Grad-CAM technique was used to visualize the feature area in the decision-making progress of CNNs. This may provide a method to feed-back to dentists during clinical usage of CNNs since it can pinpoint the abnormal areas that a dentist would be interested in.
There were some limitations to this study. Although the diagnosis of the cases included in the study was determined unanimously by a panel of three endodontists with over ten years of clinical experience following clinical guidelines (20), it cannot serve as the gold standard for the diagnosis of deep caries and pulpitis. Histological testing, such as pathological section, has been considered to be the gold standard for diagnosing of deep caries and pulpitis, but it requires the destruction of the tooth and is, therefore, not convenient in clinical practice (36). This study focused on the teeth with single carious lesion. The identification of multiple carious lesions is also an important research direction can be studied in the future research. Further clinical validation should be carried out to verify the ResNet18 and ResNet18+C models to confirm the reliability and further improve practice performance.
Conclusions
The CNN of ResNet18 showed a greater performance (accuracy, precision, and AUC) than VGG19 and Inception V3 and the comparator dentists. The multi-modal CNN (ResNet18 + C), which took the clinical parameters into account, demonstrated significantly enhanced performance, with a promising potential for clinical diagnosis of deep caries and pulpitis.
Supplementary
The article’s supplementary files as
Acknowledgments
Funding: This work was financed by the Chongqing municipal health and Health Committee (2021MSXM209), the Science and Technology Committee of Chongqing Yubei District [(2020)86].
Ethical Statement: The authors are accountable for all aspects of the work in ensuring that questions related to the accuracy or integrity of any part of the work are appropriately investigated and resolved. The study was conducted in accordance with the Declaration of Helsinki (as revised in 2013). The study was approved by the Research Ethics Committee of College of Stomatology, Chongqing Medical University, Chongqing, China [CQHS-REC-2020 (LSNo.158)]. Verbal informed consent was obtained from all patients.
Footnotes
Reporting Checklist: The authors have completed the STARD reporting checklist. Available at http://dx.doi.org/10.21037/atm-21-119
Data Sharing Statement: Available at http://dx.doi.org/10.21037/atm-21-119
Conflicts of Interest: All authors have completed the ICMJE uniform disclosure form (available at http://dx.doi.org/10.21037/atm-21-119). The authors have no conflicts of interest to declare.
References
- 1.Selwitz RH, Ismail AI, Pitts NB. Dental caries. Lancet 2007;369:51-9. 10.1016/S0140-6736(07)60031-2 [DOI] [PubMed] [Google Scholar]
- 2.Bernabe E, Marcenes W, Hernandez CR, et al. Global, Regional, and National Levels and Trends in Burden of Oral Conditions from 1990 to 2017: A Systematic Analysis for the Global Burden of Disease 2017 Study. J Dent Res 2020;99:362-73. 10.1177/0022034520908533 [DOI] [PMC free article] [PubMed] [Google Scholar]
- 3.Seltzer S, Bender IB, Ziontz M. The dynamics of pulp inflammation: correlations between diagnostic data and actual histologic findings in the pulp. Oral Surg Oral Med Oral Pathol 1963;16:969-77. 10.1016/0030-4220(63)90201-9 [DOI] [PubMed] [Google Scholar]
- 4.Demant S, Dabelsteen S, Bjørndal L. A macroscopic and histological analysis of radiographically well-defined deep and extremely deep carious lesions: carious lesion characteristics as indicators of the level of bacterial penetration and pulp response. Int Endod J 2021;54:319-30. 10.1111/iej.13424 [DOI] [PubMed] [Google Scholar]
- 5.Önem E, Baksi BG, Şen BH, et al. Diagnostic accuracy of proximal enamel subsurface demineralization and its relationship with calcium loss and lesion depth. Dentomaxillofac Radiol 2012;41:285-93. 10.1259/dmfr/55879293 [DOI] [PMC free article] [PubMed] [Google Scholar]
- 6.Joss C. Oral radiology. Principles and interpretation, 6th edition (2008). Eur J Orthod 2009;31:214. [Google Scholar]
- 7.Geibel MA, Carstens S, Braisch U, et al. Radiographic diagnosis of proximal caries—influence of experience and gender of the dental staff. Clin Oral Investig 2017;21:2761-70. 10.1007/s00784-017-2078-2 [DOI] [PubMed] [Google Scholar]
- 8.Medeiros FA, Jammal AA, Thompson AC. From Machine to Machine: An OCT-Trained Deep Learning Algorithm for Objective Quantification of Glaucomatous Damage in Fundus Photographs. Ophthalmology 2019;126:513-21. 10.1016/j.ophtha.2018.12.033 [DOI] [PMC free article] [PubMed] [Google Scholar]
- 9.Bogunović H, Montuoro A, Baratsits M, et al. Machine Learning of the Progression of Intermediate Age-Related Macular Degeneration Based on OCT Imaging. Invest Ophthalmol Vis Sci 2017;58:BIO141-BIO150. 10.1167/iovs.17-21789 [DOI] [PubMed] [Google Scholar]
- 10.Xie Y, Nguyen QD, Hamzah H, et al. Artificial intelligence for teleophthalmology-based diabetic retinopathy screening in a national programme: an economic analysis modelling study. Lancet Digit Health 2020;2:e240-9. 10.1016/S2589-7500(20)30060-1 [DOI] [PubMed] [Google Scholar]
- 11.Zheng X, Yao Z, Huang Y, et al. Deep learning radiomics can predict axillary lymph node status in early-stage breast cancer. Nat Commun 2020;11:1236. 10.1038/s41467-020-15027-z [DOI] [PMC free article] [PubMed] [Google Scholar]
- 12.Fu Q, Chen Y, Li Z, et al. A deep learning algorithm for detection of oral cavity squamous cell carcinoma from photographic images: A retrospective study. EClinicalMedicine 2020;27:100558. 10.1016/j.eclinm.2020.100558 [DOI] [PMC free article] [PubMed] [Google Scholar]
- 13.Ekert T, Krois J, Meinhold L, et al. Deep Learning for the Radiographic Detection of Apical Lesions. J Endod 2019;45:917-22. 10.1016/j.joen.2019.03.016 [DOI] [PubMed] [Google Scholar]
- 14.LeCun Y, Bengio Y, Hinton G. Deep learning. Nature 2015;521:436-44. 10.1038/nature14539 [DOI] [PubMed] [Google Scholar]
- 15.Srinidhi CL, Ciga O, Martel AL. Deep neural network models for computational histopathology: A survey. Med Image Anal 2021;67:101813. 10.1016/j.media.2020.101813 [DOI] [PMC free article] [PubMed] [Google Scholar]
- 16.Schwendicke F, Elhennawy K, Paris S, et al. Deep learning for caries lesion detection in near-infrared light transillumination images: A pilot study. J Dent 2020;92:103260. 10.1016/j.jdent.2019.103260 [DOI] [PubMed] [Google Scholar]
- 17.Casalegno F, Newton T, Daher R, et al. Caries Detection with Near-Infrared Transillumination Using Deep Learning. J Dent Res 2019;98:1227-33. 10.1177/0022034519871884 [DOI] [PMC free article] [PubMed] [Google Scholar]
- 18.Cantu AG, Gehrung S, Krois J, et al. Detecting caries lesions of different radiographic extension on bitewings using deep learning. J Dent 2020;100:103425. 10.1016/j.jdent.2020.103425 [DOI] [PubMed] [Google Scholar]
- 19.Baltrusaitis T, Ahuja C, Morency LP. Multimodal Machine Learning: A Survey and Taxonomy. IEEE Trans Pattern Anal Mach Intell 2019;41:423-43. 10.1109/TPAMI.2018.2798607 [DOI] [PubMed] [Google Scholar]
- 20.Young DA, Nový BB, Zeller GG, et al. The American Dental Association Caries Classification System for clinical practice: a report of the American Dental Association Council on Scientific Affairs. J Am Dent Assoc 2015;146:79-86. 10.1016/j.adaj.2014.11.018 [DOI] [PubMed] [Google Scholar]
- 21.Litjens G, Kooi T, Bejnordi BE, et al. A survey on deep learning in medical image analysis. Med Image Anal 2017;42:60-88. 10.1016/j.media.2017.07.005 [DOI] [PubMed] [Google Scholar]
- 22.Kim JE, Nam NE, Shim JS, et al. Transfer Learning via Deep Neural Networks for Implant Fixture System Classification Using Periapical Radiographs. J Clin Med 2020;9:1117. 10.3390/jcm9041117 [DOI] [PMC free article] [PubMed] [Google Scholar]
- 23.Lee JH, Kim DH, Jeong SN, et al. Diagnosis and prediction of periodontally compromised teeth using a deep learning-based convolutional neural network algorithm. J Periodontal Implant Sci 2018;48:114-23. 10.5051/jpis.2018.48.2.114 [DOI] [PMC free article] [PubMed] [Google Scholar]
- 24.Lee JH, Kim DH, Jeong SN, et al. Detection and diagnosis of dental caries using a deep learning-based convolutional neural network algorithm. J Dent 2018;77:106-11. 10.1016/j.jdent.2018.07.015 [DOI] [PubMed] [Google Scholar]
- 25.Lee DW, Kim SY, Jeong SN, et al. Artificial Intelligence in Fractured Dental Implant Detection and Classification: Evaluation Using Dataset from Two Dental Hospitals. Diagnostics (Basel) 2021;11:233. 10.3390/diagnostics11020233 [DOI] [PMC free article] [PubMed] [Google Scholar]
- 26.Lee KS, Jung SK, Ryu JJ, et al. Evaluation of Transfer Learning with Deep Convolutional Neural Networks for Screening Osteoporosis in Dental Panoramic Radiographs. J Clin Med 2020;9:392. 10.3390/jcm9020392 [DOI] [PMC free article] [PubMed] [Google Scholar]
- 27.Mejre IA, Axelsson S, Davidson T, et al. Diagnosis of the condition of the dental pulp: a systematic review. Int Endod J 2012;45:597-613. 10.1111/j.1365-2591.2012.02016.x [DOI] [PubMed] [Google Scholar]
- 28.Selvaraju RR, Cogswell M, Das A, et al. Grad-CAM: Visual Explanations from Deep Networks via Gradient-Based Localization. Int J Comput Vis 2020;128:336-59. 10.1007/s11263-019-01228-7 [DOI] [Google Scholar]
- 29.Rumsey DJ. Statistics for dummies 2nd ed. Hoboken, NJ: Wiley Publishing, 2011. [Google Scholar]
- 30.Gulshan V, Peng L, Coram M, et al. Development and Validation of a Deep Learning Algorithm for Detection of Diabetic Retinopathy in Retinal Fundus Photographs. JAMA 2016;316:2402-10. 10.1001/jama.2016.17216 [DOI] [PubMed] [Google Scholar]
- 31.Yildirim O, Talo M, Ay B, et al. Automated detection of diabetic subject using pre-trained 2D-CNN models with frequency spectrum images extracted from heart rate signals. Comput Biol Med 2019;113:103387. 10.1016/j.compbiomed.2019.103387 [DOI] [PubMed] [Google Scholar]
- 32.Ma J, Wu F, Zhu J, et al. A pre-trained convolutional neural network based method for thyroid nodule diagnosis. Ultrasonics 2017;73:221-30. 10.1016/j.ultras.2016.09.011 [DOI] [PubMed] [Google Scholar]
- 33.Shin HC, Roth HR, Gao M, et al. Deep convolutional neural networks for computer-aided detection: CNN architectures, dataset characteristics and transfer learning. IEEE Trans Med Imaging 2016;35:1285-98. 10.1109/TMI.2016.2528162 [DOI] [PMC free article] [PubMed] [Google Scholar]
- 34.Mandrekar JN. Receiver Operating Characteristic Curve in Diagnostic Test Assessment. J Thorac Oncol 2010;5:1315-6. 10.1097/JTO.0b013e3181ec173d [DOI] [PubMed] [Google Scholar]
- 35.Shah N. Dental caries: the disease and its clinical management, 2nd edition. Br Dent J 2009;206:498. [Google Scholar]
- 36.Yang V, Zhu Y, Curtis D, et al. Thermal Imaging of Root Caries In Vivo. J Dent Res 2020;99:1502-8. 10.1177/0022034520951157 [DOI] [PMC free article] [PubMed] [Google Scholar]
Associated Data
This section collects any data citations, data availability statements, or supplementary materials included in this article.
Supplementary Materials
The article’s supplementary files as


