

Abstract
Purpose.
Among adults with disabilities, we examined whether increasing levels of psychological distress were associated with higher estimated prevalences of chronic conditions, obesity, health care access, and use of preventive services.
Methods.
We analyzed data from the 2007 Behavioral Risk Factor Surveillance System. The Kessler-6 scale was used to assess psychological distress.
Results.
Increasing levels of psychological distress were associated with an increased prevalence of chronic diseases and conditions, and decreased access to health care and utilization of preventive services in keeping with what has been established for non-disabled populations. Among adults with disabilities, aged 18–64 years and 65 years or older, increasing levels of distress were also associated with increased receipt of mental health treatment. However, compared to adults aged 18–64 years, larger proportions of older adults reported non-receipt of mental health treatment (mild to moderate psychological distress: 58.0% versus 70.6%; serious psychological distress: 40.5% versus 54.5%).
Conclusions.
While adults with disabilities who had increased levels of psychological distress were more likely to receive mental health services, they also had higher estimated prevalences of chronic conditions, barriers to health care, and non-receipt of preventive cancer screenings.
Keywords: Psychological distress, mental health, disability, BRFSS, surveillance
In the U.S., 54 million people are estimated to have disabilities, a number projected to double by the year 2050.1,2 Efforts to ensure health and quality of life among people with disabilities are crucial not only from a public health perspective but also from an economic perspective. Notably, it has been over a decade since the U.S. Department of Health and Human Services’ Healthy People (HP) series3 established a specific goal to promote the health and well-being of people with disabilities. Yet, despite the efforts of our nation’s public health leaders and stakeholders, population-based surveillance data provide evidence of insufficient progress toward the elimination of health disparities between people with and without disabilities, as well as among subgroups (e.g., groups defined in terms of sex, race/ethnicity, primary disabling condition, and secondary condition) of those with disabilities.4,5
Among people with disabilities—regardless of the disability’s origin, its onset date, and whether it is mental and/or physical—the prevention or detection and treatment of secondary conditions are vital for the maintenance of health, for halting the progression of disability, for continued participation in valued life activities, and for the reduction of health disparities.2 Serious psychological distress (SPD), as assessed by the Kessler–6 (K6) scale of nonspecific psychological distress, is a secondary condition that is more prevalent among adults with disabilities than those without.6–10. Mental disorders, such as SPD, may also be the primary disabling condition. Researchers have found that people in poor health, or who perceive their health to be poor, have an increased risk of psychological distress.11,12 Indeed, the relationship between poor health status and psychological distress is bi-directional;11,12 that is, poor physical health can affect mental health and poor mental health can affect physical health. SPD, and its symptomatology, have been found to be associated with adverse health behaviors, health care avoidance and non-compliance, increased activity limitation, impaired quality of life, worse health outcomes, and early death.6–10,13–19
Psychological distress exists on a continuum, with SPD a socially constructed artifact related to policy.20–22 Specifically, the K6 scale, with a cut-point of 13, was selected by the Substance Abuse and Mental Health Administration as an efficient screening scale to obtain one-year estimated prevalences of SPD.20,21 The K6 scale also identifies individuals with subclinical illness who may not meet the formal criteria for SPD.20 Validated for use in general-purpose epidemiologic surveys, the K6 scale has been used by agencies in Australia, Canada, and the United States, and recommended for use in several other countries with the usage of optimal scaling rules.8,11,13–15,23–26
While it is essential for clinical and non-clinical (e.g., resource allocation) reasons to obtain estimated prevalences of SPD, other cut-points along the continuum of psychological distress may also identify population sub-groups at risk for or experiencing poor mental health, such as adults with disabilities.27–29 For example, among adults aged 65 years or older with visual impairment and depressive symptoms, the adjusted odds of having fair or poor health increased gradually with increased severity of depressive symptoms, from 6.2 for those with mild depressive symptoms, to 18.0 for those with moderate depressive symptoms, and to 26.5 for those with severe depressive symptoms.30 Kessler et al.31 have shown that sub-clinical levels of mental illness are of considerable public health importance because of their high prevalence, disease burden, and risk of progression to serious mental illness with attendant outcomes, such as hospitalization, work disability, and attempted suicide. Lower levels of psychological distress may also be associated with chronic physical conditions and decreased access to and use of health care services, posing a “triple play” that, combined, contributes to the health disparities experienced by people with disabilities.
Regardless of these research findings, there is continued debate over the appropriate-ness of early diagnosis and treatment of mental disorders with psychosocial and drug interventions among mental health professionals.32,33 Nevertheless, other population-based strategies exist to prevent or minimize psychological distress. For example, physical activity, well known for its overall health benefits, may prevent or delay psychological distress, reduce its severity, and, as a monotherapy or adjunct treatment, cause and maintain its remission.12,34–37 Even so, participating in an active lifestyle with a disability can be challenging in and of itself due to personal (e.g., strength, endurance, balance, pain, self-consciousness about exercising in public, and lack of self-efficacy) and environmental barriers (e.g., lack of qualified trainers, lack of transportation, lack of accessible exercise equipment and venues, and cost).38,39 For adults with disabilities and psychological distress, additional support mechanisms may need to be incorporated into treatment protocols to assist patients in becoming physically active and/or maintaining a physically active lifestyle.
We used 2007 Behavioral Risk Factor Surveillance System data to examine the health status of community-dwelling adults with self-reported disabilities by level of psychological distress. Specifically, we sought to examine whether increasing levels of psychological distress are associated with higher estimated prevalences of obesity and seven physical chronic diseases and conditions, and lower rates of access to and use of health services as has been shown for the general population. We hypothesized that among adults with disabilities, those with mild to moderate psychological distress followed by those with SPD experience greater disparities in health, health care access, and use of preventive services compared with those with no psychological distress.
Methods
Study design.
The BRFSS is an ongoing landline telephone survey conducted by state health departments in collaboration with the Centers for Disease Control and Prevention (CDC) that collects data on many of the behaviors, conditions, and societal determinants of health that place people at risk for illness, disability, and death in the United States. In 2007, a total of 430,912 adults aged 18 years or older from all 50 states, the District of Columbia (DC), and three territories participated in the survey. The 2007 median Council of American Survey and Research Organizations response rate and cooperation rate were 50.6% and 72.1%, respectively.40 All BRFSS questionnaires, data, and reports are available at www.cdc.gov/BRFSS.
Ascertainment of disability status.
People with disabilities were identified based on a “Yes” response to either of two questions, “Are you limited in any way in any activities because of physical, mental, or emotional problems?” or “Do you now have any health problem that requires you to use special equipment, such as a cane, wheelchair, special bed, or special telephone?” Study participants for whom responses to both questions were missing or who answered “Don’t know/Not sure” or who refused to respond were excluded from the analysis. A disability status variable was constructed that included adults who indicated that they (1) had activity limitations and also used an assistive device, (2) had activity limitations only, or (3) used an assistive device but did not have activity limitations.
Ascertainment of psychological distress severity.
In 2007, 35 states, the District of Columbia, and Puerto Rico administered an optional BRFSS Mental Illness and Stigma (MIS) Module that contained the K6 scale of nonspecific psychological distress.20 The BRFSS version of the K6 measures the 30-day prevalence of six symptoms of psychological distress. Specifically, the K6 scale consists of six questions that query respondents on how frequently they experienced the following symptoms of psychological distress in the previous 30 days: 1) nervousness, 2) hopelessness, 3) restlessness, 4) worthlessness, 5) effortfulness, and 6) so depressed that nothing could cheer them up. Possible response options and associated scores are: All of the time—4, Most of the time—3, Some of the time—2, A little of the time—1, and None of the time—0, with Don’t know/Not sure responses, refusals to respond, and missing responses excluded from the analysis. Response scores were summed to yield a total score from 0 to 24 with increasing scores reflecting increasing severity of psychological distress. A total K6 score of 13 or greater indicated SPD in the 30 days preceding the interview—identifying adults with disabilities who are likely to meet the formal criteria for severe anxiety or depressive disorders.21 A total K6 score of eight to 12 indicated probable mild to moderate psychological distress in the 30 days preceding the interview—identifying adults with disabilities with subclinical illness (MPD; K6 = 8 to 12).41 Finally, a total K6 score of zero to seven indicated no psychological distress in the 30 days preceding the interview (NPD; K6 = 0 to 7).41 These three categories are used by the CDC’s Disability and Health Data System,42 which includes psychological distress status as a core indicator, and have been used by other researchers to examine various health-related measures associated with increasing levels of psychological distress.20,41,43,44 In addition, previous research has shown that these three categories accurately classify adults into those with mild to moderate or serious mental illness based on blinded clinical reappraisal interviews using the Structured Clinical Interview for DSM-IV (SCID)45 as the gold standard.
Sociodemographic characteristics and outcome variables.
Respondents were asked their age (18–24, 25–34, 35–44, 45–54, 55–64, 65–74, and 75 years or older), sex, race/ethnicity (non-Hispanic [NH] White, NH Black/African American, Hispanic, and NH other race), education (less than high school diploma, high school graduate or GED, some college or technical school, and college graduate), employment (employed, unemployed, homemaker or student, retired, and unable to work), and marital status (married, previously married, never married, and member of an unmarried couple).
For this study, we examined seven chronic diseases or conditions, obesity, and health care access and use determinants by level of psychological distress.
Seven physical chronic diseases and conditions were examined: arthritis, asthma, coronary heart disease, diabetes, hypertension, high cholesterol, and stroke. A composite score of these chronic conditions was formed, ranging from 0 to 7. This variable was then recoded into six groups based on the total number of conditions each study participant reported (i.e., 0, 1, 2, 3, 4, and 5–7). Study participants who refused to answer, had a missing answer, or who answered Don’t know/Not sure to any of the seven assessed conditions were excluded from the calculation of this variable. We used data on self-reported weight and height to calculate body mass index (BMI). Study participants were classified as obese if their BMI was ≥30 kg/m2.
Five health care access outcomes were examined in this study. Having a usual source of health care was assessed with the question, “Do you have one person you think of as your personal doctor or health care provider?” Responses were dichotomized into (i) one or more than one and (ii) none. Not having a cost barrier to health care was assessed with the question, “Was there a time in the past 12 months when you needed to see a doctor but could not because of cost?” Possession of health insurance coverage was determined through the question, “Do you have any kind of health care coverage, including health insurance, prepaid plans such as HMOs, or government plans such as Medicare?” Current receipt of treatment for a mental health condition or emotional problem was assessed with the question, “Are you now taking medicine or receiving treatment from a doctor or other heath professional for any type of mental health condition or emotional problem?” Receipt of a routine check-up within the past five years was assessed with the question, “About how long has it been since you last visited a doctor for a routine checkup?”
We examined five preventive service outcomes: influenza vaccination in the past year, pneumococcal vaccination, colorectal cancer screening among adults aged 50 to 75 years (i.e., fecal occult blood test in the past year or lower endoscopy [sigmoidoscopy or colonoscopy] in the preceding 10 years), mammography within two years for women aged 40 years or older, and cervical cancer screening within three years for women aged 21 to 64 years.
The questions used to assess receipt of an annual influenza vaccination and ever having received a pneumococcal vaccination were in the core BRFSS instrument; therefore, all 35 states, the District of Columbia, and Puerto Rico who administered the optional BRFSS MIS Module also had data on receipt of these two vaccines. However, the questions used to assess receipt of a colorectal cancer screening, breast cancer screening, and cervical cancer screening were contained in two optional BRFSS modules: the Colorectal Cancer Screening Module and the Women’s Health Module. Thus, receipt of a colorectal cancer screening are based on data from seven states (Hawaii, Iowa, Maine, Nebraska, Oklahoma, Vermont, and Washington) and receipt of a breast cancer screening and cervical cancer screening are based on data from six states (Arkansas, Georgia, Hawaii, Nebraska, Nevada, and Wyoming).
Statistical analysis.
We used SAS46 and SAS-callable SUDAAN47 in all analyses to account for the complex survey design of the BRFSS. We used the chi-square test to assess differences between the categorical variables and levels of psychological distress. We used SUDAAN’s MULTILOG47 to obtain unadjusted estimates, adjusted predicted marginals, and adjusted prevalence ratios (APRs) and 95% confidence intervals (CIs). Specifically, we used multinomial logistic regression analysis to estimate predicted marginals by level of psychological distress (i.e., 0 to 7, 8 to 12, 13 or greater) in association with each sociodemographic characteristic, and to estimate APRs for level of psychological distress (i.e., 0 to 7 [no distress, referent group], 8 to 12, and 13 or greater) in association with total number of chronic diseases and conditions. We used binomial logistic regression analysis to estimate predictive marginals and APRs48 for each outcome variable (i.e., chronic diseases or conditions [e.g., arthritis versus no arthritis]; obesity [BMI ≥ 30 versus BMI < 30]; health care access [e.g., no usual source of health care versus usual source of health care]; and preventive services [e.g., non-receipt of annual influenza immunization versus receipt of influenza immunization]). We adjust for demographic and socioeconomic characteristics known to influence health care access and use of preventive services (i.e., age, sex, race/ethnicity, education, marital status, and employment status).49 The models to examine non-receipt of mental health treatment, no routine check-up in the past five years, and five preventive services also included the aforementioned sociodemographic characteristics as covariates as well as health insurance coverage status. To assess the associations between levels of psychological distress and health care access outcomes we conducted stratified analyses by age group (i.e., 18 to 64 years; 65 years or older) due to a relatively small percentage of those aged 65 years or older being uninsured. To assess the associations between levels of psychological distress and preventive service outcomes, we conducted analyses on either the overall sample (e.g., immunizations) or the previously stated age groups and states (e.g., cancer screenings). A p value of <.05 was used to define statistical significance.
Results
Among 52,456 (weighted sample size: 28,389,847) participants with self-reported disabilities aged 18 years or older in the 35 states, the District of Columbia, and Puerto Rico, 38,533 (71.2%) had NPD; 8,139 (16.5%) had MPD; and 5,784 (12.3%) had SPD. A full description of the characteristics of the study population has been previously published.9
Table 1 shows the distribution of population characteristics by severity of psychological distress after adjustment for sociodemographic characteristics (i.e., age, sex, race/ethnicity, educational attainment, marital status, and employment status) among adults with disabilities aged 18 years or older. Compared with females, chi-square analyses revealed that a greater proportion of males had NPD (70.4% versus 72.2%, p < .05). The proportion of adults with disabilities who had either MPD or SPD significantly decreased between ages 25–34 years and 75 years or older (p < 0.001 for trend, respectively). Compared with NH Whites, greater proportions of Hispanics and those of NH other race had MPD (15.7% versus 18.8% and 20.5%, respectively; p < .05 and p < .01, respectively) while a greater proportion of Hispanics had SPD (15.0% versus 11.8%; p < .05). The proportion of adults with disabilities who had either MPD or SPD decreased with increasing levels of education (p < .001 for trend, respectively). Compared with adults with disabilities who were employed, those who were either unable to work or unemployed had the highest proportions with MPD (13.0% versus 23.3% and 21.5%, respectively, p < .001) or SPD (6.2% versus 22.6% and 18.0%, respectively, p < .001). Compared with adults with disabilities who were married, a greater proportion of those who had previously been married had MPD (15.2% versus 17.3%; p < .001) while greater proportions of those who had previously been married or who had never married had SPD (10.6% versus 14.5% and 13.3%, respectively; p < .001 and p < .05, respectively).
Table 1.
ADJUSTEDa DISTRIBUTION OF POPULATION CHARACTERISTICS AMONG U.S. ADULTS AGED 18 YEARS OR OLDER WITH DISABILITY BY LEVEL OF PSYCHOLOGICAL DISTRESS (NONE, MILD TO MODERATE, OR SERIOUS) ASSESSED WITH KESSLER 6 (K6) SCORES, 35 STATES, DC, AND PUERTO RICO, BRFSS, 2007
| Characteristic | Severity of Psychological Distress n = 52,456; N = 28,389,847 |
|||||
|---|---|---|---|---|---|---|
| None (K6 score = 0–7) |
Mild to Moderate (K6 score = 8–12) |
Serious (K6 score = ≥13) |
||||
| n | Weighted % (95% Cl) | n | Weighted % (95% Cl) | n | Weighted % (95% Cl) | |
| AH | 38,533 | 71.2 (70.3–72.0) | 8,139 | 16.5 (15.8–17.2) | 5,784 | 12.3 (11.7–13.0) |
| Sex | ||||||
| Men | 13,851 | 72.2 (70.9–73.6) | 2,609 | 15.7 (14.5–16.9) | 1,884 | 12.1 (11.1–13.2) |
| Women | 24,682 | 70.4 (69.4–71.4) | 5,530 | 17.1 (16.3–18.0) | 3,900 | 12.5 (11.7–13.3) |
| Age (years)* | ||||||
| 18–24 | 446 | 66.4 (60.8–71.6) | 166 | 21.6 (17.0–27.1) | 138 | 12.0 (8.9–16.1) |
| 25–34 | 1,287 | 55.9 (52.0–59.7) | 485 | 25.6 (22.1–29.4) | 390 | 18.5 (15.5–21.9) |
| 35–44 | 3,222 | 63.2 (60.6–65.7) | 1,024 | 18.6 (16.7–20.6) | 897 | 18.3 (16.0–20.7) |
| 45–54 | 6,565 | 67.4 (65.7–69.2) | 1,898 | 17.2 (15.8–18.7) | 1,671 | 15.3 (14.0–16.8) |
| 55–64 | 9,576 | 73.5 (71.9–75.0) | 2,007 | 15.7 (14.4–17.1) | 1,516 | 10.8 (9.8–11.9) |
| 65–74 | 8,054 | 80.3 (78.4–82.1) | 1,219 | 12.7 (11.3–14.2) | 585 | 7.0 (5.6–8.7) |
| ≥75 | 8,984 | 83.4 (81.7–85.0) | 1,249 | 11.3 (9.9–12.8) | 507 | 5.3 (4.4–6.3) |
| Race/Ethnicity* | ||||||
| NH White | 31,650 | 72.5 (71.6–73.4) | 5,949 | 15.7 (15.0–16.5) | 4,030 | 11.8 (11.1–12.5) |
| NH Black/African American | 2,534 | 71.3 (68.3–74.1) | 795 | 16.6 (14.6–18.9) | 577 | 12.1 (9.7–14.9) |
| Hispanic | 1,824 | 66.2 (62.7–69.4) | 663 | 18.8 (16.0–21.9) | 646 | 15.0 (12.8–17.6) |
| NH Otherb | 2,134 | 66.3 (62.7–69.7) | 620 | 20.5 (17.5–24.0) | 462 | 13.1 (11.0–15.6) |
| Education* | ||||||
| <High school | 4,208 | 59.9 (57.4–62.3) | 1,556 | 21.8 (19.7–24.1) | 1,489* | 18.3 (16.6–20.2) |
| High school or GED | 11,874 | 69.8 (68.4–71.2) | 2,872 | 17.1 (16.0–18.2) | 2,096 | 13.1 (12.0–14.2) |
| Some college or technical school | 10,766 | 73.1 (71.7–74.6) | 2,155 | 15.8 (14.5–17.1) | 1,450 | 11.1 (10.1–12.2) |
| College graduate | 11,622 | 77.8 (76.1–79.5) | 1,543 | 13.9 (12.6–15.3) | 733 | 8.3 (6.8–10.1) |
| Employment Status* | ||||||
| Employed | 12,880 | 80.7 (79.3–82.0) | 2,022 | 13.0 (11.9–14.2) | 987 | 6.2 (5.4–7.1) |
| Unemployed | 1,304 | 60.4 (56.7–64.1) | 565 | 21.5 (18.6–24.8) | 539 | 18.0 (15.4–21.0) |
| Retired | 15,631 | 75.5 (73.6–77.3) | 2,090 | 15.0 (13.5–16.5) | 922 | 9.5 (8.2–11.1) |
| Unable to work | 5,444 | 54.1 (52.0–56.1) | 2,740 | 23.3 (21.7–25.1) | 2,903 | 22.6 (20.7–24.6) |
| Homemaker/Student | 3,173 | 72.9 (69.9–75.7) | 701 | 16.4 (14.0–19.2) | 421 | 10.7 (8.7–13.0) |
| Marital Status* | ||||||
| Married | 18,886 | 74.1 (73.0–75.3) | 3,255 | 15.2 (14.3–16.2) | 1,985 | 10.6 (9.8–11.6) |
| Previously married | 15,385 | 67.3 (65.8–68.8) | 3,580 | 18.3 (17.0–19.6) | 2,782 | 14.5 (13.4–15.6) |
| Never married | 3,494 | 69.4 (66.7–71.9) | 1,092 | 17.3 (15.4–19.5) | 857 | 13.3 (11.3–15.5) |
| Unmarried couple | 656 | 66.0 (60.7–70.9) | 194 | 19.2 (14.1–25.6) | 144 | 14.8 (10.9–19.8) |
p < .001 indicates significant group differences.
Adjusted for age, sex, race/ethnicity, educational attainment, marital status, and employment status.
non-Hispanic Other includes non-Hispanic American Indian/Alaska Native; non-Hispanic Asian, Native Hawaiian or Pacific Islander; non-Hispanic Multiracial; and non-Hispanic other race.
BRFSS = Behavioral Risk Factor Surveillance System
CI = Confidence Interval;
DC = District of Columbia
K6, Kessler 6
n = Unweighted Sample Size
N = Weighted Sample Size
NH = non-Hispanic.
Chronic diseases and conditions and obesity. As seen in Table 2, among adults with disabilities, those with MPD and SPD had higher unadjusted estimates of two of the seven chronic diseases and conditions (i.e., asthma and stroke) as well as obesity compared with those with NPD. Adults with disabilities and SPD also had higher unadjusted estimates of coronary heart disease, diabetes, and high cholesterol. After adjustment for sociodemographic characteristics, among adults with disabilities, those with SPD had higher prevalence rates for the seven chronic diseases and conditions examined than those with NPD, and those with MPD had higher prevalence rates for six of the conditions (with the exception of diabetes) (Table 3). After adjustment for confounders, the association between obesity and severity of psychological distress was statistically non-significant.
Table 2.
SEVEN CHRONIC CONDITIONS AND OBESITY AMONG ADULTS AGED 18 YEARS OR OLDER WITH DISABILITY BY LEVEL OF PSYCHOLOGICAL DISTRESS, 35 STATES, DC, AND PUERTO RICO, BRFSS, 2007
| None (K6 score = 0–7) |
Mild to Moderate (K6 score = 8–12) |
Serious (K6 score ≥13) |
P-value for trend | |
|---|---|---|---|---|
| % (95% CI) | % (95% CI) | % (95% CI) | ||
| Arthritis (n = 52,198) | 57.9 (56.9–58.9) | 56.7 (54.3–59.0) | 58.4 (55.3–61.4) | .74 |
| Asthma (n = 51,949) | 13.8 (13.1–14.5) | 19.3 (17.6–21.1)* | 23.1 (20.9–25.5)* | <.001 |
| Coronary heart disease (n = 51,074) | 15.2 (14.6–15.9) | 15.4 (14.0–16.9) | 19.7 (17.6–22.0)* | <.001 |
| Diabetes (n = 52,390) | 17.2 (16.5–18.0) | 18.7 (17.1–20.3) | 21.0 (19.0–23.2)* | <.001 |
| Hypertension (n = 52,335) | 46.2 (45.2–47.2) | 45.4 (43.2–47.7) | 48.8 (45.9–51.7) | .10 |
| High cholesterol (n = 46,726) | 48.3 (47.3–49.3) | 50.5 (48.0–52.9) | 59.1 (56.3–61.9)* | <.001 |
| Stroke (n = 52,141) | 7.1 (6.6–7.6) | 9.5 (8.4–10.7)* | 9.2 (8.0–10.5)** | <.001 |
| Obesity (n = 49,425) | 35.9 (34.9–36.9) | 39.1 (36.7–41.5)*** | 42.3 (39.4–45.2)* | <.001 |
p < .001
P < .01
P < .05 for significant differences between moderate and serious levels of psychological distress and none category (K6 score = 0–7).
% = weighted prevalence
BRFSS = Behavioral Risk Factor Surveillance System
CI = Confidence Interval
DC = District of Columbia
K6 = Kessler 6
Table 3.
ADJUSTEDa ESTIMATES AND PREVALENCE RATIOS OF SEVEN CHRONIC CONDITIONS AND OBESITY AMONG ADULTS AGED 18 YEARS OR OLDER WITH DISABILITY BY LEVEL OF PSYCHOLOGICAL DISTRESS, 35 STATES, DC, AND PUERTO RICO, BRFSS, 2007
| None (K6 score = 0–7) |
Mile to Moderate (K6 score = 8–12) |
Serious (K6 score ≥13) |
P-value for trend | |||
|---|---|---|---|---|---|---|
| % (95% CI) | % (95% CI) | APR (95% CI)b | % (95% CI) | APR (95% CI)b | ||
| Arthritis (n = 50,790) | 56.9 (55.9–58.0) | 59.9 (57.7–62.0)* | 1.05 (1.01–1.09) | 61.8 (59.1–64.5)** | 1.09 (1.04–1.14) | <.01 |
| Asthma (n = 50,558) | 14.8 (14.0–15.5) | 17.2 (15.6–18.9)** | 1.17 (1.05–1.30) | 19.4(17.3–21.5)*** | 1.31 (1.16–1.48) | <.001 |
| Coronary heart disease (n = 49,715) | 15.0 (14.3–15.7) | 16.9(15.4–18.4)*** | 1.13 (1.02–1.25) | 21.2(18.9–23.5)*** | 1.42 (1.26–1.60) | <.001 |
| Diabetes (n = 50,968) | 17.4 (16.6–18.2) | 19.0 (17.4–20.6) | 1.09 (0.99–1.20) | 20.7 (18.7–22.7)** | 1.19 (1.07–1.33) | <.01 |
| Hypertension (n = 50,921) | 45.5 (44.4–46.5) | 48.7 (46.5–50.9)** | 1.07 (1.02–1.13) | 51.1(48.3–53.9)*** | 1.12 (1.06–1.19) | <.001 |
| High cholesterol (n = 45,545) | 47.9 (46.9–49.0) | 52.7(50.3–55.1)*** | 1.10 (1.04–1.16) | 60.2(57.4–63.1)*** | 1.26 (1.19–1.33) | <.001 |
| Stroke (n = 50,726) | 7.1 (6.6–7.6) | 9.9 (8.6–11.1)*** | 1.39 (1.19–1.62) | 9.4 (8.0–10.8)** | 1.33 (1.11–1.58) | <.01 |
| Obesity (n = 48,217) | 37.0 (36.0–38.1) | 37.6 (35.4–39.9) | 1.02 (0.95–1.09) | 38.3 (35.5–41.2) | 1.04 (0.95–1.12) | .40 |
P < .05
P < .01
P < .001 for significant differences between moderate and serious levels of psychological distress and none category (K6 score = 0–7).
Adjusted for age, sex, race/ethnicity, educational attainment, marital status, and employment status.
Referent is none category (K6 score = 0–7).
% = Weighted Prevalence
APR = Adjusted Prevalence Ratio
BRFSS = Behavioral Risk Factor Surveillance System
CI = Confidence Interval
DC = District of Columbia
K6 = Kessler 6
Among adults with disabilities who responded Yes or No to all of the seven chronic diseases and conditions assessed, multinomial logistic regression analysis was used to assess the risk of MPD and SPD by total number of conditions versus no conditions. As seen in Figure 1, we found a strong association between an increasing number of physical chronic conditions and SPD prevalence among adults with disabilities (9.1% among those with one condition, 10.4% among those with two conditions, 12.2% among those with three conditions, 14.4% among those with four conditions, and 16.1% among those with five to seven conditions versus 7.3% among those with 0 conditions, APR = 1.24 [95% CI = 0.94−1.64], APR = 1.43 [95% CI = 1.10−1.86], APR = 1.67 [95% CI = 1.24−2.17], APR = 1.97 [95% CI = 1.49−2.60], and APR = 2.21 [95% CI = 1.68−2.91], respectively). For example, the APR for SPD was 2.21 times as high among those with five to seven conditions as among those with no conditions (16.1%/7.3% = 2.21%; p < .001). The risk of MPD was significantly increased 25% and 43% for those with four and five to seven conditions versus zero conditions (17.6% among those with four conditions and 20.3% among those with five to seven conditions versus 14.2% among those with zero conditions, APR = 1.25 [95% CI = 1.02−1.51] and APR = 1.43 [95% CI = 1.16−1.77], respectively). Conversely, the risk of being in the no psychological distress category was significantly reduced incrementally from 4% to 19% for those with two or more conditions versus those with zero conditions (two conditions: APR = 0.96, 95% CI = 0.92−0.99; three conditions: APR = 0.92, 95% CI = 0.88−0.96; four conditions: APR = 0.87, 95% CI = 0.83−0.91; and five–seven conditions: APR = 0.81, 95% CI = 0.76−0.86) (data not shown).
Figure 1.
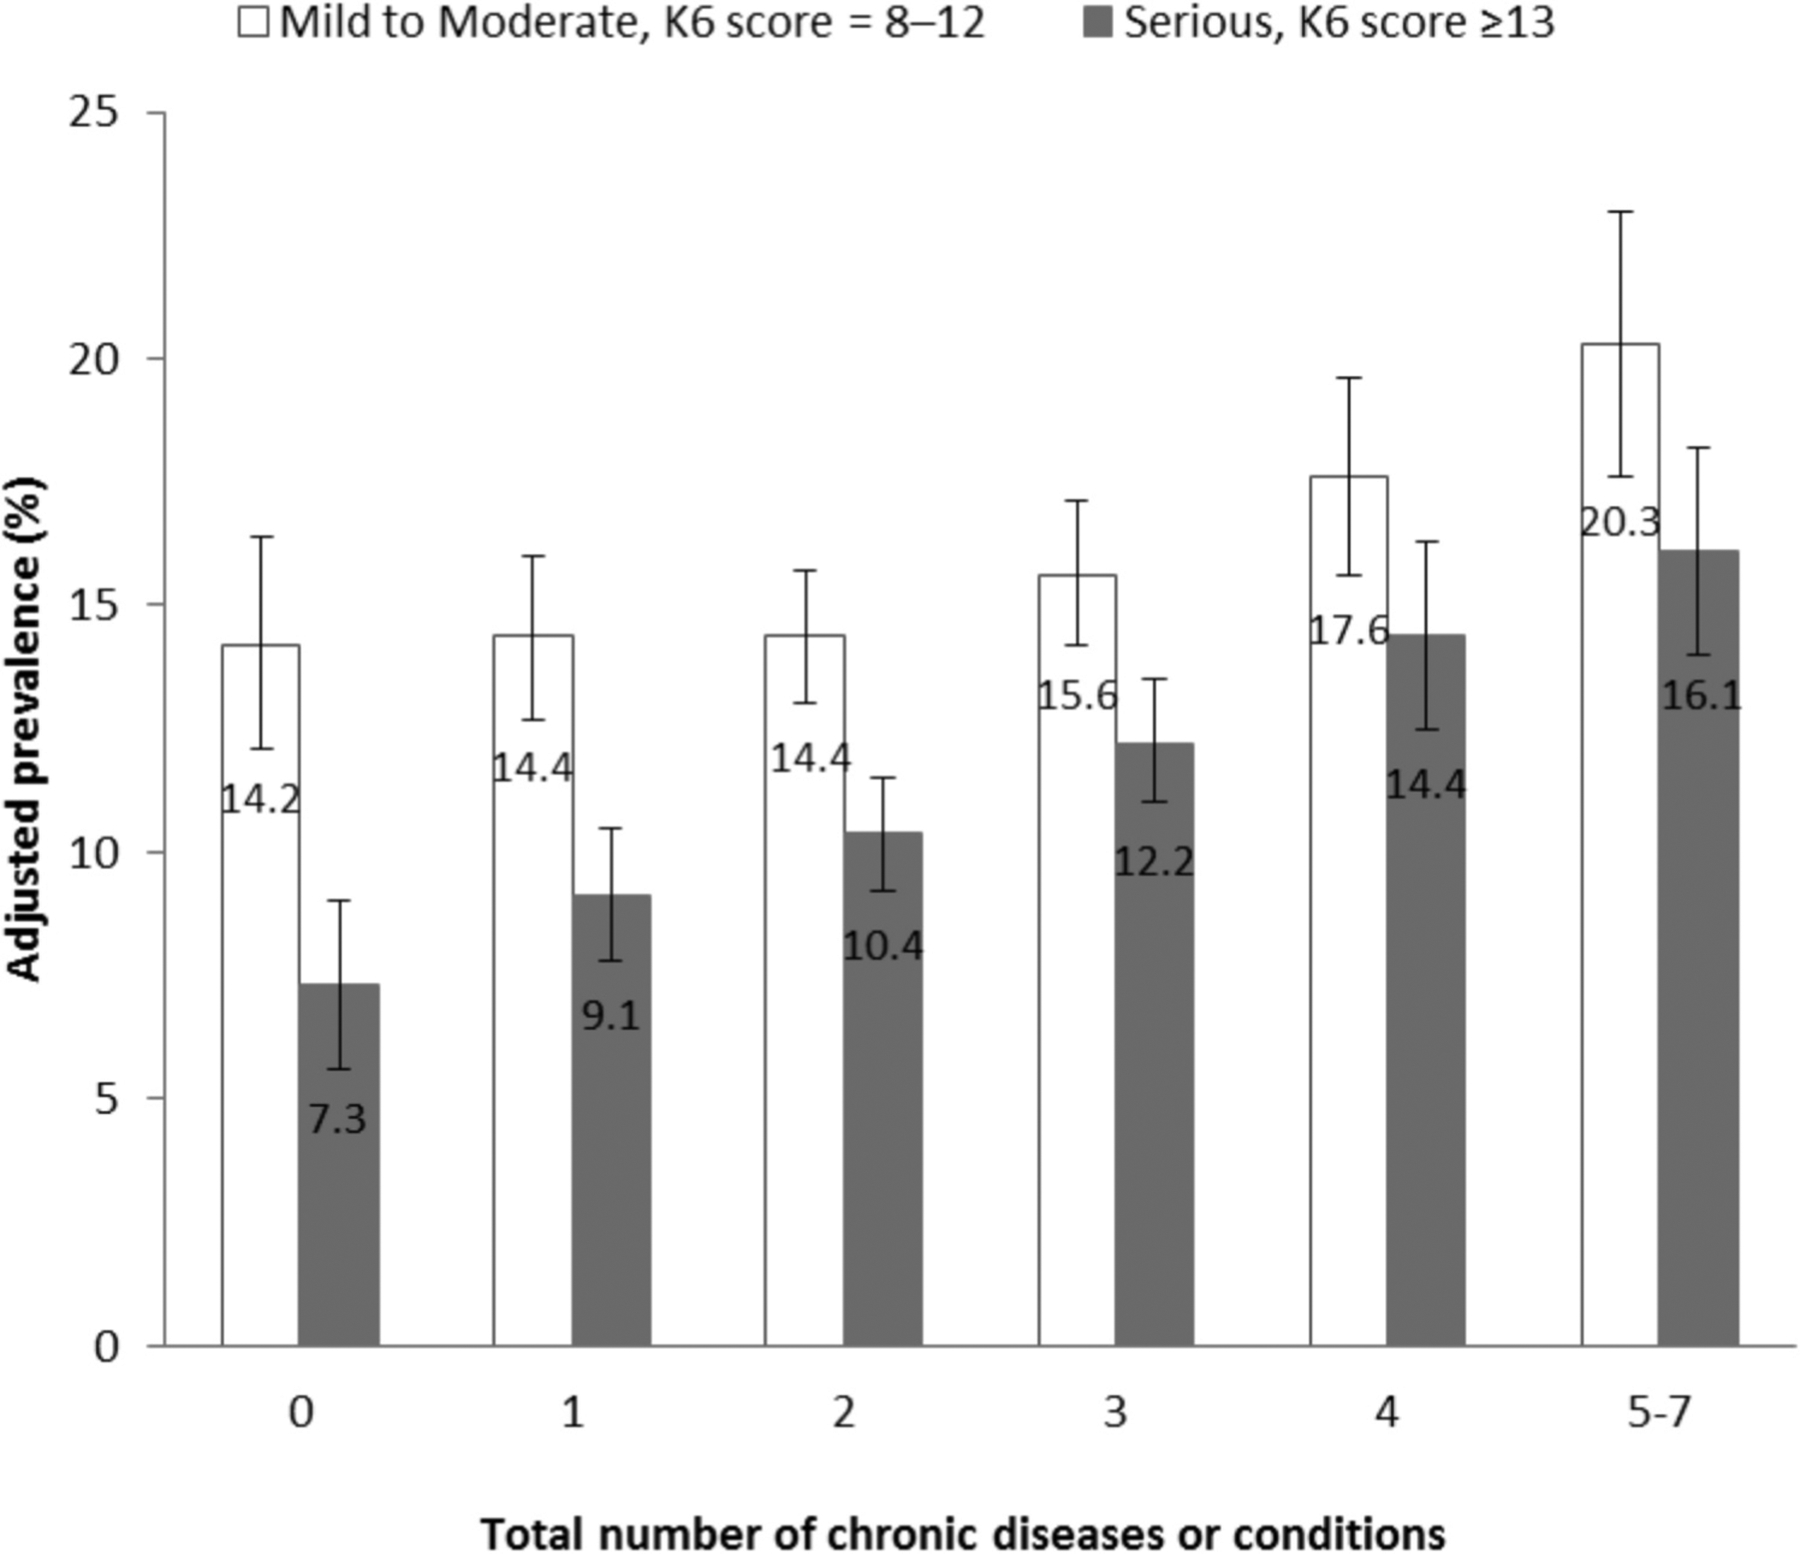
Adjusted estimates (and 95% CIs) of total number of chronic diseases and conditions among adults with disabilities by mild to moderate and serious psychological distress, 35 States, DC, and Puerto Rico, BRFSS, 2007.ab
aAdjusted for age, sex, race/ethnicity, educational attainment, marital status, and employment status.
bEstimates based upon adults responding “yes” or “no” to each of the assessed chronic diseases and conditions (i.e., arthritis, asthma, coronary heart disease, diabetes, high cholesterol, hypertension, and stroke).
Health care access and use of preventive services.
As seen in Table 4, when comparing adults with disabilities and MPD or SPD with those with NPD based on the five health care access service outcomes, significant differences were found for all five measures among adults aged 18 to 64 years and only two measures for adults aged 65 years or older. Smaller proportions of adults aged 18 to 64 with MPD or SPD reported having a usual source of health care (e.g., primary care provider) compared with those with NPD (81.2% and 78.1%, respectively, versus 86.1%). In addition, smaller proportions in these two groups reported not having a cost barrier to health care (58.3% and 51.8%, respectively, versus 80.8%) and having health insurance (77.1% and 71.0%, respectively, versus 85.8%) compared with those without psychological distress. Not surprisingly, substantially greater proportions of adults aged 18 to 64 years with MPD or SPD indicated that they were receiving medication or treatment from a health professional for a mental health condition compared with those with NPD (42.0% and 60.7%, respectively, versus 17.5%); however, smaller proportions in these two groups indicated receipt of a routine health checkup within the past five years (86.5% and 86.7%, respectively, versus 90.3%). Compared with adults aged 65 years or older with NPD, substantially smaller proportions of adults aged 65 years or older with MPD or SPD reported no cost barrier to health care (85.6% and 81.4%, respectively, versus 95.2%) and greater proportions in these two groups indicated that they were receiving mental health treatment (30.0% and 46.3%, respectively, versus 10.9%).
Table 4.
HEALTHCARE ACCESS AND USE OF PREVENTIVE SERVICES AMONG ADULTS WITH DISABILITY BY LEVEL OF PSYCHOLOGICAL DISTRESS, 35 STATES, DC, AND PUERTO RICO, BRFSS, 2007
| None (K6 score = 0–7) |
Mild to Moderate (K6 score = 8–12) |
Serious (K6 score ≥13) |
P-value for trend | |
|---|---|---|---|---|
| % (95% CI) | % (95% CI)b | % (95% CI)b | ||
| Healthcare access | ||||
| Age 18–64 years | ||||
| Usual source of healthcare (n = 31,529) | 86.1 (84.9–87.2) | 81.2 (78.5–83.6)* | 78.1 (74.6–81.2)* | <.001 |
| No cost barrier to healthcare (n = 31,523) | 80.8 (79.6–81.8) | 58.3 (55.5–61.1)* | 51.8 (48.6–55.0)* | <.001 |
| Any health insurance (n = 31,544) | 85.8 (84.7–86.8) | 77.1 (74.6–79.4)* | 71.0 (67.6–74.1)* | <.001 |
| Mental health treatment (n = 31,417) | 17.5 (16.6–18.4) | 42.0 (39.4–44.6)* | 60.7 (57.3–63.9)* | <.001 |
| Routine check-up within past 5 years (n = 31,132) | 90.3 (89.4–91.2) | 86.5 (84.2–88.5)** | 86.7 (84.7–88.5)* | <.001 |
| Aged ≥65 years | ||||
| Usual source of healthcare (n = 20,547) | 95.9 (95.4–96.5) | 94.1 (91.4–95.9) | 93.6 (90.1–96.0) | .07 |
| No cost barrier to healthcare (n = 20,521) | 95.2 (94.3–95.9) | 85.6 (81.6–88.9)* | 81.4 (76.6–85.4)* | <.001 |
| Any health insurance (n = 20,545) | 98.6 (98.2–98.9) | 96.6 (92.7–98.5) | 97.4 (95.3–98.5) | <.05 |
| Mental health treatment (n = 20,434) | 10.9 (10.1–11.8) | 30.0 (26.4–33.9)* | 46.3 (40.0–52.8)* | <.001 |
| Routine check-up within past 5 years (n = 20,167) | 96.5 (96.1–96.9) | 95.4 (93.8–96.7) | 92.0 (85.8–95.7) | <.01 |
| Preventive services | ||||
| Influenza vaccination within past year (n = 52,255) | 51.6 (50.6–52.6) | 42.6 (40.4–44.9)* | 37.8 (35.2–40.5)* | <.001 |
| Ever received pneumococcal vaccine (n = 49,295) | 43.1 (42.1–44.1) | 36.1 (34.0–38.2)* | 33.3 (30.8–35.9)* | <.001 |
| Colorectal cancer screening, adults aged 50–75 years (n = 6,692)a | 68.5 (66.8–70.1) | 59.0 (54.5–63.4)* | 59.0 (52.8–64.8)** | <.01 |
| Mammogram in the past 2 years, women aged ≥40 years (n = 4,684)b | 76.8 (74.5–79.0) | 65.9 (60.1–71.3)* | 63.7 (56.4–70.5)* | <.001 |
| Pap test in the past 3 years, women aged 21–64 years (n = 3,051)b | 82.9 (79.9–85.5) | 76.7 (70.9–81.6)*** | 67.5 (59.3–74.8)* | <.001 |
P<.001
P<.01
P<.05 for significant differences between moderate and serious levels of psychological distress and none category (K6 score = 0–7).
Based on data from seven states that used the optional Colorectal Cancer Screening Module in 2007: Hawaii, Iowa, Maine, Nebraska, Oklahoma, Vermont, and Washington.
Based on data from six states that used the optional Women’s Health Module in 2007: Arkansas, Georgia, Hawaii, Nebraska, Nevada, and Wyoming.
% = Weighted Prevalence
BRFSS = Behavioral Risk Factor Surveillance System
CI = Confidence Interval;
DC = District of Columbia
K6 = Kessler 6
When comparing adults with disabilities and MPD or SPD to those with NPD based on the five preventive service outcomes, significant differences were found for all five measures. Significantly smaller proportions of adults with SPD, followed by those with MPD, reported receipt of immunizations (i.e., influenza and pneumococcal) and two of the three cancer screenings (i.e., breast and cervical). Similarly small proportions of adults with disabilities aged 50 to 75 years with SPD or MPD reported receipt of colon cancer screening compared with those with NPD (59.0% and 59.0%, respectively, versus 68.5%).
As seen in Table 5, after adjustment for sociodemographic characteristics, significant differences remained for only three of the five health care access service outcomes examined among adults with disabilities aged 18 to 64 by level of psychological distress. Specifically, adults with disabilities aged 18 to 64 years with either MPD or SPD were more likely to have a cost barrier to health care and not to have health insurance compared with their counterparts with no distress. In addition, those with SPD were more likely to not have a usual source of health care and those with MPD were more likely not to have had a routine check-up in the past five years. After adjustment for confounders, adults with disabilities aged 65 years or older with MPD or SPD remained more likely to have a cost barrier to health care.
Table 5.
ADJUSTED PREVALENCE AND PREVALENCE RATIOS FOR HEALTHCARE ACCESS AND PREVENTIVE SERVICES AMONG ADULTS WITH DISABILITY BY LEVEL OF PSYCHOLOGICAL DISTRESS, 35 STATES, DC, AND PUERTO RICO, BRFSS, 2007
| None (K6 score = 0–7) |
Mild to Moderate (K6 score = 8–12) |
Serious (K6 score ≥13) |
P-value for trend | |||
|---|---|---|---|---|---|---|
| % (95% CI) | % (95% CI) | APR (95% CI)a | % (95% CI) | APR (95% CI)a | ||
| Healthcare access | ||||||
| No usual source of health-careb | ||||||
| Age 18–64 yrs. (n = 30,797) | 14.8 (13.6–16.0) | 16.3 (14.2–18.4) | 1.10 (0.95–1.27) | 19.2 (16.2–22.2)* | 1.29 (1.09–1.54) | <.01 |
| Aged ≥65 yrs. (n = 20,122) | 4.1 (3.5–4.7) | 5.4 (3.4–7.4) | 1.31 (0.88–1.97) | 5.5 (3.0–8.1) | 1.35 (0.84–2.17) | .22 |
| Cost barrier to healthcareb | ||||||
| Age 18–64 yrs. (n = 30,788) | 20.9 (19.7–22.1) | 37.7 (35.0–40.4)** | 1.81 (1.64–1.98) | 42.2 (38.9–45.5)** | 2.02 (1.83–2.24) | <.001 |
| Aged ≥65 yrs. (n = 20,099) | 5.2 (4.3–6.1) | 11.5 (8.9–14.0)** | 2.19 (1.66–2.88) | 12.5 (8.9–16.0)** | 2.38 (1.69–3.35) | <.001 |
| No health insuranceb | ||||||
| Age 18–64 yrs. (n = 30,811) | 15.7 (14.6–16.9) | 19.8 (17.7–22.0)* | 1.26 (1.10–1.44) | 23.9 (20.9–27.0)** | 1.52 (1.31–1.77) | <.001 |
| Aged ≥65 yrs. (n = 20,122) | 1.5 (1.1–1.8) | 2.6 (1.0–4.3) | 1.76 (0.94–3.30) | 1.8 (0.7–3.0) | 1.21 (0.61–2.41) | .59 |
| No mental health Treatmentc | ||||||
| Age 18–64 yrs. (n = 30,635) | 82.2 (81.2–83.1) | 58.0 (55.5–60.5)** | 0.71 (0.67–0.74) | 40.5 (37.4–43.6)** | 0.49 (0.46–0.53) | <.001 |
| Aged ≥65 yrs. (n = 19,966) | 89.0 (88.1–89.8) | 70.6 (67.0–74.2)** | 0.79 (0.75–0.84) | 54.5 (48.4–60.7)** | 0.61 (0.55–0.69) | <.001 |
| No routine check-up within the past 5 yearsc | ||||||
| Age 18–64 yrs. (n = 30,363) | 10.2 (9.3–11.2) | 12.4 (10.4–14.3)5 | 1.21 (1.01–1.45) | 11.7 (9.8–13.6) | 1.15 (0.95–1.39) | .15 |
| Aged ≥65 yrs. (n = 18,917) | 3.4 (3.0–3.9) | 4.0 (2.8–5.3) | 1.17 (0.84–1.64) | 5.6 (2.7–8.5) | 1.63 (0.96–2.77) | .07 |
| Preventive services | ||||||
| No influenza vaccination within past yr. (n = 49,938)c | 51.3 (50.2–52.3) | 51.5 (49.4–53.7) | 1.00 (0.96–1.05) | 52.8 (50.3–55.4) | 1.03 (0.98–1.09) | .27 |
| Never received pneumococcal vaccine (n = 47,116)c | 59.3 (58.3–60.4) | 59.3 (57.3–62.1) | 1.00 (0.96–1.04) | 59.7 (57.3–62.1) | 1.01 (0.96–1.05) | .79 |
| No colorectal cancer screening, adults aged 50–75 yrs. (n = 6,281)c,e | 32.6 (30.8–34.3) | 38.7(34.3–43.1)*** | 1.19 (1.05–1.35) | 34.4 (28.9–40.0) | 1.06 (0.89–1.25) | .53 |
| No mammogram in the past 2 yrs., women aged ≥40 yrs. (n = 4,594)d,f | 24.6 (22.2–27.1) | 30.8(25.7–35.9)*** | 1.25 (1.03–1.51) | 31.5 (25.2–37.8) | 1.28 (1.02–1.61) | <.05 |
| No Pap test in the past 3 yrs., women aged 21–64 yrs. (n = 3,009)d,f | 18.7 (15.5–21.9) | 20.4 (15.5–25.3) | 1.09 (0.81–1.46) | 27.4(21.1–33.7)*** | 1.46 (1.09–1.97) | <.05 |
P<.01
P<.001
P<.05 for significant differences between moderate and serious levels of psychological distress and none category (K6 score = 0–7).
Referent is none category (K6 score = 0–7).
Adjusted for age, sex, race/ethnicity, educational attainment, marital status, and employment status.
Adjusted for age, sex, race/ethnicity, educational attainment, marital status, employment status, and health insurance coverage.
Adjusted for age, race/ethnicity, educational attainment, marital status, employment status, and health insurance coverage.
Based on data from seven states that used the optional Colorectal Cancer Screening Module in 2007: Hawaii, Iowa, Maine, Nebraska, Oklahoma, Vermont, and Washington.
Based on data from six states that used the optional Women’s Health Module in 2007: Arkansas, Georgia, Hawaii, Nebraska, Nevada, and Wyoming.
% = Weighted Prevalence
APR = Adjusted Prevalence Ratio
BRFSS = Behavioral Risk Factor Surveillance System
CI = Confidence Interval
DC = District of Columbia
K6 = Kessler 6
After adjustment for sociodemographic characteristics and health insurance coverage, receipt of immunizations (i.e., influenza and pneumococcal) attenuated to non-significance by severity of psychological distress among adults with disabilities. However, a significant trend remained for breast cancer and cervical cancer screenings, with non-receipt of these two cancer screenings increasing with severity of psychological distress (p < .05 for trend). Even so, after adjustment, compared with women with disabilities without distress, a similar proportion with SPD indicated non-receipt of breast cancer screening (24.6% versus 31.5%; p = .0507 [borderline significance]) and a similar proportion with MPD indicated non-receipt of cervical cancer screening (18.7% versus 20.4%; p = .5649). In addition, among adults with disabilities aged 50 to 74 years, those with MPD remained less likely to have received a colorectal cancer screening than those without distress, while the association became statistically non-significant for those with SPD.
Discussion
The purpose of this analysis was to examine whether increasing levels of psychological distress among community-dwelling adults with self-reported disabilities were associated with increasing disparities in chronic diseases and conditions, obesity, access to health care, and use of preventive services. In general, we found that increasing levels of psychological distress were associated with increased disparities in several chronic diseases and conditions, access to health care, and use of preventive screenings. We had several notable findings. First, six of the seven examined chronic diseases and conditions increased in prevalence in relationship to increased levels of psychological distress. Second, the prevalence of obesity did not vary by degree of psychological distress. Third, three of the five health care access measures were inversely related to level of psychological distress among working-aged adults, as was having a cost barrier to health care among adults aged 65 years or older. Finally, compared with those with no psychological distress, those with MPD were significantly less likely to receive colorectal cancer screening and breast cancer screening, while those with SPD were significantly less likely to receive cervical cancer screening.
To date, this is the first known study to examine the health disparities of adults with disabilities by level of psychological distress. In general, our study findings are consistent with what has been established in the scientific literature for the general population regarding the association between increasing levels of psychological distress and increased disparities in comorbidities, health care access, and use of preventive services.6,8,15,50,51 Notably, our findings add that among adults with disabilities—both working-age adults and those aged 65 years or older—the use of mental health services increased with increasing severity of psychological distress. However, unlike their working-aged counterparts, older adults had no disparities in access to health insurance or a usual source of health care by level of psychological distress. This suggests that other explanatory factors (e.g., competing health conditions, health care avoidance, and stigma) may contribute to the larger proportion of older adults with SPD who report non-receipt of mental health treatment as compared with those of working-age (54.5% versus 40.5%). The elucidation of these factors may inform targeted strategies to increase mental health service use, particularly among this age cohort.
In comparison, and in keeping with what is established for non-disabled populations, we found that adults aged 18−64 years with disabilities with either MPD or SPD experienced several access barriers to health care, and these barriers generally increased with each degree of distress (except for receipt of a routine check-up). For example, those with disabilities with higher levels of psychological distress were significantly less likely to have health insurance. Typically, people with disabilities have higher rates of health insurance coverage, albeit primarily government-sponsored, than those without disabilities. However, we also found that those with either MPD or SPD were significantly less likely to be employed which may partially explain the high prevalence of uninsurance and cost barriers to care.
Conversely, not having health insurance may contribute to poor mental health. Recent results from the Oregon Health Study52,53—an evaluation of the effects of a 2008 Medicaid expansion in Oregon based on lottery drawings from a waiting list of uninsured low-income adults—showed that Medicaid coverage reduced financial strain from medical costs, increased health care access, increased use of preventive services, and improved self-reported mental health In addition, Medicaid coverage significantly decreased the probability of a positive depression screening.52 Nevertheless, these study results may not be generalizable to our study population. The 2010 Affordable Care Act (ACA; PL 111−148; PL 111−152)54,55 will provide a unique opportunity to further evaluate the effects of expansion of health care access in the United States, particularly as states and other stakeholders are largely accountable for its implementation.
Our unadjusted findings demonstrated that among adults with disabilities, those with MPD or SPD were less likely than those without distress to receive preventive screenings compared with those having no psychological distress. However, after adjustment for sociodemographic characteristics and health insurance coverage, the significant differences by level of psychological distress for colorectal cancer and breast cancer screening among adults with SPD, and for cervical cancer screening among those with MPD attenuated to non-significance. These attenuations in significance point to key adjustment factors that facilitate health care access and use, such as health insurance coverage. These findings may also reflect the increased regularity of visits with health care professionals that occur among adults with disabilities (versus adults without disabilities), particularly among those with multiple or severe limitations, secondary conditions, and comorbidities.56
Given that SPD is associated with negative health outcomes and early death,6–9,13–16 having decreased access to needed health care among a population already experiencing significant disparities in health is troubling. Researchers16,57 have identified that having health insurance coverage for the treatment of mental disorders is a key factor in determining if a person will obtain care for their condition. Notably, the ACA will expand coverage of mental health and substance use disorder benefits and federal parity protections to an estimated 62.5 million Americans.55 Nevertheless, the very nature of psychological distress symptomology and existing social and environmental inequalities may contribute to a person not seeking mental health care as well as to poor self-care practices, adverse health behaviors, and the non-use of preventive screenings.5,16 Investment into universal access in the design of work environments,58 health care facilities,59,60 recreational venues,61,62 and other community venues may enable people with disabilities to maintain or obtain employment, be physically active, and continue participation in valued life activities.38 In addition, destigmatization of the use of assistive devices and technologies and increased research into assistive technology development, use, and evaluation may also facilitate full participation in work and social activities and independent living.63,64 Moreover, among people with disabilities, disparities in the use of assistive technologies also exist.65 Finally, the stigma associated with mental illness and the societal and cultural norms that surround mental disorders and their treatment may need to be addressed at a population-level.66 Thus, a multitude of strategies must be employed adequately to address the health disparities associated with psychological distress in an attempt to reach our nation’s goal of eliminating health disparities for people with disabilities.
Limitations.
Our results are subject to several potential limitations. Prior to 2011, the BRFSS sampling frame only included households with land-line telephones. Thus, data derived from the 2007 BRFSS are not representative of cellular only households, those without telephones, or institutionalized populations. Responses are based on self-reports and, as a result, are subject to recall bias and social desirability bias. However, BRFSS data have been shown to provide valid and reliable estimates in comparisons to other national surveys.67 Also, a respondent must be able to complete the survey without the use of a proxy. Therefore, these findings may under-represent people with cognitive difficulties or other limitations that do not allow them to complete a telephone survey. In addition, one of the questions used to identify adults with disability is subject to definition circularity: the question did not distinguish between adults for whom the primary basis of disability was an emotional or mental problem, and adults whose emotional or mental problems were secondary or associated with a physically disabling condition. The effect of these limitations on our findings is unknown and requires further elucidation. Additional studies utilizing other data collection modes and population groups are recommended to duplicate, refute, or expand our findings. Symptom screening scales, such as the K6, may misclassify adults with psychological distress who are being successfully treated; therefore, the potential for misclassification bias exists.44 Not all states used the optional BRFSS MIS Module; therefore, our findings cannot be generalized to the U.S. adult population with disabilities. Also, of the 35 states that used the optional BRFSS MIS Module, seven states used the optional BRFSS Colorectal Cancer Screening Module and six states used the optional BRFSS Women’s Health Module. Thus, our analyses of colorectal cancer screening and breast cancer and cervical cancer screenings are limited to these respective states. Finally, the BRFSS is a cross-sectional study; cause and effect cannot be determined. For example, increases in the severity of psychological distress may adversely impact biological and psychosocial functioning, resulting in an increased risk for comorbid medical conditions, barriers to health care, and progression of disability. Conversely, sociodemographic factors, chronic conditions or diseases, and poor health care utilization or self-care may increase the risk of psychological distress and its severity.
In conclusion, our findings highlight numerous health disparities among adults with disabilities by level of psychological distress. This study’s findings may inform the design of targeted public health strategies to eliminate health disparities between adults with and without disabilities, and those that exist among those with disabilities. In addition, increased knowledge regarding the associations between varied degrees of psychological distress with chronic diseases and conditions, obesity, health care access, and use of preventive services may assist public health professionals, mental health care professionals, rehabilitation providers, policy-makers, and other stakeholders with improving the health, health outcomes, and mortality of individuals with disabilities.
Acknowledgment
We thank the state health department BRFSS coordinators for their participation in data collection for this analysis and CDC’s Division of Behavioral Surveillance staff for their valuable assistance in developing the database.
Footnotes
Publisher's Disclaimer: Disclaimer: The findings and conclusions in this report are those of the authors and do not necessarily represent the official position of the Centers for Disease Control and Prevention.
Notes
- 1.Brault MW. Americans with disabilities: 2005. Household economic studies. Washington, DC: U. S. Department of Commerce, U. S. Census Bureau, 2008. [Google Scholar]
- 2.Institute of Medicine. The future of disability in America. Washington, DC: The National Academies Press, 2007. [PubMed] [Google Scholar]
- 3.U.S. Department of Health and Human Services. Healthy People 2010: understanding and improving health. Washington, DC: U.S. Government Printing Office, 2000. [Google Scholar]
- 4.U.S. Department of Health and Human Services. Healthy People 2010: Midcourse Review. Washington, DC: U.S. Department of Health and Human Services, 2007. [Google Scholar]
- 5.Frieden TR. Forward: CDC Health Disparities and Inequalities Report—United States, 2011. MMWR Surveill Summ. 2011. January 14;60 Suppl:1–2. [PubMed] [Google Scholar]
- 6.Shih M, Hootman JM, Strine TW, et al. Serious psychological distress in U.S. adults with arthritis. J Gen Intern Med. 2006. November;21(11):1160–6. Epub 2006 Jul 19. 10.1111/j.1525-1497.2006.00573.x [DOI] [PMC free article] [PubMed] [Google Scholar]
- 7.Schmitz N, Wang J, Malla A, et al. The impact of psychological distress on functional disability in asthma: results from the Canadian community health survey. Psychosomatics. 2009. Jan-Feb;50(1):42–9. 10.1176/appi.psy.50.1.42 [DOI] [PubMed] [Google Scholar]
- 8.McKnight-Eily LR, Elam-Evans LD, Strine TW, et al. Activity limitation, chronic disease, and comorbid serious psychological distress in U.S. adults—BRFSS 2007. Int J Public Health. 2009. June;54 Suppl 1:111–9. 10.1007/s00038-009-0015-0 [DOI] [PubMed] [Google Scholar]
- 9.Okoro CA, Strine TW, Balluz LS, et al. Serious psychological distress among adults with and without disabilities. Int J Public Health. 2009. June;54 Suppl 1:52–60. [DOI] [PubMed] [Google Scholar]
- 10.Strine TW, Hootman JM. US national prevalence and correlates of low back and neck pain among adults. Arthritis Rheum. 2007. May 15;57(4):656–65. 10.1002/art.22684 [DOI] [PubMed] [Google Scholar]
- 11.Croft JB, Mokdad AH, Power AK, et al. Public health surveillance of serious psychological distress in the United States. Int J Public Health. 2009. June;54 Suppl 1:4–6. 10.1007/s00038-009-0017-y [DOI] [PubMed] [Google Scholar]
- 12.U.S. Department of Health and Human Services. Physical Activity Guidelines Advisory Committee report, 2008. To the Secretary of Health and Human Services. Part A: Executive summary. Nutr Rev. 2008. February;67(2):114–20. [DOI] [PubMed] [Google Scholar]
- 13.Pratt LA. Serious psychological distress, as measured by the K6, and mortality. Ann Epidemiol. 2009. March;19(3):202–9. 10.1016/j.annepidem.2008.12.005 [DOI] [PubMed] [Google Scholar]
- 14.Fan AZ, Strine TW, Jiles R, et al. Psychological distress, use of rehabilitation services, and disability status among noninstitutionalized US adults aged 35 years and older, who have cardiovascular conditions, 2007. Int J Public Health. 2009. June;54 Suppl 1:100–5. 10.1007/s00038-009-1313-2 [DOI] [PubMed] [Google Scholar]
- 15.Pearson WS, Dhingra SS, Strine TW, et al. Relationships between serious psychological distress and the use of health services in the United States: findings from the Behavioral Risk Factor Surveillance System. Int J Public Health. 2009. June;54 Suppl 1:23–9. 10.1007/s00038-009-0003-4 [DOI] [PubMed] [Google Scholar]
- 16.Druss BG, Bornemann TH. Improving health and health care for people with serious mental illness: the window for US federal policy change. JAMA. 2010. May 19;303(19):1972–3. 10.1001/jama.2010.615 [DOI] [PubMed] [Google Scholar]
- 17.Ye J, Shim R, Rust G. Health care avoidance among people with serious psychological distress: analyses of 2007 Health Information Trends Survey. Journal of Health Care for the Poor and Underserved. 2012. November;23(4):1620–9. 10.1353/hpu.2012.0189 [DOI] [PMC free article] [PubMed] [Google Scholar]
- 18.Thorpe JM, Kalinowski CT, Patterson ME, et al. Psychological distress as a barrier to preventive care in community-dwelling elderly in the United States. Med Care. 2006. February;44(2):187–91. 10.1097/01.mlr.0000196965.54871.d5 [DOI] [PubMed] [Google Scholar]
- 19.Aro AR, de Koning HJ, Absetz P, et al. Two distinct groups of non-attenders in an organized mammography screening program. Breast Cancer Res Treat. 2001. November;70(2):145–53. 10.1023/A:1012939228916 [DOI] [PubMed] [Google Scholar]
- 20.Kessler RC, Andrews G, Colpe LJ, et al. Short screening scales to monitor population prevalences and trends in non-specific psychological distress. Psychol Med. 2002. August;32(6):959–76. 10.1017/S0033291702006074 [DOI] [PubMed] [Google Scholar]
- 21.Kessler RC, Barker PR, Colpe LJ, et al. Screening for serious mental illness in the general population. Arch Gen Psychiatry. 2003. February;60(2):184–9. 10.1001/archpsyc.60.2.184 [DOI] [PubMed] [Google Scholar]
- 22.102nd Congress (1991–1992). Community Mental Health and Substance Abuse Services Improvement Act of 1992 (Alcohol, Drug Abuse, and Mental Health Administration [ADAMHA] Reorganization Act). Public Law No 102–321. Washington, DC: The Library of Congress, 1992. [Google Scholar]
- 23.Mitchell CM, Beals J. The utility of the Kessler Screening Scale for Psychological Distress (K6) in two American Indian communities. Psychol Assess. 2011. September;23(3):752–61. 10.1037/a0023288 [DOI] [PMC free article] [PubMed] [Google Scholar]
- 24.Kessler RC, Green JG, Gruber MJ, et al. Screening for serious mental illness in the general population with the K6 screening scale: results from the WHO World Mental Health (WMH) survey initiative. Int J Methods Psychiatr Res. 2010. June;19 Suppl 1:4–22. 10.1002/mpr.310 [DOI] [PMC free article] [PubMed] [Google Scholar]
- 25.Andrews G, Slade T. Interpreting scores on the Kessler Psychological Distress Scale (K10). Aust N Z J Public Health. 2001. December;25(6):494–7. 10.1111/j.1467-842X.2001.tb00310.x [DOI] [PubMed] [Google Scholar]
- 26.Furukawa TA, Kessler RC, Slade T, et al. The performance of the K6 and K10 screening scales for psychological distress in the Australian National Survey of Mental Health and Well-Being. Psychol Med. 2003. February;33(2):357–62. 10.1017/S0033291702006700 [DOI] [PubMed] [Google Scholar]
- 27.Kraemer HC. DSM categories and dimensions in clinical and research contexts. Int J Methods Psychiatr Res. 2007;16 Suppl 1:S8–S15. 10.1002/mpr.211 [DOI] [PMC free article] [PubMed] [Google Scholar]
- 28.Bjelland I, Lie SA, Dahl AA, et al. A dimensional versus a categorical approach to diagnosis: anxiety and depression in the HUNT 2 study. Int J Methods Psychiatr Res. 2009. June;18(2):128–37. 10.1002/mpr.284 [DOI] [PMC free article] [PubMed] [Google Scholar]
- 29.Kessler RC. The categorical versus dimensional assessment controversy in the sociology of mental illness. J Health Soc Behav. 2002. June;43(2):171–88. 10.2307/3090195 [DOI] [PubMed] [Google Scholar]
- 30.Jones GC, Rovner BW, Crews JE, et al. Effects of depressive symptoms on health behavior practices among older adults with vision loss. Rehabil Psychol. 2009. May;54(2):164–72. 10.1037/a0015910 [DOI] [PubMed] [Google Scholar]
- 31.Kessler RC, Merikangas KR, Berglund P, et al. Mild disorders should not be eliminated from the DSM-V. Arch Gen Psychiatry. 2003. November;60(11):1117–22. 10.1001/archpsyc.60.11.1117 [DOI] [PubMed] [Google Scholar]
- 32.McGorry PD. Is early intervention in the major psychiatric disorders justified? Yes. BMJ 2008. August 4;337:a695. 10.1136/bmj.a695 [DOI] [PubMed] [Google Scholar]
- 33.Pelosi A Is early intervention in the major psychiatric disorders justified? No. BMJ 2008. August 4;337:a710. 10.1136/bmj.a710 [DOI] [PubMed] [Google Scholar]
- 34.American Psychiatric Association. American Psychiatric Association practice guidelines for the treatment of psychiatric disorders. Compendium 2006. Arlington, VA: American Psychiatric Association, 2006. [Google Scholar]
- 35.U.S. Department of Health and Human Services. 2008 Physical activity guidelines for Americans: Be active, healthy, and happy! Washington, DC: U.S. Department of Health and Human Services, 2008. [Google Scholar]
- 36.World Health Organization. Global recommendations on physical activity for health. Geneva, Switzerland: World Health Organization, 2010. Available at: http://whqlibdoc.who.int/publications/2010/9789241599979_eng.pdf. [PubMed] [Google Scholar]
- 37.Institute for Clinical Systems Improvement [ICSI]. Major depression in adults in primary care. 13 ed. Bloomington, MN: Institute for Clinical Systems Improvement, 2010. [Google Scholar]
- 38.Rimmer JH, Marques AC. Physical activity for people with disabilities. Lancet. 2012. July 21;380(9838):193–5. 10.1016/S0140-6736(12)61028-9 [DOI] [PubMed] [Google Scholar]
- 39.Phillips M, Flemming N, Tsintzas K. An exploratory study of physical activity and perceived barriers to exercise in ambulant people with neuromuscular disease compared with unaffected controls. Clin Rehabil. 2009. August;23(8):746–55. Epub 2009 Jun 8. 10.1177/0269215509334838 [DOI] [PubMed] [Google Scholar]
- 40.Centers for Disease Control and Prevention. 2007 Behavioral Risk Factor Surveillance System. Summary Data Quality Report. Atlanta, GA: Centers for Disease Control and Prevention, 2007. Available at: http://www.cdc.gov/brfss/technical_infodata/quality.htm. [Google Scholar]
- 41.Wang PS, Gruber MJ, Powers RE, et al. Mental health service use among Hurricane Katrina survivors in the eight months after the disaster. Psychiatr Serv. 2007. November;58(11):1403–11. 10.1176/appi.ps.58.11.1403 [DOI] [PMC free article] [PubMed] [Google Scholar]
- 42.Centers for Disease Control and Prevention. Disability and Health Data System. Atlanta, GA: Centers for Disease Control and Prevention, 2012. Available at: http://www.cdc.gov/ncbddd/disabilityandhealth/dhds.html. [Google Scholar]
- 43.Galea S, Brewin CR, Gruber M, et al. Exposure to hurricane-related stressors and mental illness after Hurricane Katrina. Arch Gen Psychiatry. 2007. December;64(12):1427–34. 10.1001/archpsyc.64.12.1427 [DOI] [PMC free article] [PubMed] [Google Scholar]
- 44.Dhingra SS, Zack MM, Strine TW, et al. Psychological distress severity of adults reporting receipt of treatment for mental health problems in the BRFSS. Psychiatr Serv. 2011. April;62(4):396–403. 10.1176/appi.ps.62.4.396 [DOI] [PubMed] [Google Scholar]
- 45.First MB, Spitzer RL, Gibbon M. Structured clinical interview for DSM-IV Axis I disorders, research version. Non-patient edition (SCID-I/NP) ed. New York, NY: State Psychitric Institute, 2002. [Google Scholar]
- 46.SAS Institute Inc. SAS for Windows. In. 9.2 (TS2M0) ed. Cary, NC: SAS Institute, 2008. [Google Scholar]
- 47.Research Triangle Institute. SUDAAN User’s Manual. In. Release 10.0.1 ed. Research. Triangle Park, NC: Research Triangle Institute, 2008. [Google Scholar]
- 48.Bieler GS, Brown GG, Williams RL, et al. Estimating model-adjusted risks, risk differences, and risk ratios from complex survey data. Am J Epidemiol. 2010. March;171(5):618–23. Epub 2012 Feb 4. 10.1093/aje/kwp440 [DOI] [PubMed] [Google Scholar]
- 49.Aday LA, Andersen R. A framework for the study of access to medical care. Health Serv Res. 1974. Fall;9(3):208–20. [PMC free article] [PubMed] [Google Scholar]
- 50.McGuire LC, Strine TW, Vachirasudlekha S, et al. Modifiable characteristics of a healthy lifestyle and chronic health conditions in older adults with or without serious psychological distress, 2007 Behavioral Risk Factor Surveillance System. Int J Public Health. 2009. June;54 Suppl 1:84–93. 10.1007/s00038-009-0011-4 [DOI] [PubMed] [Google Scholar]
- 51.Hall CB, Lipton RB, Sliwinski M, et al. Cognitive activities delay onset of memory decline in people who develop dementia. Neurology. 2009. August 4;73(5):356–61. 10.1212/WNL.0b013e3181b04ae3 [DOI] [PMC free article] [PubMed] [Google Scholar]
- 52.Baicker K, Taubman SL, Allen HL, et al. The Oregon experiment—effects of Medicaid on clinical outcomes. N Engl J Med. 2013. May 2;368(18):1713–22. 10.1056/NEJMsa1212321 [DOI] [PMC free article] [PubMed] [Google Scholar]
- 53.Finkelstein A, Taubman S, Wright B, et al. The Oregon Health Insurance Experiment: Evidence from the First Year. Q J Econ. 2012. August;127(3):1057–1106. Epub 2012 May 3. 10.1093/qje/qjs020 [DOI] [PMC free article] [PubMed] [Google Scholar]
- 54.CCH Incorporated. Patient Protection and Affordable Care Act; Health Care and Education Reconciliation Act of 2010: text of P.L. 111–148, as signed by the President on March 23, 2010; text of P.L. 111–152, as signed by the President on March 30, 2010: JCT technical explanation of P.L. 111–148 and P.L. 111–152. Chicago, IL: CCH, 2010. [Google Scholar]
- 55.Beronio K, Po R, Skopec L, et al. ASPE Issue Brief: Affordable Care Act Expands Mental Health and Substance Use Disorder Benefits and Federal Parity Protections for 62 Million Americans. In: ASPE Office of Health Policy OotASfPaE, editor. Washington, DC: U.S. Department of Health and Human Services, 2013. [Google Scholar]
- 56.Chevarley FM, Thierry JM, Gill CJ, et al. Health, preventive health care, and health care access among women with disabilities in the 1994–1995 National Health Interview Survey, Supplement on Disability. Womens Health Issues. 2006. Nov-Dec;16(6):297–312. 10.1016/j.whi.2006.10.002 [DOI] [PubMed] [Google Scholar]
- 57.Mechanic D Removing barriers to care among people with psychiatric symptoms. Health Aff (Millwood). 2002. May-Jun;21(3):137–47. 10.1377/hlthaff.21.3.137 [DOI] [PubMed] [Google Scholar]
- 58.Mackelprang RW, Clute MA. Access for all: universal design and the employment of people with disabilities. J Soc Work Disabil Rehabil. 2009;8(3–4):205–21. 10.1080/15367100903202771 [DOI] [PubMed] [Google Scholar]
- 59.Arbour-Nicitopoulos KP, Ginis KA. Universal accessibility of “accessible” fitness and recreational facilities for people with mobility disabilities. Adapt Phys Activ Q. 2011. January;28(1):1–15. [DOI] [PubMed] [Google Scholar]
- 60.Riley BB, Rimmer JH, Wang E, et al. A conceptual framework for improving the accessibility of fitness and recreation facilities for people with disabilities. J Phys Act Health. 2008. January;5(1):158–68. [DOI] [PubMed] [Google Scholar]
- 61.Christensen KM, Holt JM, Wilson JF. Effects of perceived neighborhood characteristics and use of community facilities on physical activity of adults with and without disabilities. Prev Chronic Dis. 2010. September;7(5):A105. Epub 2012 Aug 15. [PMC free article] [PubMed] [Google Scholar]
- 62.Spivock M, Gauvin L, Riva M, et al. Promoting active living among people with physical disabilities evidence for neighborhood-level buoys. Am J Prev Med. 2008. April;34(4):291–8. 10.1016/j.amepre.2008.01.012 [DOI] [PubMed] [Google Scholar]
- 63.Mendelsohn S, Edyburn DL, Rust KL, et al. Using assistive technology outcomes research to inform policy related to the employment of individuals with disabilities. Assist Technol. 2008. Fall;20(3):139–48. 10.1080/10400435.2008.10131941 [DOI] [PubMed] [Google Scholar]
- 64.Sauer AL, Parks A, Heyn PC. Assistive technology effects on the employment outcomes for people with cognitive disabilities: A systematic review. Disabil Rehabil Assist Technol. 2010;5(6):377–91. 10.3109/17483101003746360 [DOI] [PubMed] [Google Scholar]
- 65.Kaye HS, Yeager P, Reed M. Disparities in usage of assistive technology among people with disabilities. Assist Technol. 2008. Winter;20(4):194–203. 10.1080/10400435.2008.10131946 [DOI] [PubMed] [Google Scholar]
- 66.Samant D, Soffer M, Hernandez B, et al. Corporate culture and employment of people with disabilities: role of social workers and service provider organizations. J Soc Work Disabil Rehabil. 2009;8(3–4):171–88. 10.1080/15367100903202706 [DOI] [PubMed] [Google Scholar]
- 67.Li C, Balluz LS, Ford ES, et al. A comparison of prevalence estimates for selected health indicators and chronic diseases or conditions from the Behavioral Risk Factor Surveillance System, the National Health Interview Survey, and the National Health and Nutrition Examiniation Survey, 2007–2008. Prev Med. 2012. June;54(6):381–7. Epub 2012 Apr 12. 10.1016/j.ypmed.2012.04.003 [DOI] [PubMed] [Google Scholar]