Abstract
Purpose:
This study aims to identify the key pathway and related genes and to further explore the potential molecular mechanisms of triple negative breast cancer (TNBC).
Methods:
The transcriptome data and clinical information of breast cancer patients were downloaded from the TCGA database, including 94 cases of paracancerous tissue, 225 cases of Basal like type, 151 cases of Her2 type, 318 cases of Luminal type A, 281 cases of Luminal type B, and 89 cases of Normal Like type. The differentially expressed genes (DEGs) were identified based on the criteria of |logFC|≥1.5 and adjust P < 0.001.Their functions were annotated by gene ontology (GO) analysis and Kyoto Encyclopedia of differentially expressed genes & Genomes (KEGG) pathway analysis. Cox regression univariate analysis and Kaplan-Meier survival curves (Log-rank method) were used for survival analysis. FOXD1, DLL3 and LY6D were silenced in breast cancer cell lines, and cell viability was assessed by CCK-8 assay. Further, the expression of FOXD1, DLL3 and LY6D were explored by immunohistochemistry on triple negative breast tumor tissue and normal breast tissue.
Results:
A total of 533 DEGs were identified. Functional annotation showed that DEGs were significantly enriched in intermediate filament cytoskeleton, DNA−binding transcription activator activity, epidermis development, and Neuroactive ligand−receptor interaction. Survival analysis found that FOXD1, DLL3, and LY6D showed significant correlation with the prognosis of patients with the Basal-like type (P < 0.05). CCK-8 assay showed that compared with Doxorubicin alone group, the cytotoxicity of Doxorubicin combined with siRNA-knockdown of FOXD1, DLL3, or LY6D was much significant.
Conclusion:
The DEGs and their enriched functions and pathways identified in this study contribute to the understanding of the molecular mechanisms of TNBC. In addition, FOXD1, DLL3, and LY6D may be defined as the prognostic markers and potential therapeutic targets for TNBC patients.
Keywords: triple negative breast cancer, The Cancer Genome Atlas, identification of key genes, survival prognosis
Introduction
Breast cancer is a heterogeneous disease with different histological abnormalities, cytogenetic abnormalities, and different responses and prognoses to treatments. It accounts for 16% of all female cancers. 1 As a special subtype of breast cancer, triple-negative breast cancer (TNBC) does not express the estrogen receptor (ER), progesterone receptor (PR), and human epidermal growth factor receptor 2 (HER2). 2 TNBC has the features of poor prognosis, greater invasiveness, higher distant recurrence, and worse survival among metastatic diseases. 3 In addition, existing targeting and endocrine therapy strategies are only applicable to the patients with HR or HER2-positive breast cancer. For TNBC, conventional chemotherapy remains the primary treatment. 4
The heterogeneity of TNBC is generally considered to consist of 3 levels: clinical, histological, and molecular levels. Recently, the genomic DNA copy number array, mRNA array, exon sequencing, DNA methylation, miRNA sequencing, and protein array have been used to elucidate the subtypes and molecular mechanisms of TNBC, and the data sets generated are stored in public databases, such as The Cancer Genome Altas (TCGA), and GEO, etc. These public data sets offer the possibility to study the molecular mechanisms of TNBC from different perspectives. 5 Meanwhile, a deeper understanding of the molecular mechanisms of TNBC will help to develop new strategies for TNBC treatment.
In this study, we identified differentially expressed genes (DEGs) in TNBC by comparing tumor tissues of TNBC with normal tissues, as well as comparing TNBC with other molecular subtypes of breast cancer. These DEGs were then subjected to gene ontology (GO) analysis and Kyoto Encyclopedia of differentially expressed genes & Genomes (KEGG) pathway analysis. In addition, the protein-protein interaction (PPI) network was constructed and the module screening analysis was performed. Furthermore, to explore the relationship between these DEGs and prognosis, we performed Cox regression univariate analysis and Kaplan-Meier survival analysis. Our findings may help to further understand the molecular mechanisms of TNBC and contribute to the diagnosis, prognosis and drug development of TNBC.
Material and Methods
Data Acquisition and Preprocessing
The RNA expression profile (level 3) of 1208 breast cancer patients and their clinical information were obtained from TCGA (https://gdc-portal.nci.nih.gov/) (data download in August 2018).
The sequencing data selected in this study all followed the following screening criteria: (1) histopathologically diagnosed as breast cancer; (2) the age and follow-up data of the selected patients were complete; (3) selected patients did not suffer from other types of malignant tumors. Based on the above screening criteria, we finally obtained RNA-seq data from 1158 cases, including 94 samples of paracancerous tissue and 1064 samples of tumor tissue. The 1064 samples of tumor tissue included 225 cases of Basal like type, 151 cases of Her2 type, 318 cases of Luminal type A, 281 cases of Luminal type B, and 89 cases of Normal like type. No ethical approval was required because the data comes from a public database. The data for RNA-seq were downloaded from the TCGA biolink Package, and the normalization of RNAseq was performed using the variance stabilizing transformation function in DESeq2.
Identification of DEGs
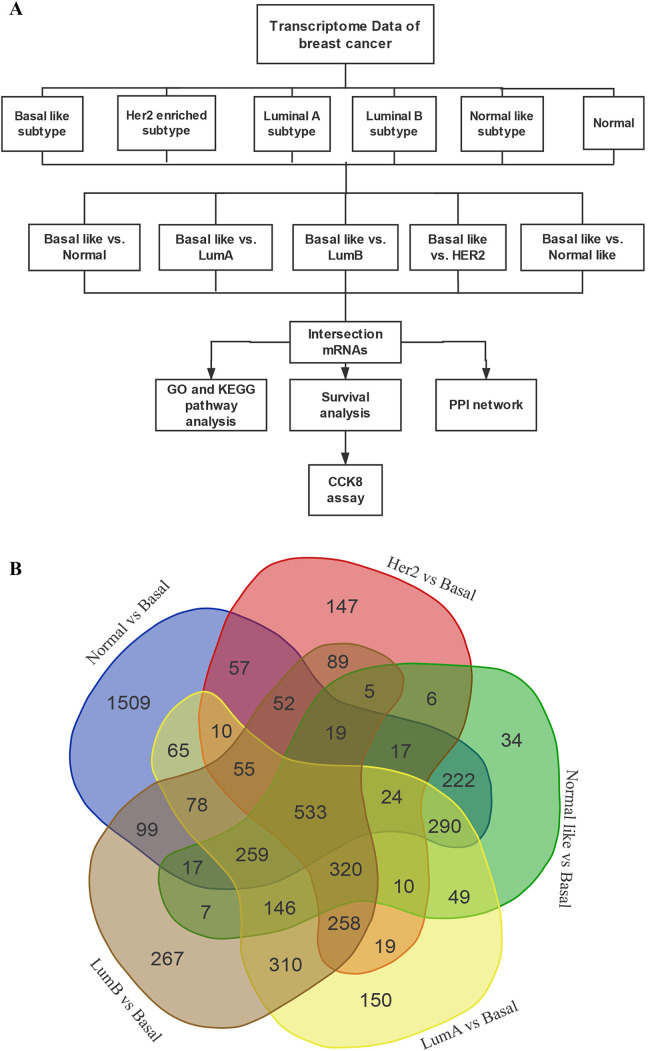
First, we divided the data into the following 5 groups: group 1: Basal like vs. Normal; group 2: Basal like vs. Her2; group 3: Basal like vs. Luminal A; group 4: Basal like vs. Luminal B; and group 5: Basal like vs. Normal like. Then, the DEGs were identified from each set of data by using the DESeq2 package in the R language. 6 In this study, the threshold for identification of DEGs was |logFC| ≥1.5 with the adjust P value < 0.001. The P heatmap R package 7 was used for plotting the heatmap of the DEGs in each group, and the top 100 genes with significant differences (including 50 up-regulated genes and 50 down-regulated genes) were displayed. The volcano map was plotted using the ggplot2 R package. 8 Subsequently, the Venn mapping was conducted to analyze the shared DEGs in each group, which generated 533 DEGs in the Basal like subtype. A flow chart was used to show the overall framework of the study (Figure 1A).
Figure 1.
A, Flow chart of this study. B, Venn diagram of aberrant expression profiles of mRNAs between Basal like vs. Normal, Basal like vs. Her2, Basal like vs. Luminal A, Basal like vs. Luminal B, Basal like vs. Normal like. A total of 533 intersecting mRNAs were identified.
GO and KEGG Pathway Enrichment Analysis
The biological significance of the 533 DEGs, including the biological processes, cellular components, and molecular functions, was then explored through the GO enrichment analysis. Meanwhile, the KEGG pathway analysis was used to explore the key enriched pathways of the 533 DEGs. In this study, we defined P < 0.05 and Q-value <0.05 as the screening criteria for GO and KEGG pathway enrichment. The R package cluster profiler 9 was used for the GO and KEGG analysis.
Construction of PPI Network
The PPI network is composed of individual proteins, which participate in all the aspects of life processes through interacting with each other, such as bio-signal transduction, gene expression regulation, energy and material metabolism, or cell cycle regulation. Systematic analysis of the interaction of a large number of proteins in the biological systems has great significance in understanding the working principles of proteins in biological systems, the mechanisms of biological signals and energy metabolism under special physiological conditions (such as diseases), and the functional links among proteins. We used the STRING database (Version 10.5) to construct the PPI network, which was then visualized using Cytoscape (Version 3.5.1). 10 MCODE is a plugin for Cytoscape that supports the clustering of the PPI network to build functional modules. A module with MCODE score > 3 and nodes number > 3was provided, based on which we selected the modules with TOP3 MCODE scores for the display.
Survival Analysis
The 533 DEGs were subsequently analyzed for their correlation with the clinical prognosis of patients. The Cox proportional hazard regression model was used to analyze the association between DEGs and the survival period of the patients with Basal like subtype obtained from TCGA. DEGs with P-value < 0.05, which were considered to be significantly different in the Cox regression univariate analysis, were then used to construct the Kaplan-Meier survival curves (Log-rank method) for the patients with Basal like subtype. In this study, we defined DEGs with P < 0.05 in the Cox and Kaplan-Meier analysis as the potential biomarkers. The R packages survival and survminer were used for the univariate Cox and Kaplan-Meier analysis. 11
Reagents and Drugs
Doxorubicin (DOX, Num: HY-15142A) was purchased from MdeChemExpress. DOX was dissolved in 100% dimethyl sulfoxide (DMSO; Fisher Scientific, Pittsburgh, PA, USA). The final concentration of DMSO in the medium did not exceed 0.2% in all cell treatments. FOXD1, DLL3, and LY6D siRNA and primer were purchased from GenePharm (Shanghai, China). The CCK8 kit was purchased from MdeChemExpress. TRIzol reagent was purchased by Invitrogen Life Technologies, Carlsbad, CA, USA. The RT-qPCR kit was from Aidlab Biotechnologies Co., Ltd., Beijing, China. Primary antibody of FOXD1 was purchased by Bioss Co., Ltd., Beijing, China, and primary antibody of DLL3, LY6D were purchased by Proteintech group, Inc.
Cell Transfection
One day prior to the transfection, the cells were seeded in 96-well plates at a density of 1*10ˆ5/ml and cultured in Opti-MEM to achieve a confluency of approximately 50% at the time of transfection. Transfection was performed using Lipofectamine 3000. The medium was changed 4-6 hrs after the transfection, and the cells were incubated in an incubator for 24 hrs.
siFOXD1, SS 5′-GGCAAUUAUUAUUGUACUAUU-3′, AS 5′-UAGUACAAUAAUAAUUGCCAG-3′. siDLL3, SS 5′-GGAUGCACUCAACAACCUAAG-3′, AS 5′-UAGGUUGUUGAGUGCAUCCGG-3′. siLY6D, SS 5′-GCUUCUGCAAGACCACGAACA-3′, AS 5′-UUCGUGGUCUUGCAGAAGCGA-3′.
Cell Culture
By searching the CCLE (Cancer Cell Line Encyclopedia) database, 12 we used the cell line BT549 with relatively high expressions of FOXD1 and DLL3, and the cell line MDA-MB468 with relatively high expression of LY6D. The above cell lines and the non-triple negative breast cancer cell line MCF7 were purchased from the Cell Bank of Shanghai Institute of Cell Biology, CAS, and cultured in the DMEM medium (High glucose, HyClone Company, UT, USA) containing 10% fetal bovine serum (Sijiqing Company, Hangzhou, China) and 100 units/ml penicillin/streptomycin, Gibco / Invitrogen) at 37°C and 5% CO2.
Reverse Transcription-Quantitative Polymerase Chain Reaction (RT-qPCR)
The total RNA was extracted by TRIzol reagent, according to the manufacturer’s instructions. The RT-qPCR assays were performed according to the manufacturer’s instructions of the 2X SYBR Green qPCR kit, which was conducted by an Applied Biosystems ABI Prism 7000 Real-Time PCR System (Applied Biosystems, Foster city, CA, USA). The cycling conditions were as follows: 94°C for 3 min to activate the DNA polymerase, followed by 40 cycles of 95°C for 40 sec, 61°C for 60 sec and 72°C for 40 sec, and then extended at 72°C for 10 min. The reactions for each gene were repeated 3 times and independent experiments were performed in triplicate. The primer sequences were as follows:
FOXD1, forward 5′-TGAGCACTGAGATGTCCGATG′ and reverse 5′-CACCACGTCGATGTCTGTTTC-3′ .
DLL3, forward 5′- CACTCCCGGATGCACTCAAC′ and reverse 5′- GATTCCAATCTACGGACGAGC-3′.
LY6D, forward 5′- TGGGGATTCCACACCTCTCT′ and reverse 5′- GGATCCACAGGGCTTCTGTC-3′.
CCK8
The BT549 and MDA-MB468 cell lines were seeded in 96-well plates at a density of 1*10ˆ5/ml, respectively. After overnight incubation, the cells were transfected with siRNA or negative control siRNA. DOX (0.5uM) was added as single drug or combined with different siRNAs 24 hrs later. After 24 hrs, the medium was removed and CCK8 (10 µl in 100 µl of DMEM) was added to each well, and the plates were incubated at 37°C for 1 hr, followed by the OD value measurement. The cell viability was calculated according to the following formula: cell viability = [(As-Ab) / (Ac-Ab)] * 100%. The experiment was repeated 3 times.
Immunohistochemistry
Paraffin sections were baked at 60°C for 1 hour, dewaxed by xylene (xylene I 10 min, xylene II 10 min), gradient alcohol (100% 3 min, 100% 3 min, 95% 3 min, 90% 3 min, 85% 3 min, 75% 3 min, distilled water 3 min, distilled water 3 min, PBS 3 min). Then used 3% H2O2 to treat the sections and washed with PBS thoroughly. The sealant (5%BSA) was dripped and placed in wet box at room temperature for 30 minutes. The primary antibody (FOXD1, DLL3 and LY6D was respectively 1:100, 1:50 and 1:20) was added and incubated in a wet box at 4°C overnight, and washed with PBS. The biotinylated secondary antibody (1:200) was added and incubated in wet box at room temperature for 20 minutes, and the secondary antibody was washed with PBS. Added horseradin-labeled streptomycin and incubated at room temperature for 20 minutes, and rinse with PBS. DAB color development agent, tap water fully rinse. Then, hematoxylin was redyed, dehydrated, transparent and neutral gum was sealed.
Statistical Analysis
R (Version 3.3) and survival package were used for survival analysis. DEGs with P value less than 0.05 in Cox and Kaplan-Meier analysis were defined as potential biological markers.
Results
Identification of DEGs
The sequencing data were divided into the following 5 groups: group 1: Basal like vs. Normal; group 2: Basal like vs. Her2; group 3: Basal like vs. Luminal A; group 4: Basal like vs. Luminal B; and group 5: Basal like vs. Normal like. We obtained genes that were differentially expressed in the normal tissue of Basal like type compared with other subtypes. According to the threshold of |logFC|≥1.5 and adjust P <0.001, a total of 3306 DEGs were obtained in group 1 (including 2043 up-regulated and 1263 down-regulated genes); a total of 1621 DEGs were obtained in group 2 (including 1016 up-regulated and 605 down-regulated genes); a total of 2576 DEGs were obtained in group 3 (including 1659 up-regulated genes and 917 down-regulated genes); a total of 2514 DEGs were obtained in group 4 (including 1664 up-regulated and 744 down-regulated genes); and a total of 1958 DEGs were obtained in group 5 (including 1214 up-regulated and 744 down-regulated genes). The DEG identified in each group were displayed using a volcano map (Figure 2A, C, E, G, I), and heat maps were plotted to show the 100 genes with the most differential expression in each group (including 50 up-regulated and 50 down-regulated genes) (Figure 2B, D, F, H, J). The information on all DEGs was shown in the Supplementary Document 1. Next, the Venn map was constructed to identify the specific genes with differential expression (Figure 1B) in the Basal like subtype compared to normal tissues and other subtypes, and a total of 533 DEGs (including 431 up-regulated and 102 down-regulated genes) were obtained.
Figure 2.
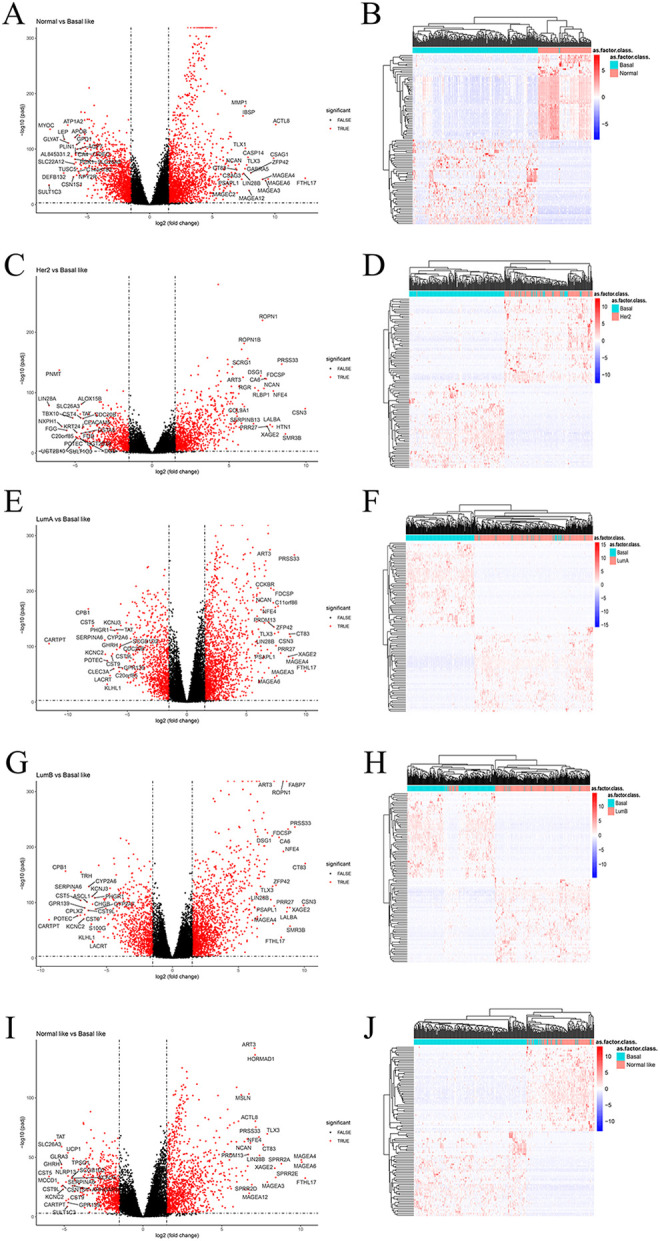
Volcano plot used to display the differentially expressed genes screened in each group. (A) Normal vs. Basal like, (C) Her2 vs. Basal like, (E) Luminal A vs. Basal like, (G) Luminal B vs. Basal like, (I) Normal like vs. Basal like. Heatmap visualization of a subset of the top 50 up- and downregulated DEGs across different groups. (B) Normal vs. Basal like, (D) Her2 vs. Basal like, (F) Luminal A vs. Basal like, (H) Luminal B vs. Basal like, (J) Normal like vs. Basal like.
GO and Pathway Analysis
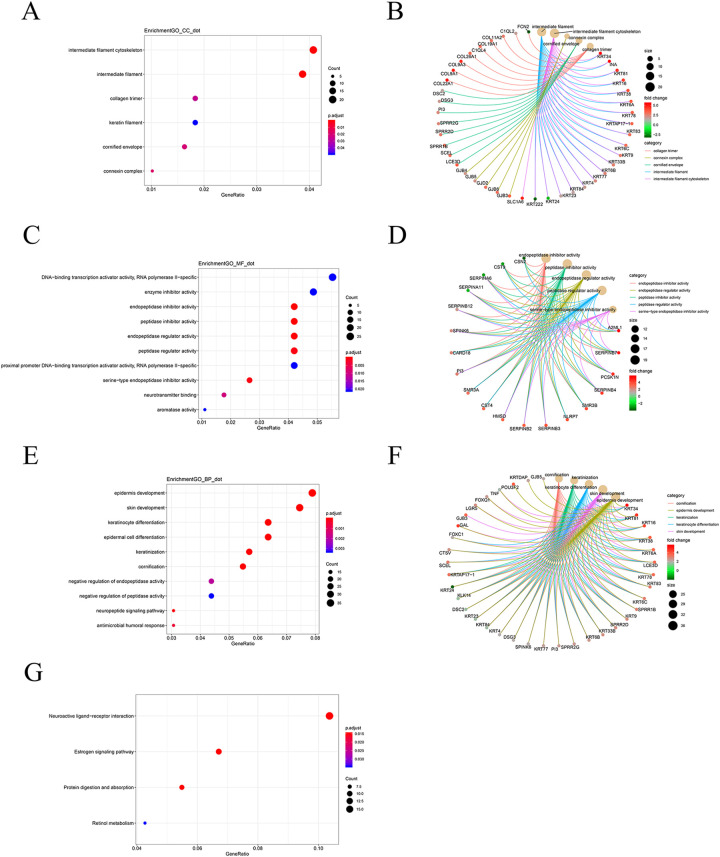
The 533 DEGs were subjected to GO and KEGG pathway analysis to further explore their functions and pathway enrichment. The screening criteria of P <0.05 and Q-value <0.05 were used. For the cellular components, they were significantly enriched in the intermediate filament cytoskeleton, intermediate filament, and collagen trimer (Table S1, Figure 3A); for the molecular functions, they were significantly enriched in the DNA-binding transcription activator activity, RNA polymerase II−specific, enzyme inhibitor activity, and endopeptidase inhibitor activity (Table S2, Figure 3C); and for the biological processes, which were significantly enriched in the epidermis development and skin development (Table S3, Figure 3E). In addition, we also constructed the cnetplot to show the potential biological complexity of the same gene that may belong to multiple annotation categories (Figure 3B, D, F). 9
Figure 3.
GO terms analysis of DEGs using cluster profiler. Cnetplot used to show the potential biological complexity of the same gene that may belong to multiple annotation categories. (A-B) Cellular component (CC), (C-D) molecular function (MF), (E-F) biological process (BP). (G) KEGG pathway enrichment analysis of DEGs.
Next, we performed the KEGG pathway enrichment analysis on these 533 DEGs. The results showed that the most significant pathway for DEGs enrichment was “Neuroactive ligand−receptor interaction.” In addition, there were different degrees of enrichment in “Estrogen signaling pathway,” “Protein digestion and absorption,” and “Retinol metabolism” (Figure 3G).
PPI Network Construction and MCODE
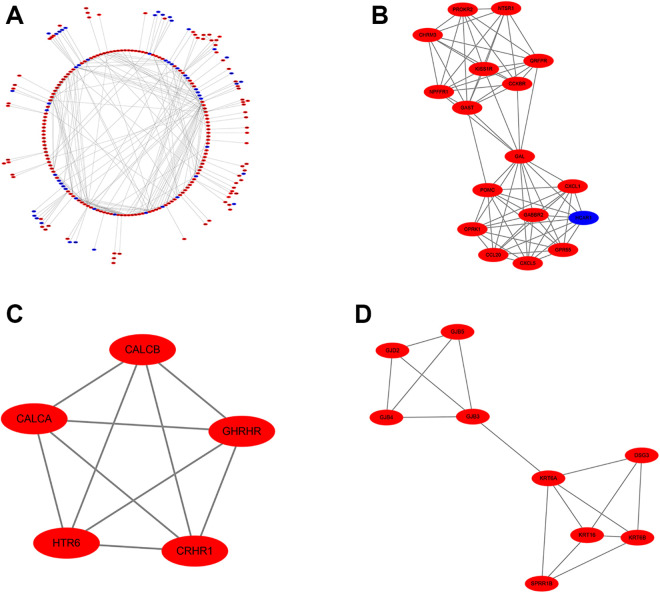
We constructed the PPI network of the identified DEGs with STRING database, and then visualized the PPI network using Cytoscape (Version 3.5.1). As shown in Figure 4A, 517 nodes and 500 edges with PPI enrichment P-value < 1.0e-16, were identified. Based on the PPI network, we used MCODE for the module analysis and selected the 3 highest-rated modules for display (Figure 4B, C, and D).
Figure 4.
(A) The PPI network visualizated by Cytoscape for the DEGs. Red and blue circles represent up-regulated and down-regulated genes, respectively. Top 3 modules from the protein-protein interaction network. (B) Module 1, (C) module 2, (D) module 3.
Survival Analysis
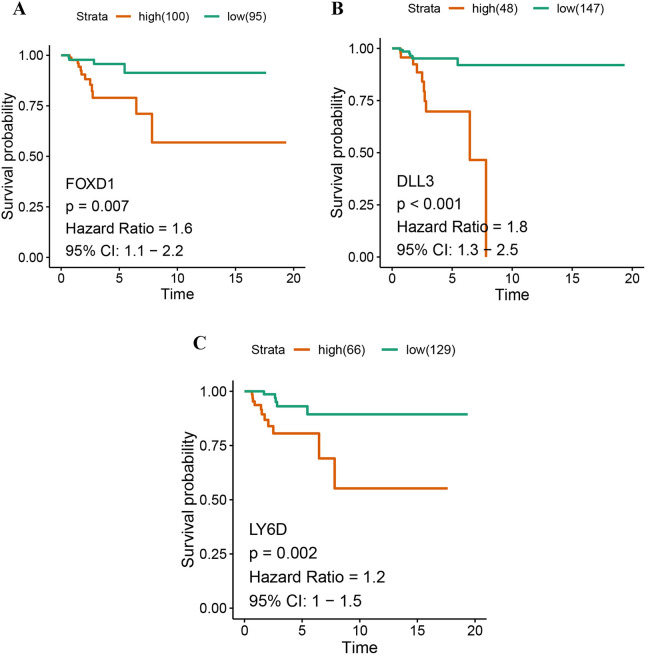
By analyzing the association between DEGs and survival period of the patients with Basal like type, the biomarkers with significant effects on survival were identified. DEGs with P-value <0.05 were considered to be significantly different in the Cox regression univariate analysis, and then, they were used to construct the Kaplan-Meier survival curve (Log-rank method) of the patients with Basal like subtype. In this study, we defined DEGs with P < 0.05 in the Cox and Kaplan-Meier analysis as the potential biomarkers. The results showed that FOXD1 (HR = 1.6, 95% CI (1.1-2.2), P = 0.01, log rank P = 0.0065) (Figure 5A), DLL3 (HR = 1.8, 95% CI (1.3-2.5)), P = 0.0011, log rank P <0.001) (Figure 5B), andLY6D (HR = 1.2, 95% CI (1-1.5), P = 0.016, log rank P = 0.0015) (Figure 5C) were negatively associated with the survival of the patients with Basal like type.
Figure 5.
Prognostic value of 3 genes—FOXD1 (A), DLL3 (B), LY6D (C)—in Basal-like cancer patients.
CCK8 Analysis
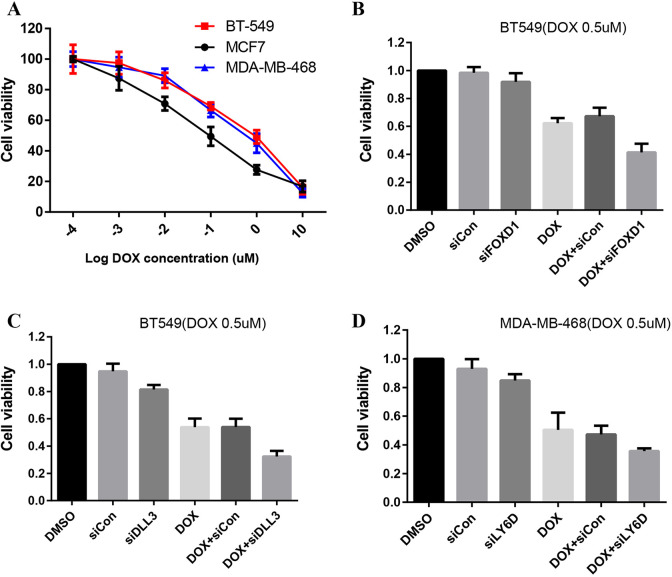
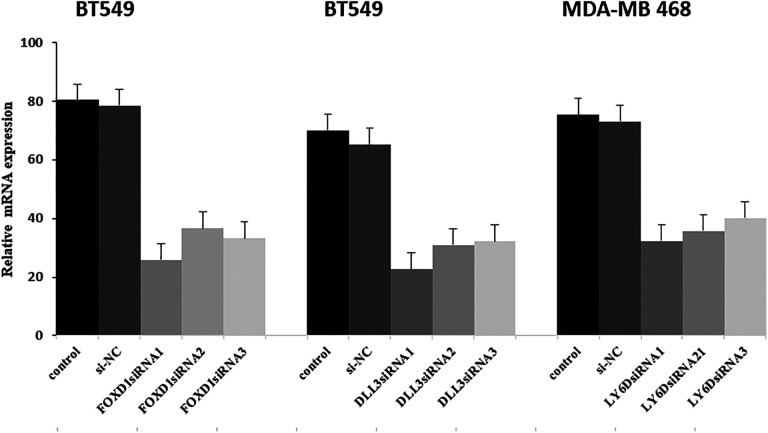
Compared to BT549 and MDA-MB468, MCF7 was more sensitive to DOX (P < 0.05, Figure 6A). At the same concentration(DOX 0.5uM), compared with the group which was treated with DOX alone, the groups treated with DOX combined with siRNA knockdown of FOXD1, DLL3, and LY6D showed more cytotoxicity (Figure 6B, C, and D). The efficiency of siRNA was performed by RT-PCR (Figure 7).
Figure 6.
Cytotoxicity of doxorubicin for breast cancer cell lines. Cell viability was assessed by CCK-8 assay, each group was repeated for 3 time. The data of group was analyzed by T test, value of P < 0.05 was significant statistical differences between the groups. The error bars represent SD. These 3 cell lines show different sensitivity to DOX (A). BT549 cells were treated with 0.5 μM DOX alone or combined with si-FOXD1 respectively, DMSO acted as the control, and then subjected to CCK8 assay (B). BT549 cells were treated with 0.5 μM DOX alone or combined with si-DLL3 respectively, DMSO acted as the control, and then subjected to CCK8 assay (C). MDA-MB-468 cells were treated with 0.5 μM DOX alone or combined with si-LY6D respectively, DMSO acted as the control, and then subjected to CCK8 assay (D).
Figure 7.
The transfection efficiency of si-FOXD1, si-DLL3 and si-LY6D were verified by RT-PCR.
Immunohistochemistry
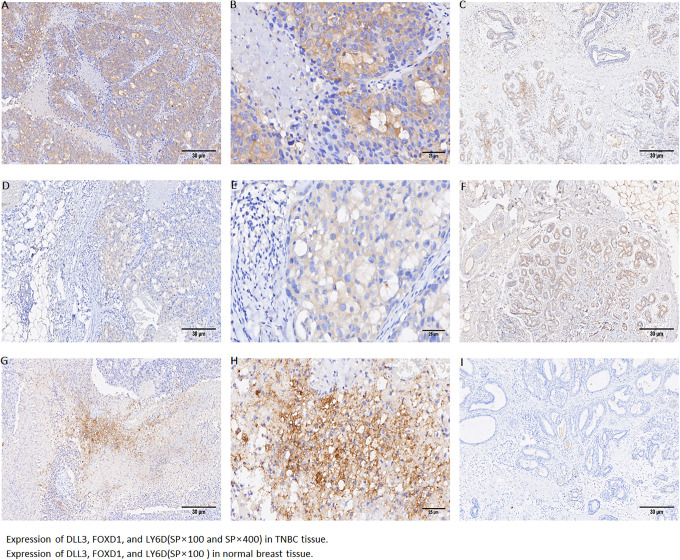
Immunohistochemical analysis was performed on the normal breast tissue and tumor tissues with the molecular subtype of triple negative breast cancer, as shown in the Figure 8.
Figure 8.
Expression of DLL3, FOXD1, and LY6D (SP×100 and SP×400) in TNBC tissue: Expression of DLL3 in TNBC tissue (SP×100 and SP×400) (A, B). Expression of FOXD1 in TNBC tissue (SP×100 and SP×400) (D, E). Expression of LY6D in TNBC tissue (SP×100 and SP×400) (G, H). Expression of DLL3, FOXD1, and LY6D (SP×100) in normal breast tissue (C, F, I).
Discussion
TNBC is a subtype of breast cancer with worse prognosis than other molecular subtypes. Although chemotherapy has achieved some progress, and pathological complete remission can be achieved after neoadjuvant therapy, the metastasis rate of INBC is still higher than other subtypes, and the prognosis is poorer. 13 Recently, with the development of high-throughput sequencing and bioinformatics, the understanding of the molecular mechanism of cancers is also deepening. As a publicly funded project, TCGA aims to identify major oncogene variability and has developed a comprehensive review of cancer genome. This study aimed to identify the potential biomarkers in TNBC by analyzing the TCGA transcriptome sequencing data. The DEGs were identified by comparing the transcriptome data of Basal like type with the data of normal and other subtypes, and bioinformatics analysis and in vitro experiments were performed.
First, the GO analysis of cellular components revealed that the 533 DEGs were significantly enriched in “intermediate filament cytoskeleton,” and “intermediate filament.” It plays an important role in cell migration and invasion, as well as in immune response, tissue renewal, or wound healing. This ability of migration plays a key role tumor development as it promotes cancer cells to invade adjacent tissues, thus leading to metastasis. 14 At present, although the role of actin and microtubule cytoskeleton networks is relatively clear, 15,16 the role of intermediate filaments (IFs) still needs to be further explored. It has been demonstrated that the expression of a particular subset of IF proteins can be commonly used as a biomarker to identify the origin tissue of tumor. IF expression and compositions are also used to determine the progression of cancer, indicating that they reveal, to some extent, the ability of cell invasion. 17,18
Second, the GO analysis of molecular functional enrichment showed that DEGs were mainly enriched in the transcription factor, activity and RNA polymerase II core promoter proximal region sequence-specific binding. Phosphorylation of RNA polymerase II is necessary for the initiation and elongation of transcription, and inhibiting this process leads to cell death in the preclinical model of TNBC. 19
Third, the GO analysis of biological processes showed that DEGs were significantly enriched in such processes as epidermis development, skin development, and epidermal cell differentiation. Epidermal proliferation is a strictly controlled process. Genetic alterations in the signaling pathways that regulate the proliferation and differentiation of keratinocytes may disrupt this balance and lead to pathological changes including carcinogenesis. 20
Subsequently, in order to analyze the signal pathways in which DEGs were enriched, we performed the KEGG pathway analysis, and the results showed that the Neuroactive ligand−receptor interaction pathway showed significant enrichment. It is shown that in the pan-cancer analysis using the TCGA data, this pathway ranks the fifth in the malignant tumor mutation pathways. 21 This pathway is the most significant in patients with gliomas and is associated with poor prognosis. 22 In addition, other study has shown that changes in the expression level of this pathway may affect lung cancer risks. 23
In summary, these DEGs play important roles in many biological processes, some of which have been fully annotated, but the mechanisms associated with TNBC still need further studies.
Later, we constructed a PPI network using these DEGs, aiming to analyze the interactions. In addition, the survival analysis was performed with clinical information of patients in the TCGA database to determine the relationship between these DEGs and patients’ outcomes. KM and COX survival analysis were conducted on 533 DEGs to screen for survival-related Hubgenes, which screened by the Survival package in R language. The candidate gene was defined as the P value of both KM and COX were < 0.05. We found that FOXD1, DLL3, and LY6D were negatively associated with the survival of patients with Basal like type.
FOXD1 belongs to the forkhead family of transcription factors. This family is widely present in the process of biological evolution and is involved in many molecular cascades and biological functions, such as the embryonic development, cell cycle regulation, metabolic regulation, and signal transduction. The dysfunction of FOXD1 is associated with a variety of diseases; therefore, it may be a biomarker and potential therapeutic target. 24 Studies have shown that it promotes the cell growth and metastasis of NSCLC, 25 and the downregulation of FOXD1can inhibit cell proliferation and migration of LSCC cells. 26 The deletion of FOXD1 can inhibit the invasion and migration of melanoma, glioma, and osteosarcoma to some extent. 27 -29 Recent study reported that the over-expression of FOXD1 promoted the proliferation, migration, invasion of nasopharyngeal carcinoma cells. 30 Bai et al, revealed identified potential therapeutic target genes for breast cancer (BC) by the investigation of gene expression changes after ionizing radiation (IR) in BC cells, and found FOXD1 was one of the hub nodes in the transcriptional regulatory network of the overlapping DEGs. 31 Another bioinformatics analysis also revealed FOXD1 was the breast cancer survival related gene. 32 Zhao et al reported that FOXD1 was up-regulated in breast cancer tissues, and depletion of FOXD1 expression decreases the ability of cell proliferation and chemoresistance in MDA-MB-231 cells. 33 In this study, we silenced FOXD1 in the TNBC breast cancer cell line BT549 by the means of RNA interference. Consistently, we found that compared with the group administrated with DOX alone, the cytotoxicity of DOX combined with si-FOXD1 was stronger.
DLL3 (Delta Like Canonical Notch Ligand 3) encodes the members of the δ protein ligand family. This family functions as a Notch ligand and is characterized in its DSL domain, an EGF repeat and transmembrane domain. Members of this family play important roles in the progression of cancers. A retrospective study suggests that up-regulated DLL3 protein can be used as a diagnostic and prognostic marker for endometrial cancer. The study stated that the high expression of DLL3 was associated with patients’ ages (odds ratio [OR] = 1.74), advanced stages of the International Federation of Gynecology and Obstetrics system (OR = 2.9), grade III/IV (OR = 5.1), myometrial invasion (OR = 2.2), pelvic involvement (OR = 12.9), and para-aortic lymph node metastasis (OR = 9.9) (P < 0.001). According to Spino M, DLL3 can serve as a potential target for the treatment of Isocitrate Dehydrogenase-mutant Glioma. 34 DLL3 was overexpressed in small cell lung cancer (SCLC), which caused a poorer prognosis. 35 Matsuo et al reported that DLL3 was expressed in neuroendocrine cells of the gastrointestinal tract and that might play a pivotal role in gastrointestinal neuroendocrine carcinoma cells. 36 Zhang et al reported silencing Nothc4/Dll3 could decrease endothelial markers and function of tumor-derived endothelial cells under chemotherapy treatment in breast cancer. 37 The investigation of DLL3 was limited, but the above research was consistent with our results.
LY6D (Lymphocyte Antigen 6 Family Member D) is a member of the lymphocyte antigen family 6 (Ly6). A single-cell sequencing study showed that LY6D may be a prognostic factor for advanced prostate cancer. 38 In another study, Rubinfeld B demonstrated that LY6D/E48 antibody in combination with irinotecan achieved significant efficacy in the human xenograft model of Colo205. 39 LY6D is upregulated in laryngeal cancer and may serve as a biomarker for chemoresistance in laryngeal squamous cell carcinoma. 40 Mayama et al analyzed the biomarkers associated with distant metastasis by microarray and immunohistochemistry, and the results suggested that LY6D was a potent marker for distant metastasis of ER-positive breast cancer patients. 41 Luo et al reported that LY6D was overexpressed in breast cancer, and was associated with poor outcome. 42 The CCK8 analysis in this study also showed that DOX combined with si-LY6D significantly inhibited the cell viability of tumor cells.
Conclusion
In summary, this study identified the DEGs between Basal like and other subtypes/normal tissues in the TCGA database using bioinformatics. The key functions and pathways of DEGs enrichment were subsequently identified. In addition, by combining patients’ clinical information, the genes that were closely related to patients’ prognosis were further identified by Cox regression univariate analysis and Kaplan-Meier survival analtsus. Subsequent cell experiments were performed to silence FOXD1, DLL3, and LY6D using the RNA interference technique, which further confirm the relationship between them and the Basal like type. This study provides new insights for exploring underlying mechanisms of Basal like type breast cancer and may provide potential biomarkers for its diagnosis and prognosis.
Supplemental Material
Supplemental Material, sj-csv-1-tct-10.1177_15330338211019506 for Investigation of Candidate Genes and Pathways in Basal/TNBC Patients by Integrated Analysis by Qi Liu, Xiang Song, Zhaoyun Liu and Zhiyong Yu in Technology in Cancer Research & Treatment
Supplemental Material, sj-csv-2-tct-10.1177_15330338211019506 for Investigation of Candidate Genes and Pathways in Basal/TNBC Patients by Integrated Analysis by Qi Liu, Xiang Song, Zhaoyun Liu and Zhiyong Yu in Technology in Cancer Research & Treatment
Supplemental Material, sj-csv-3-tct-10.1177_15330338211019506 for Investigation of Candidate Genes and Pathways in Basal/TNBC Patients by Integrated Analysis by Qi Liu, Xiang Song, Zhaoyun Liu and Zhiyong Yu in Technology in Cancer Research & Treatment
Supplemental Material, sj-csv-4-tct-10.1177_15330338211019506 for Investigation of Candidate Genes and Pathways in Basal/TNBC Patients by Integrated Analysis by Qi Liu, Xiang Song, Zhaoyun Liu and Zhiyong Yu in Technology in Cancer Research & Treatment
Supplemental Material, sj-csv-5-tct-10.1177_15330338211019506 for Investigation of Candidate Genes and Pathways in Basal/TNBC Patients by Integrated Analysis by Qi Liu, Xiang Song, Zhaoyun Liu and Zhiyong Yu in Technology in Cancer Research & Treatment
Footnotes
Authors’ Note: Qi Liu and Xiang Song contributed equally to this work.
Declaration of Conflicting Interests: The author(s) declared no potential conflicts of interest with respect to the research, authorship, and/or publication of this article.
Funding: The author(s) disclosed receipt of the following financial support for the research, authorship, and/or publication of this article: Research was supported by grants from the Natural Science Foundation of Shandong Province (ZR2017PH055) and Key Research and Development Program of Shandong Province (2018GSF118089).
ORCID iD: Qi Liu  https://orcid.org/0000-0003-4217-0641
Supplemental Material: Supplemental material for this article is available online.
References
- 1. Siegel R, Naishadham D, Jemal A. Cancer statistics, 2012. CA Cancer J Clin. 2012;62(1):10–29. [DOI] [PubMed] [Google Scholar]
- 2. Foulkes WD, Smith IE, Reis-Filho JS. Triple-negative breast cancer. N Engl J Med. 2010;363(20):1938–1948. [DOI] [PubMed] [Google Scholar]
- 3. Rakha EA, El-Rehim DA, Paish C, et al. Basal phenotype identifies a poor prognostic subgroup of breast cancer of clinical importance. Eur J Cancer. 2006;42(18):3149–3156. [DOI] [PubMed] [Google Scholar]
- 4. Burstein MD, Tsimelzon A, Poage GM, et al. Comprehensive genomic analysis identifies novel subtypes and targets of triple-negative breast cancer. Clin Cancer Res. 2015;21(7):1688–1698. [DOI] [PMC free article] [PubMed] [Google Scholar]
- 5. Willett CG, Chang DT, Czito BG, Meyer J, Wo J. Cancer Genome Atlas Network. Comprehensive molecular characterization of human colon and rectal cancer. Nature. 2012;(5). Int J Radiat Oncol Biol Phys. 2013;86(1). [DOI] [PMC free article] [PubMed] [Google Scholar]
- 6. Love MI, Anders S, Huber W. Analyzing RNA-seq data with DESeq2. R package reference manual. 2017. [DOI] [PMC free article] [PubMed]
- 7. Gaujoux R. Generating Heatmaps for Nonnegative Matrix Factorization. R Foundation for Statistical Computing; 2014. [Google Scholar]
- 8. Wickham H. ggplot2: Elegant Graphics for Data Analysis (Use R!) . Springer; 2010. [Google Scholar]
- 9. Yu G. Statistical analysis and visualization of functional profiles for genes and gene clusters. J Int Biology. 2012;16(5):284–287. [DOI] [PMC free article] [PubMed] [Google Scholar]
- 10. Shannon P, Markiel A, Ozier O, et al. Cytoscape: a software environment for integrated models of biomolecular interaction networks. Genome Res. 2003;13(11):2498–2504. [DOI] [PMC free article] [PubMed] [Google Scholar]
- 11. Kassambara A, Kosinski M, Biecek P. Survminer: drawing survival curves using’ggplot2’. R package version 03. 2017;1.
- 12. Barretina J, Caponigro G, Stransky N, et al. The cancer cell line encyclopedia enables predictive modelling of anticancer drug sensitivity. Nature. 2012;483(7391):603. [DOI] [PMC free article] [PubMed] [Google Scholar]
- 13. Carey LA, Perou CM, Livasy CA, et al. Race, breast cancer subtypes, and survival in the Carolina breast cancer study. JAMA. 2006;295(21):2492–2502. [DOI] [PubMed] [Google Scholar]
- 14. Leduc C, Etienne-Manneville S. Intermediate filaments in cell migration and invasion: the unusual suspects. Curr Opin Cell Biol. 2015;32:102–112. [DOI] [PubMed] [Google Scholar]
- 15. Etienne-Manneville S. Microtubules in cell migration. Annu Rev Cell Dev Biol. 2013;29:471–499. [DOI] [PubMed] [Google Scholar]
- 16. Woodham EF, Machesky LM. Polarised cell migration: intrinsic and extrinsic drivers. Curr Opin Cell Biol. 2014;30:25–32. [DOI] [PubMed] [Google Scholar]
- 17. Eriksson JE, Dechat T, Grin B, et al. Introducing intermediate filaments: from discovery to disease. J Clin Invest. 2009;119(7):1763–1771. [DOI] [PMC free article] [PubMed] [Google Scholar]
- 18. Chung B-M, Rotty JD, Coulombe PA. Networking galore: intermediate filaments and cell migration. Curr Opin Cell Biol. 2013;25(5):600–612. [DOI] [PMC free article] [PubMed] [Google Scholar]
- 19. Wang Y, Zhang T, Kwiatkowski N, et al. CDK7-dependent transcriptional addiction in triple-negative breast cancer. Cell. 2015;163(1):174–186. [DOI] [PMC free article] [PubMed] [Google Scholar]
- 20. Drosten M, Lechuga C, Barbacid M. Ras signaling is essential for skin development. Oncogene. 2014;33(22):2857. [DOI] [PubMed] [Google Scholar]
- 21. Dees ND, Zhang Q, Kandoth C, et al. MuSiC: identifying mutational significance in cancer genomes. Genome Res. 2012;22(8):1589–1598. [DOI] [PMC free article] [PubMed] [Google Scholar]
- 22. Pal J, Patil V, Kumar A, Kaur K, Sarkar C, Somasundaram K. Loss-of-function mutations in calcitonin receptor (CALCR) identify highly aggressive glioblastoma with poor outcome. Clin Cancer Res. 2018;24(6):1448–1458. [DOI] [PubMed] [Google Scholar]
- 23. Ji X, Bossé Y, Landi MT, et al. Identification of susceptibility pathways for the role of chromosome 15q25. 1 in modifying lung cancer risk. Nat Commun. 2018;9(1):3221. [DOI] [PMC free article] [PubMed] [Google Scholar]
- 24. Quintero-Ronderos P, Laissue P. The multisystemic functions of FOXD1 in development and disease. J Mol Med (Berl). 2018:96(8):725–739. [DOI] [PubMed] [Google Scholar]
- 25. Li D, Fan S, Yu F, et al. FOXD1 promotes cell growth and metastasis by activation of vimentin in NSCLC. Cell Physiol Biochem. 2018;51(6):2716–2731. [DOI] [PubMed] [Google Scholar]
- 26. Chen C, Tang J, Xu S, Zhang W, Jiang H. miR-30a-5p inhibits proliferation and migration of lung squamous cell carcinoma cells by targeting FOXD1. Biomed Res Int. 2020;2020(9):1–14. [DOI] [PMC free article] [PubMed] [Google Scholar] [Retracted]
- 27. Wu H, Larribère L, Sun Q, et al. Loss of neural crest-associated gene FOXD1 impairs melanoma invasion and migration via RAC1B downregulation. Int J Cancer. 2018;143(11):2962–2972. [DOI] [PubMed] [Google Scholar]
- 28. Xin-Long M, Shang F, Wei N, Zhu J, Luo B, Zhang YQ. MicroRNA-338-5p plays a tumor suppressor role in glioma through inhibition of the MAPK-signaling pathway by binding to FOXD1. J Cancer Res Clin Oncol. 2018;144(12):2351–2366. [DOI] [PMC free article] [PubMed] [Google Scholar]
- 29. Jun T, Haibo C, Hongyan W, et al. MiR-30a-5p inhibits osteosarcoma cell proliferation and migration by targeting FOXD1. Biochem Biophys Res Commun. 2018:503(2):1092–1097. S0006291X18314335-. [DOI] [PubMed] [Google Scholar]
- 30. Zhang Y, Zhang W. FOXD1, negatively regulated by miR-186, promotes the proliferation, metastasis and radioresistance of nasopharyngeal carcinoma cells. Cancer Biomark. 2020:28(4):511–521. [DOI] [PubMed] [Google Scholar]
- 31. Bai J, Luo Y, Zhang S. Microarray data analysis reveals gene expression changes in response to ionizing radiation in MCF7 human breast cancer cells. Hereditas. 2020;157(1):37. [DOI] [PMC free article] [PubMed] [Google Scholar]
- 32. Zhang Y, Yang W, Li D, Yang JY, Guan R, Yang MQ. Toward the precision breast cancer survival prediction utilizing combined whole genome-wide expression and somatic mutation analysis. BMC Med Genomics. 2018;11(Suppl 5):104. doi:10.1186/s12920-018-0419-x. PMID: 30454048; PMCID: PMC6245494 [DOI] [PMC free article] [PubMed] [Google Scholar]
- 33. Zhao YF, Zhao JY, Yue H, et al. FOXD1 promotes breast cancer proliferation and chemotherapeutic drug resistance by targeting p27. Biochem Biophys Res Commun. 2015;456(1):232–237. [DOI] [PubMed] [Google Scholar]
- 34. Spino M, Kurz SC, Chiriboga L, et al. Cell surface Notch ligand DLL3 is a therapeutic target in isocitrate dehydrogenase mutant glioma. Clin Cancer Res. 2019;25(4):1261–1271. [DOI] [PMC free article] [PubMed] [Google Scholar]
- 35. Regzedmaa O, Li Y, Li Y, et al. Prevalence of DLL3, CTLA-4 and MSTN expression in patients with small cell lung cancer. Onco Targets Ther. 2019;12:10043–10055. [DOI] [PMC free article] [PubMed] [Google Scholar]
- 36. Matsuo K, Taniguchi K, Hamamoto H, et al. Delta-like 3 localizes to neuroendocrine cells and plays a pivotal role in gastrointestinal neuroendocrine malignancy. Cancer Sci. 2019;10(10):3122–3131. [DOI] [PMC free article] [PubMed] [Google Scholar]
- 37. Zhang P, He D, Chen Z, et al. Chemotherapy enhances tumor vascularization via notch signaling-mediated formation of tumor-derived endothelium in breast cancer. Biochem Pharmacol. 2016:18–30. [DOI] [PubMed] [Google Scholar]
- 38. Barros-Silva, João D, Linn DE, et al. Single-cell analysis identifies LY6D as a marker linking castration-resistant prostate luminal cells to prostate progenitors and cancer. Cell Rep. 2018;25(12):3504. [DOI] [PMC free article] [PubMed] [Google Scholar]
- 39. Rubinfeld B, Upadhyay A, Clark SL, et al. Identification and immunotherapeutic targeting of antigens induced by chemotherapy. Nat Biotechnol. 2006;24(2):205–209. [DOI] [PubMed] [Google Scholar]
- 40. Wang J, Fan J, Gao W, et al. LY6D as a chemoresistance marker gene and therapeutic target for laryngeal squamous cell carcinoma . Stem Cells Dev. 2020;29(12):774–785. [DOI] [PubMed] [Google Scholar]
- 41. Mayama A, Takagi K, Suzuki H, et al. OLFM4, LY6D and S100A7 as potent markers for distant metastasis in estrogen receptor-positive breast carcinoma. Cancer Sci. 2018;109(10):3350–3359. [DOI] [PMC free article] [PubMed] [Google Scholar]
- 42. Luo L, Mcgarvey PB, Madhavan S, Kumar R, Gusev Y, Upadhyay G. Distinct lymphocyte antigens 6 (Ly6) family members Ly6D, Ly6E, Ly6 K and Ly6 H drive tumorigenesis and clinical outcome. Oncotarget. 2016;7(10):11165–11193. [DOI] [PMC free article] [PubMed] [Google Scholar]
Associated Data
This section collects any data citations, data availability statements, or supplementary materials included in this article.
Supplementary Materials
Supplemental Material, sj-csv-1-tct-10.1177_15330338211019506 for Investigation of Candidate Genes and Pathways in Basal/TNBC Patients by Integrated Analysis by Qi Liu, Xiang Song, Zhaoyun Liu and Zhiyong Yu in Technology in Cancer Research & Treatment
Supplemental Material, sj-csv-2-tct-10.1177_15330338211019506 for Investigation of Candidate Genes and Pathways in Basal/TNBC Patients by Integrated Analysis by Qi Liu, Xiang Song, Zhaoyun Liu and Zhiyong Yu in Technology in Cancer Research & Treatment
Supplemental Material, sj-csv-3-tct-10.1177_15330338211019506 for Investigation of Candidate Genes and Pathways in Basal/TNBC Patients by Integrated Analysis by Qi Liu, Xiang Song, Zhaoyun Liu and Zhiyong Yu in Technology in Cancer Research & Treatment
Supplemental Material, sj-csv-4-tct-10.1177_15330338211019506 for Investigation of Candidate Genes and Pathways in Basal/TNBC Patients by Integrated Analysis by Qi Liu, Xiang Song, Zhaoyun Liu and Zhiyong Yu in Technology in Cancer Research & Treatment
Supplemental Material, sj-csv-5-tct-10.1177_15330338211019506 for Investigation of Candidate Genes and Pathways in Basal/TNBC Patients by Integrated Analysis by Qi Liu, Xiang Song, Zhaoyun Liu and Zhiyong Yu in Technology in Cancer Research & Treatment


