The initiation of cell division integrates a large number of intra- and extracellular inputs. D-type cyclins (hereafter, cyclin D) couple these inputs to the initiation of DNA replication1. Increased levels of cyclin D promote cell division by activating cyclin-dependent kinases 4 and 6 (hereafter, CDK4/6), which in turn phosphorylate and inactivate the retinoblastoma tumour suppressor. Accordingly, increased levels and activity of cyclin D–CDK4/6 complexes are strongly linked to unchecked cell proliferation and cancer2,3. However, the mechanisms that regulate levels of cyclin D are incompletely understood4,5. Here we show that autophagy and beclin 1 regulator 1 (AMBRA1) is the main regulator of the degradation of cyclin D. We identified AMBRA1 in a genome-wide screen to investigate the genetic basis of the response to CDK4/6 inhibition. Loss of AMBRA1 results in high levels of cyclin D in cells and in mice, which promotes proliferation and decreases sensitivity to CDK4/6 inhibition. Mechanistically, AMBRA1 mediates ubiquitylation and proteasomal degradation of cyclin D as a substrate receptor for the cullin 4 E3 ligase complex. Loss of AMBRA1 enhances the growth of lung adenocarcinoma in a mouse model, and low levels of AMBRA1 correlate with worse survival in patients with lung adenocarcinoma. Thus, AMBRA1 regulates cellular levels of cyclin D, and contributes to cancer development and the response of cancer cells to CDK4/6 inhibitors.
CDK4/6 inhibitors have been approved to treat breast cancer, and are under investigation for the treatment of many additional types of cancer6. Clinical and preclinical studies have begun to identify mechanisms of inherent or acquired resistance to these inhibitors, such as loss of the retinoblastoma tumour-suppressor protein (RB) or upregulation of cyclin E (an activator of CDK2, which can in turn phosphorylate and inactivate RB)7,8. However, many cases of resistance lack a clear molecular basis9. To address this gap in knowledge, we sought to identify genes, in an unbiased manner, whose loss affects sensitivity to the CDK4/6 inhibitor palbociclib, with the hope that this approach may help us to better understand the regulatory networks that control cell cycle progression.
AMBRA1 loss dampens response to CDK4/6 inhibitors
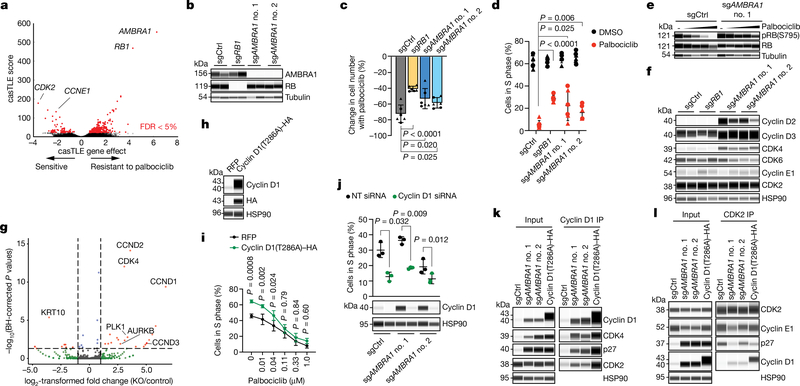
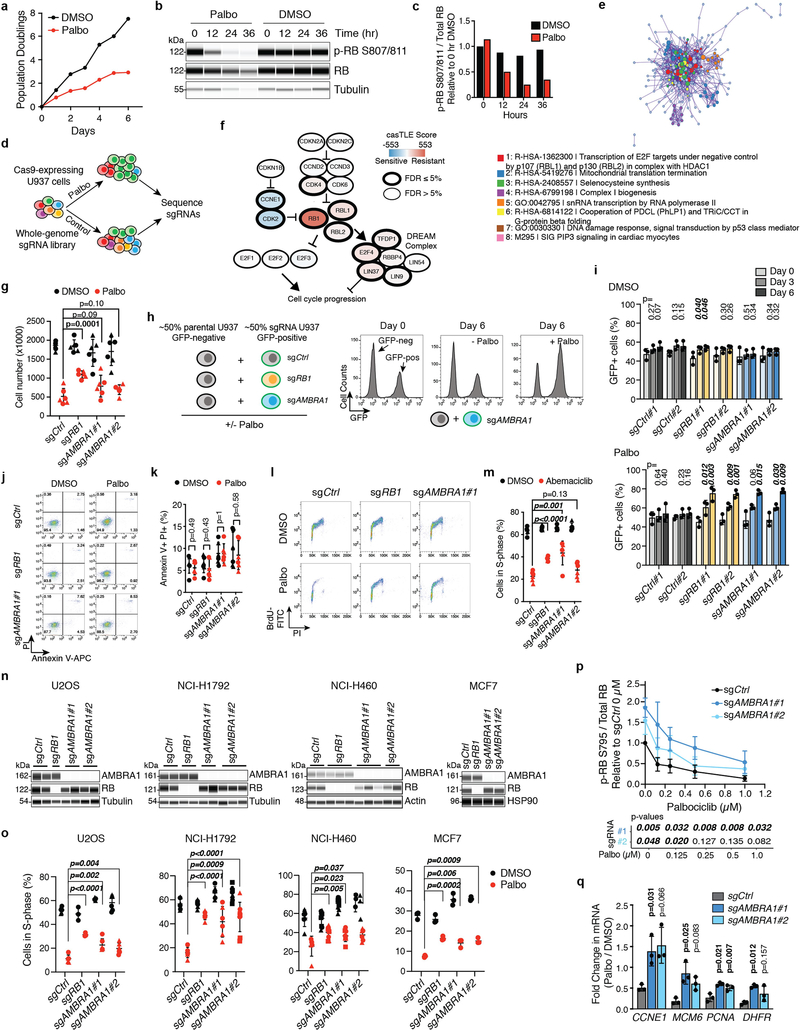
We performed a genome-wide CRISPR–Cas9 screen in U937 cells and identified hundreds of genes whose knockout significantly altered proliferation under palbociclib treatment, including known members of the RB pathway (Fig. 1a, Extended Data Fig. 1a–f, Supplementary Tables 1–3). We investigated AMBRA1 further because the loss of this gene had the largest protective effect. The growth advantage of U937 AMBRAl-knockout and RB1 (which encodes RB)-knockout cells upon palbociclib treatment was validated in independent clones and was associated with impaired cell cycle arrest (Fig. 1b–d, Extended Data Fig. 1g–l, Supplementary Fig. 1). A similar decreased sensitivity to CDK4/6 inhibition upon AMBRA1 knockout was observed with abemaciclib (another CDK4/6 inhibitor), as well as in four additional cancer cell lines that contain wild-type RB (Extended Data Fig. 1m–o).
Fig. 1 |. AMBRA1 loss regulates the response to CDK4/6 inhibition as well as levels of cyclin D.
a, Volcano plot of a CRISPR–Cas9 screen for genes that regulate the response to palbociclib in U937 cells, analysed using the Cas9 high-throughput maximum likelihood estimator (casTLE). FDR, false-discovery rate. b, Immunoassay for AMBRA1 or RB in control and AMBRA1- or RB1-knockout U937 cl ones. sgAMBRA1 no. 1 and no. 2 denote two different sgRNAs against AMBRA1; sgCtrl, control sgRNA. c, Change in U937 cell numbers after a 48-h treatment with 0.5 μM palbociclib or DMSO. d, BrdU and propidium iodide staining analysis of cycling S-phase U937 cells treated with 0.5 μM palbociclib for 24 h. Each symbol in c, d is an isogenic clone (n = 3 biological replicates per clone). e, Immunoassay of RB phosphorylation (at S795) in U937 cells treated with increasing doses of palbociclib or DMSO (−) for 24 h. f, Immunoassay of G1 cyclins and cyclin-dependent kinases in U937 clones. U937 cells do not express cyclin D1. g, Volcano plot of shotgun mass spectrometry comparing control and AMBRA1-knockout (KO) U2OS cells. Significant hits (|log2-transformed fold change| > 1, adjusted P < 0.05) are in red. BH, Benjamin–Hochberg. h, Immunoassay of cyclin D1 and haemagglutinin (HA) in U2OS cells overexpressing HA-tagged, stabilized cyclin D1 (cyclin D1(T286A)–HA) or red fluorescent protein (RFP) control. i, Analysis of cycling S-phase cells from h treated with increasing doses of palbociclib for 24 h (n = 3 biological replicates). j, Top, analysis of cycling S-phase U2OS cells after cyclin D1 (CCND1) knockdown by siRNA pools. Bottom, corresponding immunoassay 48 h after siRNA transfection (n = 3 biological replicates). NT, non-targeting control. k, l, Co-immunoprecipitation (IP) of cyclin D1 (k) and CDK2 (l) in control, AMBRA1-knockout and cyclin-D1(T286A)-overexpressing U2OS cells, and immunoassay of relevant protein complexes (n = 1 (k) or n = 2 (l) biological replicates). Tubulin and HSP90 are loading controls. All data are mean ± s.d. P values calculated by two-sided unpaired t-test (c, d), negative binomial test (g), two-way analysis of variance (ANOVA) with post hoc Sidak test (i, ANOVA Pcell line < 0.0001) and two-sided paired t-test (j).
Levels of cyclin D increase upon AMBRA1 loss
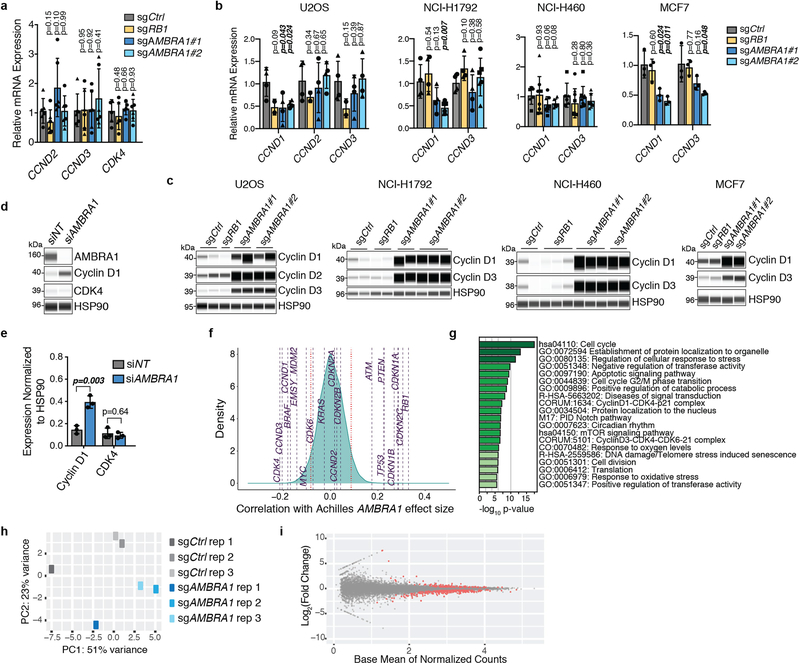
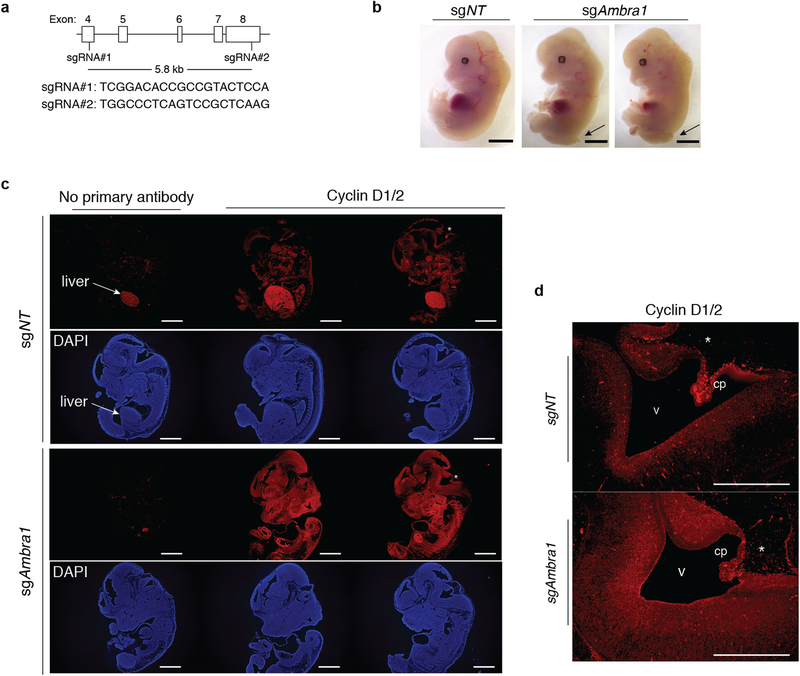
AMBRAl-knockout cells showed increased phosphorylation of RB and cell-cycle gene expression with palbociclib treatment compared to control cells (Fig. 1e, Extended Data Fig. 1p, q), which suggested an increased activity of cyclin-dependent kinases. Accordingly, we observed a notable increase of proteins in the cyclin-D family and a modest increase in CDK4 in all of the AMBRA1-knockout cell lines that we tested (Fig. 1f, Extended Data Fig. 2a–c). Acute knockdown of AMBRA1 using short interfering RNA (siRNA) suggested that increased levels of cyclin D are a more immediate consequence of AMBRA1 loss than are increases in CDK4 (Extended Data Fig. 2d, e). Codependency data from the Cancer Dependency Map further suggested a functional link between AMBRA1 and the RB pathway (Extended Data Fig. 2f, g, Supplementary Table 4). Our RNA-sequencing analysis of control and AMBRA1-knockout cells showed few statistically significant (P < 0.01) differences between the two genotypes (Extended Data Fig. 2h, i, Supplementary Table 5). We performed shotgun proteomics analyses, which also identified few changes upon AMBRA1 loss—however, the three D-type cyclins (cyclin D1, cyclin D2 and cyclin D3) were in the top 11 of 25 upregulated proteins (Fig. 1g, Supplementary Tables 6–8). Finally, AMBRA1 knockout also led to increased levels of cyclin D in mouse embryos (Extended Data Fig. 3a–d). Thus, AMBRA1 controls the protein levels of D-type cyclins in all of the contexts we examined (in normal and cancer cells, and in vitro and in vivo).
Cyclin D upregulation mimics AMBRA1 loss
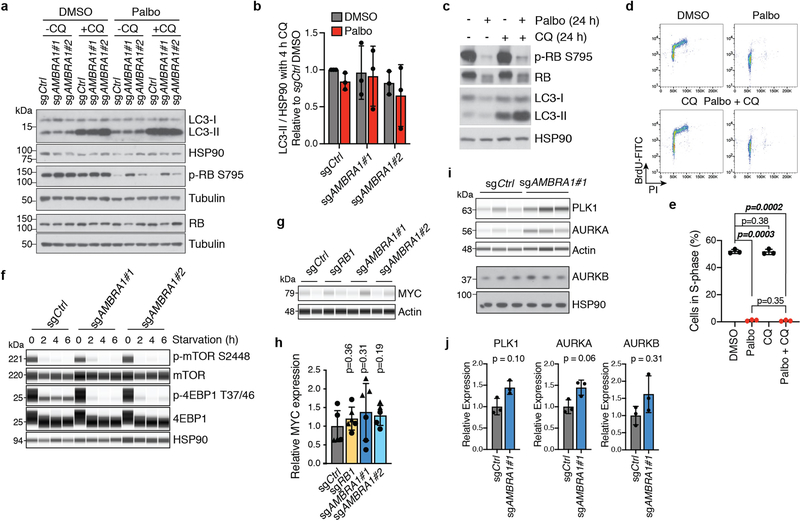
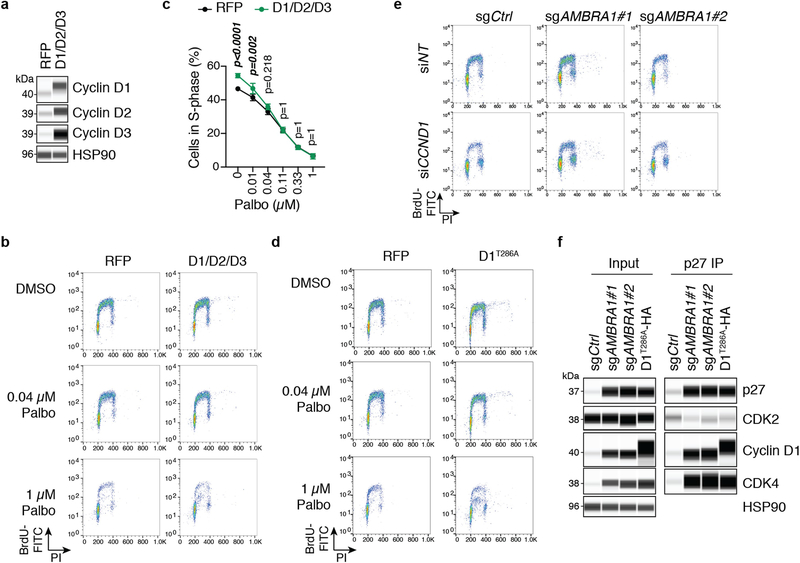
AMBRA1 can promote autophagy10 and inhibit mTOR activity11 and MYC12, all of which could affect cell cycle progression and the response to CDK4/6 inhibition. However, we did not observe reproducible changes in these pathways upon AMBRA1 loss in U937 cells, with or without palbociclib treatment (Extended Data Fig. 4a–h). Our proteomics analysis of AMBRA1-knockout U2OS cells suggested upregulation of PLK1 and Aurora kinases (Fig. 1g), which has previously been associated with palbociclib resistance8,13, but these observations were not reproducible in independent experiments (Extended Data Fig. 4i, j). Thus, these pathways probably do not account for the decreased response to CDK4/6 inhibition of AMBRA1-mutant cells. By contrast, overexpression of the three D-type cyclins or of a phosphomutant form of cyclin D1 (cyclin D1(T286A)), which is stable and highly expressed14,15, was sufficient to promote S-phase entry and decreased sensitivity to low doses of palbociclib (Fig. 1h, i, Extended Data Fig. 5a–d). Differences in palbociclib response between overexpression of cyclin D and loss of AMBRA1 are possibly due to limitations of the ectopic expression system for cyclin D. AMBRA1-knockout cells remained highly dependent on cyclin D1 for proliferation, similar to control cells (Fig. 1j, Extended Data Fig. 5e).
These observations raised the question of how upregulation of cyclin D mediates an increased tolerance of CDK4/6 inhibitors. Compared to control cells, immunoprecipitation of cyclin D1 pulled down more CDK4 and CDK2 from AMBRA1-knockout cells or cells expressing cyclin D1(T286A), and reciprocal CDK2 immunoprecipitation confirmed the increased binding of cyclin D1 to CDK2 in both of these cell models (Fig. 1k, l). Cyclin D–CDK2 complexes can phosphorylate RB16–18, and increased activity of CDK2 promotes resistance to CDK4/6 inhibitors8,19,20. In addition, the binding of the CDK2 inhibitor p27 to CDK2 was decreased in AMBRA1-knockout cells and cells expressing cyclin D1(T286A), and at the same time p27 was more abundantly bound to cyclin D1 and CDK4 (Fig. 2k, l, Extended Data Fig. 5f). p27–cyclin D–CDK4 trimers are active and resistant to palbociclib in some contexts21,22. Thus, increased levels of cyclin D lead to changes associated with increased CDK4/6 and CDK2 activity, which suggests that upregulation of cyclin D is a key mechanism by which the loss of AMBRA1 influences cell cycle progression and the response to CDK4/6 inhibitors.
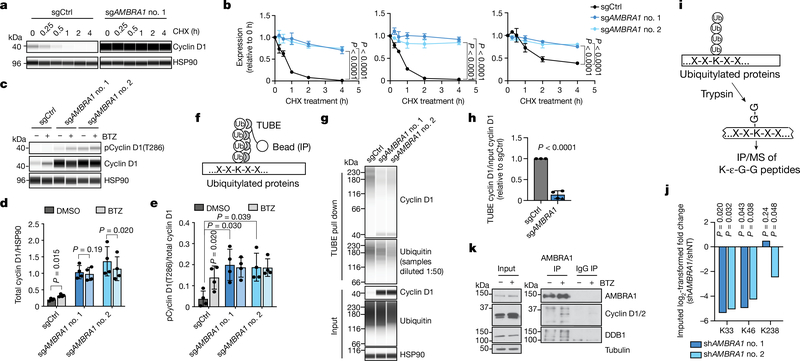
Fig. 2 |. AMBRA1 regulates the stability of cyclin D.
a, Immunoassay of cyclin D1 in control and AMBRA1-knockout U2OS cells treated with 10 μg ml−1 translation inhibitor cycloheximide (CHX) for 0 to 4 h. b, Quantification of cyclin D1 (left), cyclin D2 (middle) and cyclin D3 (right) levels as in a (n = 3 biological replicates). c, Immunoassay of cyclin D1 phosphorylated at T286 and total cyclin D1 in U2OS cells treated with 1 μM proteasome inhibitor bortezomib (BTZ) for 4 h. d, e, Quantification of cyclin D1 (d) and cyclin D1 phosphorylation at T286 (e) in cells from c (n = 4 biological replicates). f, Schematic of the tandem ubiquitin binding entities (TUBE) assay to immunoprecipitate ubiquitylated proteins. g, Immunoassay of ubiquitylated cyclin D1 isolated from U2OS cells using TUBEs. h, Quantification of cyclin D1 ubiquitylation relative to total cyclin D1 from g (n = 3 biological replicates). Data from both AMBRA1 sgRNAs are pooled. Only data from samples with similar levels of ubiquitin pull down are shown. See Supplementary Table 9 for all data. i, Schematic of mass spectrometry (MS) analysis to detect ubiquitylated proteins after immunoprecipitation with anti-K-ε-G-G antibodies. j, Quantification of cyclin D1 ubiquitylation at the three lysines detected by immunoprecipitation and mass spectrometry of K-ε-G-G peptides. shAMBRAl no. 1 and no. 2 denote two different short hairpin RNAs (shRNA) against AMBRA1; shNT, non-targeting shRNA. k, Co-immunoprecipitation of endogenous AMBRA1 and cyclin D in U2OS cells pretreated with 1 μM bortezomib for 4 h, analysed by immunoblot. DDB1 is a positive control for AMBRA1 binding. The cyclin D antibody recognizes cyclin D1 and D2. Representative of two independent experiments. HSP90 and tubulin are loading controls. All data are mean ± s.d. P values calculated by two-way ANOVA (b), two-sided t-test (paired t-test for d, e; unpaired t-test for h), and two-sided unpaired t-test with Benjamini–Hochberg correction (j).
AMBRA1 regulates the ubiquitylation of cyclin D
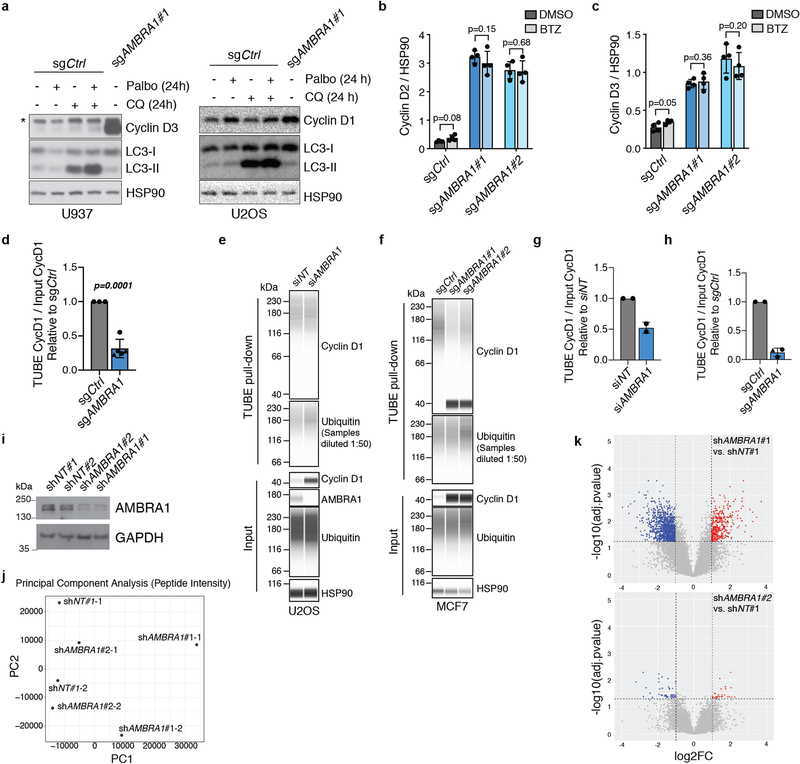
Cyclin D typically has a short half-life, which is thought to allow for precise control of CDK4/6 activity during G1 progression and to limit levels of cyclin D in S phase, in which it is detrimental to DNA replication23. We blocked translation using cycloheximide, which revealed a marked increase in the half-life of all three D-type cyclins in AMBRA1-knockout cells (Fig. 2a, b). Acute proteasome inhibition with bortezomib—but not inhibition of autophagy—was sufficient to increase the levels of cyclin D in wild-type cells, whereas proteasome inhibition did not further increase the levels of cyclin D in AMBRA1-knockout cells (Fig. 2c, d, Extended Data Fig. 6a–c). Cyclin D1 phosphorylation at T286, which precedes cyclin D1 ubiquitylation and degradation14,15, was increased in AMBRA1-knockout cells to levels similar to those in wild-type cells treated with bortezomib (Fig. 2c, e). AMBRA1-knockout cells or cells in which AMBRA1 was knocked down showed lower levels of cyclin D1 polyubiquitylation compared to control cells (Fig. 2f–h, Extended Data Fig. 6d–h, Supplementary Table 9). Mass spectometry analysis of immunoprecipitated ubiquitylated proteins showed reduced cyclin D1 ubiquitylation at several lysine residues upon knockdown of AMBRA1 (Fig. 2i, j, Extended Data Fig. 6i–k, Supplementary Table 10). Thus, AMBRA1 promotes ubiquitylation and proteasomal degradation of cyclin D.
CRL4AMBRA1 directly ubiquitylates cyclin D
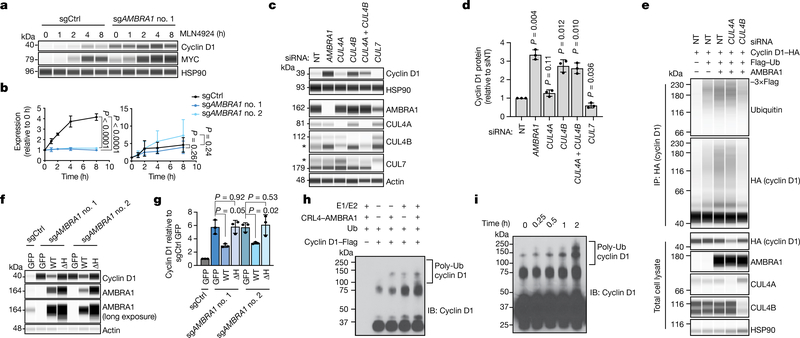
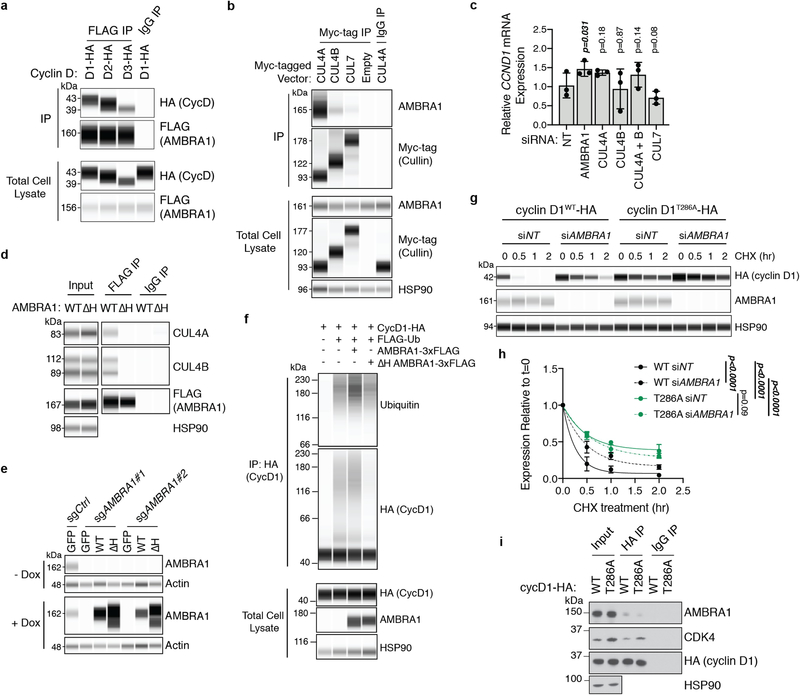
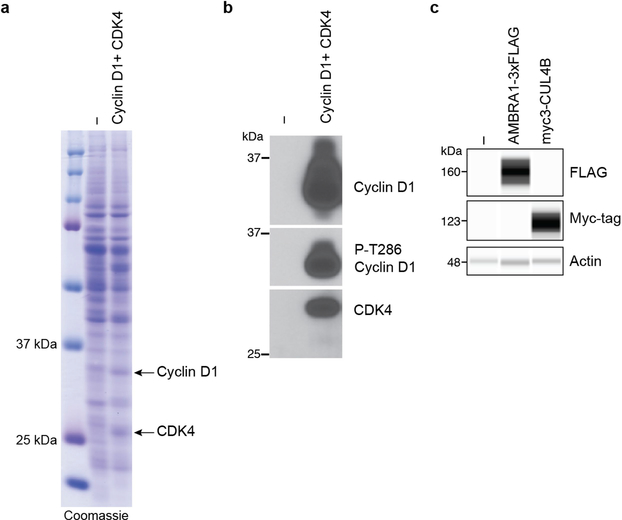
Our immunoprecipitation of cyclin D with AMBRA1 upon proteasome inhibition (to stabilize cyclin D) suggested that AMBRA1 may directly regulate cyclin D ubiquitylation (Fig. 2k, Extended Data Fig. 7a). AMBRA1 belongs to the DDB1 and CUL4-associated factor family of proteins, which specifies substrates for CUL4–RING E3 ubiquitin ligase (CRL4) complexes24,25. Inhibition of all cullin-RING ligase complexes with the neddylation inhibitor MLN4924 increased levels of cyclin D1 in control cells but not in AMBRA1-knockout cells, whereas MYC (another target of cullin-RING ligases) accumulated regardless of AMBRA1 status (Fig. 3a, b). We found a predominant association of AMBRA1 with CUL4A and CUL4B, consistent with previous studies11,24, but only CUL4B knockdown led to increased levels of cyclin D1 and blocked cyclin D1 polyubiquitylation upon AMBRA1 overexpression (Fig. 3c–e, Extended Data Fig. 7b, c). A mutant AMBRA1 that cannot bind CRL4 (AMBRA1(ΔH))24 could not rescue increased levels of cyclin D1 in AMBRA1-knockout cells nor increase cyclin D1 polyubiquitylation (Fig. 3f, g, Extended Data Fig. 7d–f). AMBRA1 knockdown did not further increase the half-life of cyclin D1(T286A), and this cyclin D1 phosphomutant showed decreased binding to AMBRA1 (Extended Data Fig. 7g–i). Finally, in in vitro ubiquitylation assays, high-molecular-weight polyubiquitylated cyclin D1 species accumulated in a time-dependent manner and required the presence of both CRL4AMBRA1 and recombinant E1 and E2 proteins (Fig. 3h, i, Extended Data Fig. 8a–c). Altogether, these data show that CRL4AMBRA1 ubiquitylates Cyclin D.
Fig. 3 |. CRL4AMBRA1 ubiquitylates cyclin D.
a, Immunoassay of cyclin D1 and MYC in U2OS cells treated with 1 μM neddylation inhibitor MLN4924 for 0 to 8 h. b, Quantification of a (n = 3 biological replicates). Left, cyclin D1; right, MYC. c, Immunoassay of cyclin D1 in U2OS cells following knockdown of AMBRA1 or various cullin proteins. Asterisk, nonspecific band. The CUL4B antibody appears to cross-react with CUL4A. d, Quantification of cyclin D1 in c (n = 3 biological replicates). e, Immunoassay of cyclin D1 ubiquitylation in 293T cells following overexpression of AMBRA1 and knockdown of CUL4A or CUL4B. Cells were pretreated with 1 μM bortezomib for 3 h. Representative of two independent experiments. f, Immunoassay of cyclin D1 and AMBRA1 in U2OS cells with doxycycline-inducible wild-type AMBRA1 (WT), AMBRA1(ΔH) (ΔH) or GFP control, treated with 500 ng ml−1 doxycycline for 2 d. g, Quantification of cyclin D1 in f (n = 3 biological replicates). h, Immunoblot of cyclin D1 polyubiquitylation (poly-Ub) from in vitro ubiquitylation assays performed on purified cyclin D1. AMBRA1 and CUL4B (CRL4–AMBRA1) were independently purified from 293T cells, and E1, E2 and ubiquitin (Ub) are recombinant proteins (n = 1 experiment). i, Immunoblot of cyclin D1 polyubiquitylation from in vitro ubiquitylation time-course assays, similar to h. Representative of two independent experiments. HSP90 and actin are loading controls. All data are mean ± s.d. P values calculated by two-way ANOVA (b) or two-sided paired t-test (d, g).
AMBRA1 loss promotes lung adenocarcinoma
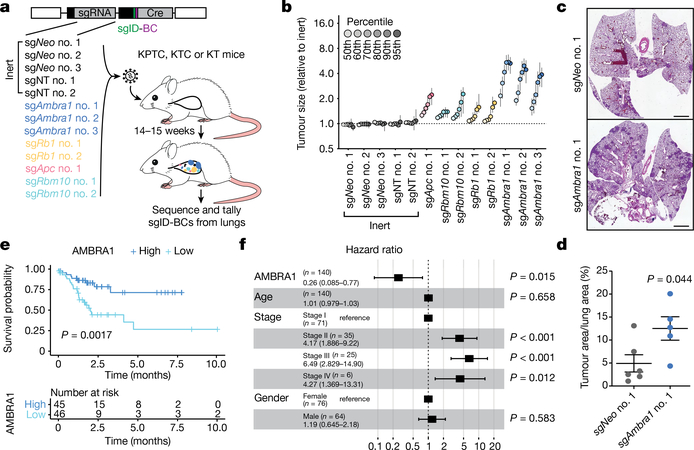
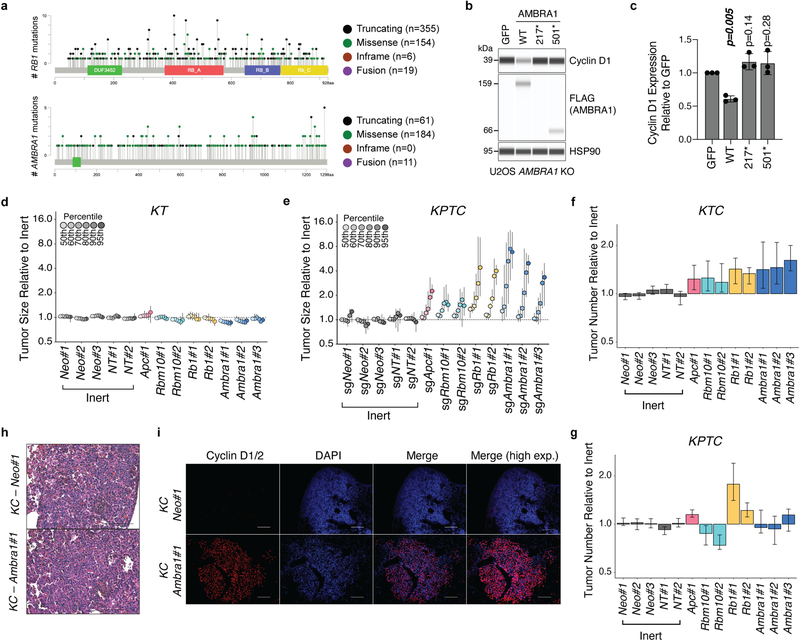
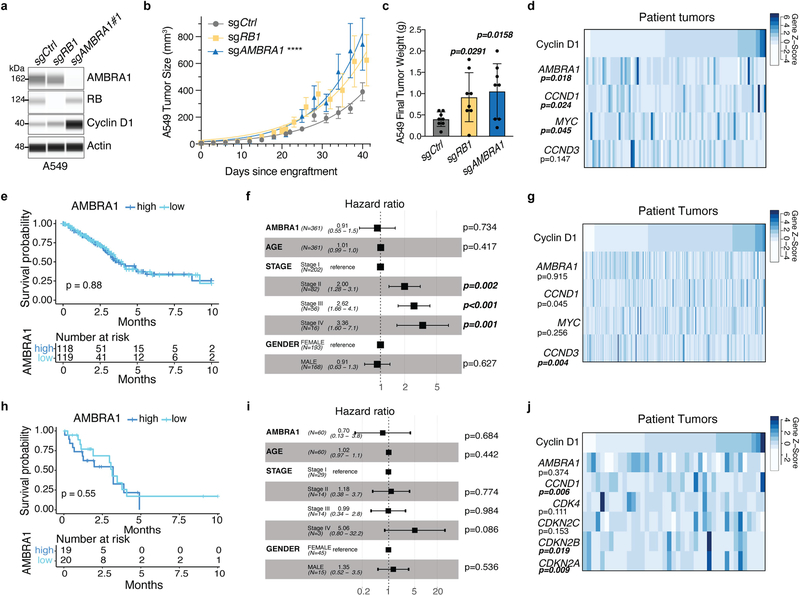
Mutations in AMBRA1 are found in 2% of the ‘Pan-Cancer Atlas’ studies of The Cancer Genome Atlas (TCGA), and two cancer-derived mutations in AMBRA1 impaired its ability to control the levels of cyclin D (Extended Data Fig. 9a–c), which suggests that AMBRA1 may act as a context-dependent tumour suppressor. We tested this idea in a mouse model of lung adenocarcinoma driven by oncogenic KRAS using Tuba-seq, a highly quantitative tumour barcoding system26. We intratracheally infected KrasLSL-G12D/+;Rosa26LSL-tdTomato;H11LSL-Cas9 (hereafter, KTC) and KrasLSL-G12D/+;Trp53fl/fl;Rosa26LSL-tdTomato;H11LSL-Cas9 (hereafter, KPTC) mice with lenti-single guide (sg)RNA–Cre pools that consisted of sgRNAs against Ambra1 and three other tumour suppressors (Rb1, Apc and Rbm10) as well as five inert sgRNAs. KrasLSL-G12D/+;Rosa26LSL-tdTomato (hereafter, KT) mice (without Cas9) were used to account for differences in sgRNA representation in the viral pool (Fig. 4a). Sequencing and tallying the integrated barcodes from tumour-bearing lungs revealed that loss of Ambra1 had the greatest effect on tumour size among all tumour suppressor genes tested in KTC and KPTC mice (Fig. 4b, Extended Data Fig. 9d–g). Loss of Ambra1 resulted in an increase in tumour burden—accompanied by increased levels of cyclin D—in independent KrasLSL-G12D/+;H11LSL-Cas9 (hereafter, KC) mice (Fig. 4c, d, Extended Data Fig. 9h,i). Similarly, AMBRA1 knockout led to increased levels of cyclin D1 and greater tumour growth in a human xenograft model of lung adenocarcinoma (Extended Data Fig. 10a–c). In the lung adenocarcinoma dataset from TCGA, lower expression of AMBRA1 mRNA was associated with worse overall survival in a Kaplan–Meier analysis of patients with KRASG12-mutant tumors (log-rank test, P=0.0017) (Fig. 4e). This association was also significant in a multivariate Cox proportional hazard model that adjusted for key clinical covariates (log hazard ratio of −0.5, 95% confidence interval of −0.92 to −0.09, P = 0.015) (Fig. 4f). Additionally, a stepwise linear regression model that included RB pathway genes (Supplementary Methods) identified a significant inverse correlation between AMBRA1 expression and protein levels of cyclin D1 (Extended Data Fig. 10d). These associations were not observed in samples that contained wild-type KRAS or mutant EGFR (Extended Data Fig. 10e–j). Thus, AMBRA1 acts as a tumour suppressor in lung adenocarcinoma driven by mutant KRAS.
Fig. 4 |. AMBRA1 is a tumour suppressor in KRAS-mutant lung adenocarcinoma.
a, Schematic of multiplexed CRISPR–Cas9 gene editing and Tuba-seq in KPTC mice, KTC mice (wild type for p53) and KT mice (wild type for p53 and lacking Cas9). sgID-BC, dual barcode to identify each individual tumour and its associated sgRNA. Neo denotes the neomycin resistance gene. b, Relative tumour sizes for each sgRNA in KTC mice (n = 9 mice). Tumour sizes were calculated from merged data from all tumours in all mice and normalized to inert sgRNAs 15 weeks after cancer initiation. Error bars denote 95% confidence intervals determined by bootstrap sampling. c, Representative haematoxylin and eosin (H&E) staining of lung sections from control and Ambra1-mutant KC mice 15 weeks after cancer initiation. Scale bars, 1 mm. d, Quantification of tumours in c. n = 6 (sgNeo no. 1) or 5 (sgAmbra1 no. 1) mice. Data are mean ± s.e.m. e, Kaplan–Meier plot of AMBRA1 expression (high, upper third; low, bottom third) in TCGA KRAS G12-mutant lung adenocarcinoma (n = 136 patients). f, Forest plot of Cox proportional hazard model of TCGA KRAS G12-mutant lung adenocarcinoma (n = 131 patients). Model is adjusted by stage, age and gender. Hazard ratios are given with 95% confidence interval in parentheses. P values calculated by two-sided unpaired t-test (d), log-rank test (e) and Wald test (f).
Discussion
Our work, and accompanying studies27,28, conclusively identifies CRL4AMBRA1 as a major regulator of the stability of cyclin D in every context we examined and places AMBRA1 as a member of the RB pathway (Extended Data Fig. 11). Additional mechanisms may further control the stability of D-type cyclins in more specific contexts4,29. Given the various cellular functions of AMBRA1, it may serve as a central node to coordinate the cell cycle, cell growth and cell death in response to a variety of inputs. However, our data in lung adenocarcinoma suggest that the oncogenic effects of the loss of AMBRA1 may depend on the genetic context, similar to other members of the RB pathway30. Our work highlights the complexities of the factors that regulate how cancer cells respond to CDK4/6 inhibitors. Increased levels of cyclin D may promote resistance to CDK4/6 inhibitors by directly and indirectly increasing the activity of both CDK4/6 and CDK2 in cells, but upregulation of cyclin D has also previously been linked to increased sensitivity to CDK4/6 inhibition19,20,31–35. These observations underscore the need to further explore the mechanisms that regulate the levels and activity of complexes containing CDK4/6 or CDK2 in human tumours to optimize the use of CDK4/6 or CDK2 inhibitors in a broad range of patients with cancer.
Online content
Any methods, additional references, Nature Research reporting summaries, source data, extended data, supplementary information, acknowledgements, peer review information; details of author contributions and competing interests; and statements of data and code availability are available at https://doi.org/10.1038/s41586-021-03474-7.
Extended Data
Extended Data Fig. 1 |. Identification of AMBRA1 and other factors involved in the response of cells to CDK4/6 inhibitors.
a, Proliferation of U937 cells in the presence of 0.5 μM palbociclib (palbo) over 6 d, determined by cell counting (n = 1 experiment). b, Immunoassay of total RB and RB phosphorylated at S807 and S811 (p-RB S807/811) in U937 cells over 36 h of palbociclib treatment. c, Quantification of phosphorylated RB relative to total RB from b (n = 1 experiment). d, Schematic of the CRISPR-Cas9 screen in U937 cells. e, Protein–protein interaction map of screen results, generated using Metascape. Coloured nodes represent densely connected gene neighbourhoods. Legend indicates the gene ontology term that is most significantly enriched within each neighbourhood. Node size indicates the degree of connectedness. Gene names can be found in Supplementary Table 3. f, Schematic of the screen results among RB-pathway genes expressed in U937 cells. g, Number of control and knockout U937 cells treated with 0.5 μM palbociclib or DMSO control for 48 h. Each symbol is an isogenic clone (n = 3 biological replicates per clone). h, Left, schematic of the competition assay between GFP-negative parental U937 cells and GFP-positive knockout cell populations. Right, example of flow cytometry analysis for one experiment with AMBRA1-knockout cells. i, Percentage of GFP-positive control or knockout populations in competition assays as in h (n = 3 biological replicates). j, Representative flow cytometry plots of annexin V and propidium iodide (PI) staining in U937 cells treated with 0.5 μM palbociclib for 24 h. k, Percentage of apoptotic (annexinV+PI+) U937 cells after a 24-h palbociclib treatment (n = 3 biological replicates per clone). Palbociclib does not induce apoptosis in any genotype. l, Representative flow cytometry plots of BrdU and PI staining in U937 cells treated with 0.5 μM palbociclib for 24 h. m, Percentage of S-phase cells by BrdU and PI staining in U937 cells treated with 1 μM abemaciclib for 24 h (n = 3 biological replicates per clone). n, Immunoassay for AMBRA1 and RB in control and knockout cancer cell lines generated by CRISPR–Cas9. For U2OS (osteosarcoma), NCI-H1792 (lung adenocarcinoma) and NCI-H460 (large cell lung cancer), each lane is an isogenic clone. MCF7 cells (breast cancer) are populations. o, Percentage of cycling S-phase cells from n after a 24-h treatment with palbociclib (0.5 μM for all cell lines except for MCF7 cells, 0.04 μM). U2OS, NCI-H1792 and NCI-H460 cells were analysed by BrdU and PI staining, and each symbol is an isogenic clone (n = 3 biological replicates per clone). MCF7 cells were analysed by PI staining (n = 3 biological replicates). p, Quantification of RB phosphorylated at S795 (p-RB S795) over total RB in U937 cells treated with increasing doses of palbociclib for 24 h, measured by immunoassay (n = 4 biological replicates). q, Fold-change in mRNA levels of E2F target genes in U937 cells treated with 0.5 μM palbociclib for 24 h, measured by quantitative PCR with reverse transcription (RT–qPCR) (n = 3 biological replicates). All data are mean ± s.d. P values calculated by two-sided unpaired t-test (g, k, m, o) and two-sided paired t-test (i, p, q). Tubulin, HSP90 and actin are loading controls.
Extended Data Fig. 2 |. AMBRA1 loss regulates cyclin D post-transcriptionally and dependency on AMBRA1 correlates with cyclin D signalling networks.
a, b, RT–qPCR analysis of the genes encoding D-type cyclins (CCND genes) and CDK4 in U937 cells (a) (n = 3 biological replicates per clone) or expressed D-type cyclins in other cancer cell lines (b). For U2OS, NCI-H1792 and NCI-H460 cells, each symbol is an isogenic clone (n = 2 biological replicates per clone). MCF7 cells are populations (n = 3 biological replicates). P values evaluate differences between knockout cells and controls for each gene. c, Immunoassay of D-type cyclins in cancer cell lines in b. d, Immunoassay of AMBRA1, cyclin D1 and CDK4 in U2OS cells after 48 h of AMBRA1 knockdown by siRNA pools. e, Quantification of cyclin D1 and CDK4 protein levels in d (n = 3 biological replicates). f, Correlation of gene dependency scores between AMBRA1, RB pathway genes and additional cancer drivers, according to DepMap. Red lines mark the top and bottom 5% of genes. g, The 20 most significantly enriched gene ontology terms among the top 100 genes, the loss of which best correlate with loss of AMBRA1 in DepMap. h, Principal component (PC) analysis of RNA-sequencing data from U2OS cells, three biological replicates per cell line. i, Volcano plot of RNA-sequencing results comparing control and AMBRA1-knockout U2OS cells. Significantly differentially expressed genes (P < 0.01) are in red. All data shown as mean ± s.d. P values calculated by two-sided unpaired t-test (a, b), two-sided paired t-test (e), hypergeometric test (g) and Wald test (i).
Extended Data Fig. 3 |. AMBRA1 deletion in mouse embryos results in increased cyclin D levels.
a, sgRNA design to knockout Ambra1 in mouse zygotes by microinjection of sgRNAs and Cas9. Controls were injected with a non-targeting sgRNA. b, Representative bright-field images of control (n = 5) and mutant (n = 3) embryos at embryonic day (E)13.5. Similar to previous reports10, the Ambra1-mutant embryos generated here have neural tube defects with midbrain and hindbrain exencephaly and/or spina bifida (arrows). Scale bar, 2 mm. c, Representative cyclin D immunofluorescence (red signal, the antibody recognizes cyclin D1 and cyclin D2) in control and Ambral-mutant E13.5 embryos (from n = 3 embryos per sgRNA). DAPI shows DNA. The liver is autofluorescent. Scale bar, 1 mm. d, High-magnification view of the developing brain from one control and one Ambra1-mutant embryo (asterisks in c). v, ventricle, cp, choroid plexus. Scale bar, 500 μm. Representative of three embryos per sgRNA.
Extended Data Fig. 4 |. Pathways previously associated with AMBRA1 do not explain tolerance to CDK4/6 inhibitors.
a, Immunoblot analysis of autophagy flux by LC3 conversion (LC3-I to LC3-II, which occurs during autophagosome formation) and RB phosphorylation (p-RB S795) in U937 cells treated with 0.5 μM palbociclib for 24 h and acutely treated with 25 μM chloroquine (CQ) (an autophagy inhibitor) for the final 4 h. b, Quantification of LC3-II levels with 4 h of chloroquine treatment, indicating autophagy flux, from cells in a (n = 3 biological replicates). No significant differences were identified by two-way ANOVA (Pcell line = 0.44, Ptreatment = 0.38, Pinteraction = 0.92). c, Immunoblot of total and phosphorylated RB and LC3 conversion in wild-type U937 cells treated with 0.5 μM palbociclib, 25 μM chloroquine or both for 24 h. Representative of three independent experiments. d, Representative flow cytometry plots of BrdU and PI staining in cells from c. e, Quantification of S-phase cells from d (n = 3 biological replicates). Autophagy inhibition does not alter palbociclib response. f, Immunoassay of the mTORC1 target phosphorylation sites (S2448 of mTOR, and T37 and T46 of 4EBP1) in U937 cells following amino acid starvation. Representative of two independent experiments. g, Immunoassay of MYC in U937 clones. h, Quantification of MYC from g. Each symbol is an isogenic clone (n = 3 biological replicates per clone). i, Immunoassay of PLK1 and AURKA and immunoblot of AURKB in control and AMBRA1-knockout U2OS cells. Each lane is a biological replicate. j, Quantification of i (n = 3 biological replicates). All data are mean ± s.d. P values calculated by two-way ANOVA (b), two-sided paired t-test (e, j), and two-sided unpaired t-test (h). HSP90, tubulin and actin are loading controls.
Extended Data Fig. 5 |. Cyclin D mediates the phenotypes of AMBRA1- mutant cells.
a, Immunoassay of cyclin D1, D2, and D3 in wild-type U2OS cells overexpressing all three D-type cyclins from the same lentiviral vector or RFP as a control. b, Representative flow cytometry plots of BrdU and PI staining in cells from a treated with increasing doses of palbociclib for 24 h. c, Percentage of cycling S-phase cells from b (n = 3 biological replicates). Data are mean ± s.d. P values calculated by two-way ANOVA (Pcell line < 0.0001) with post hoc Sidak test. d, Representative flow cytometry plots of BrdU and PI staining in U2OS cells overexpressing stabilized cyclin D1(T286A)–HA or RFP control, treated with increasing doses of palbociclib for 24 h. e, Representative flow cytometry plots of BrdU and PI staining in control and AMBRA1-knockout U2OS clones after 48 h of cyclin D1 (CCND1) knockdown with siRNA pools. f, Co-immunoprecipitation of p27 in control, knockout and cyclin-D1(T286A)-overexpressing U2OS cells, and immunoassay of relevant protein complexes (n = 2 biological replicates). HSP90 is a loading control.
Extended Data Fig. 6 |. AMBRA1 regulates the ubiquitylation of D-type cyclins.
a, Immunoblot analysis of cyclin D3 in wild-type U937 cells (left) or cyclin D1 in wild-type U2OS cells (right) treated with 0.5 μM palbociclib, 25 μM chloroquine or both for 24 h. LC3 and HSP90 blots for U937 cells are the same as in Extended Data Fig. 4c, as the experiments were performed simultaneously. Untreated AMBRA1-knockout cells serve as a control for increased cyclin D expression. Asterisk, unspecific band. n = 3 (U937) or n = 1 (U2OS) biological replicates. b, c, Immunoassay quantification of cyclin D2 (b) and cyclin D3 (c) in U2OS cells treated with 1 μM bortezomib for 4 h (n = 4 biological replicates). d, Quantification of ubiquitylated cyclin D1 relative to total cyclin D1 isolated from U2OS clones pretreated with 1 μM bortezomib for 4 h using TUBEs. Each symbol is an isogenic clone (n = 3 (sgCtrl) or n = 5 (sgAMBRA1)). e, f, Immunoassay of ubiquitylated cyclin D1 isolated using TUBEs following AMBRA1 knockdown in U2OS cells (e) or in populations of control and AMBRA1-knockout MCF7 cells (f). g, h, Quantification of ubiquitylated cyclin D1 relative to total cyclin D1 in AMBRA1-knockdown U2OS cells (g) (n = 2 biological replicates) or AMBRA1-knockout MCF7 cells (h) (n = 2 (sgCtrl) or n = 3 (sgAMBRA1) biological replicates) as shown in e, f, respectively. For all TUBE experiments, only quantification of samples with similar levels of ubiquitin pull down are shown. See Supplementary Table 9 for all data. i, Immunoblot analysis of AMBRA1 in 293T cells expressing control or AMBRA1-targeting shRNAs, pretreated with 10 μM MG132 for 4 h. (n = 1 experiment). j, Principal component analysis of mass spectrometry data from cells in i (two replicates each of shNT no. 1 and shAMBRA1 no. 1 and no. 2) after enriching for ubiquitylated peptides. k, Volcano plot of mass-spectrometry data comparing ubiquitylated peptides in control and AMBRA1 knockdown 293T cells. Each dot is a peptide. Red symbols, significantly upregulated peptides; blue symbols, significantly downregulated peptides, with the indicated cut-offs. All other data are mean ± s.d. P values calculated by two-sided paired t-test (b, c), two-sided unpaired t-test (d) and two-sided unpaired t-test followed by Benjamini–Hochberg correction (k). HSP90 and GAPDH are loading controls.
Extended Data Fig. 7 |. AMBRA1 binding to CUL4 is required for regulating cyclin D.
a, Co-immunoprecipitation of transfected AMBRA1–Myc–Flag and cyclin D–HA (D1, D2 or D3) in 293T cells, analysed by immunoassay. b, Co-immunoprecipitation of transfected Myc-tagged cullin proteins with endogenous AMBRA1 in U2OS cells, analysed by immunoassay. c, RT–qPCR analysis of CCND1 mRNA expression in U2OS cells following knockdown of AMBRA1 or various cullin genes by siRNA pools (n = 3 biological replicates). d, Co-immunoprecipitation of transfected wild-type (WT) AMBRA1 and AMBRA1(ΔH) with endogenous CUL4A and CUL4B in 293T cells. e, Immunoassay of AMBRA1 in control and AMBRA1-knockout U2OS cells with doxycycline-inducible expression of wild-type AMBRA1, AMBRA1(ΔH) or GFP control, after treatment with 500 ng ml−1 doxycycline (+Dox) or DMSO (−Dox) for 2 d. f, Immunoassay of cyclin D1 ubiquitylation in 293T cells with overexpression of wild-type AMBRA1 or AMBRA1(ΔH). Cells were pretreated with 1 μM bortezomib for 3 h and lysed in denaturing conditions before immunoprecipitation of cyclin D1. Representative of two independent experiments. g, Immunoassay of cyclin D1–HA in U2OS cells expressing wild-type cyclin D1 or phosphomutant cyclin D1 (cyclin D1(T286A)) treated with 10 μg ml−1 cycloheximide for up to 2 h. Cells were transfected with control or AMBRA1-targeted siRNA pools 3 d previously. h, Quantification of cyclin D1–HA protein levels in U2OS cells from g with best-fit curves for one-phase decay (n = 3 biological replicates). i, Co-immunoprecipitation of cyclin D1–HA (wild-type or T286A) and endogenous AMBRA1 in U2OS cells. CDK4 serves as a positive control for cyclin D1 binding. Representative of two independent experiments. All data are mean ± s.d. P values calculated by two-sided paired t-test (c) and two-way ANOVA (h). HSP90 and actin are loading controls.
Extended Data Fig. 8 |. AMBRA1 ubiquitylates cyclin D.
a, Coomassie-blue-stained gel with protein extracts from insect Sf9 cells (−) or Sf9 cells expressing cyclin D1 and CDK4 (arrows). b, Immunoblot for cyclin D1, cyclin D1 phosphorylated on T286 (P-T286) and CDK4 in protein extracts, similar to a. c, Immunoassay of Flag and Myc tag in untransfected 293T cells (−) or 293T cells transfected with AMBRA1–3×Flag or Myc3–CUL4B. Actin is a loading control. n = 1 experiment.
Extended Data Fig. 9 |. AMBRA1 is a tumour suppressor in KRAS-mutant mouse lung adenocarcinoma.
a, Lollipop plot for RB1 and AMBRA1 mutations in 10,953 patients (10,967 samples) in 32 studies from TCGA (data downloaded from https://cbioportal.org in September 2020). b, Immunoassay of AMBRA1 and cyclin D1 in AMBRA1-knockout U2OS cells upon stable expression of GFP, wild-type AMBRA1 (WT) or two mutant forms of AMBRA1 from a (stop codons at the position indicated by an asterisk). HSP90 is a loading control. Expression of 217* was not detected, suggesting an unstable protein. c, Quantification of cyclin D1 in b (n = 3 biological replicates). Data are mean ± s.d. P values calculated by two-sided paired t-test. d, e, Relative tumour sizes for each sgRNA in KT mice (lacking Cas9) (d) (n = 4 mice) and KPTC mice (e) (n = 5 mice). Tumour sizes were calculated from merged data from all tumours in all mice and normalized to inert sgRNAs 15 (d) or 14 (e) weeks after cancer initiation. f, g, Tumour number for each sgRNA in KTC mice (f) (n = 9 mice) and KPTC mice (g) (n = 5 mice). Data from all tumours in all mice were merged and normalized to the average tumour number across inert sgRNAs. For d–g, error bars denote 95% confidence intervals determined by bootstrap sampling. h, Representative H&E staining of tumours from KC mice infected with lentiviral vectors encoding Cre recombinase and either a control or Ambr1-targeted sgRNA. Scale bar, 100 μm. n = 6 (Neo no. 1) or n = 5 (Ambra1 no. 1) mice). i, Representative immunofluorescence for cyclin D in control and Ambra1-knockout KC tumours. The cyclin D antibody used recognizes cyclin D1 and D2. Scale bars, 100 μm. From n = 2 mice per sgRNA).
Extended Data Fig. 10 |. AMBRA1 is a tumour suppressor in KRAS-mutant human lung adenocarcinoma.
a, Immunoassay of AMBRA1, RB and cyclin D1 in control and knockout human A549 lung adenocarcinoma cells. Actin is a loading control. b, Growth of control and mutant A549 xenografts in NOD-SCID-gamma (NSG) mice (n = 8 tumours per sgRNA). ****Pinteraction < 0.0001 by two-way ANOVA comparing the AMBRA1-knockout curve with control. Tumour volume measurements for RB1-knockout tumours were staggered 1 d behind control and AMBRA1-knockout tumours, which precludes two-way ANOVA. Data are mean ± s.e.m., with best-fit curves for exponential growth. c, Final tumour weights from b. Each symbol is one tumour (n = 8 per sgRNA). Data are mean ± s.d. d, g, j, Cyclin D1 protein levels as measured by reverse phase protein array in relation to the mRNA expression as measured by RNA sequencing (upper quartile of fragments per kilobase of transcript per million mapped reads (FPKM-UQ)) of RB pathway genes that best predict cyclin D1 protein in TCGA KRAS G12-mutant lung adenocarcinoma (d) (n = 90 samples), KRAS wild-type lung adenocarcinoma (g) (n = 257 samples) and EGFR-mutant lung adenocarcinoma (j) (n = 41 samples), using a step-wise regression model. For g, j, AMBRA1 was not selected in the final model but is shown for comparison. Each column is an individual sample, and samples are sorted by cyclin D1 protein levels. e, h, Kaplan–Meier plot of AMBRA1 expression (high, upper third; low, bottom third) in TCGA KRAS wild-type lung adenocarcinoma (e) (n = 361 patients) and EGFR-mutant lung adenocarcinoma (h) (n = 60 patients). f, i, Forest plot of Cox proportional hazard model of TCGA KRAS wild-type lung adenocarcinoma (f) (n = 340 patients) and EGFR-mutant lung adenocarcinoma (i) (n = 60 patients). Model is adjusted by stage, age and gender. P values calculated by two-way ANOVA (b), two-sided unpaired t-test (c), F-test (d, g, j), log-rank test (e, h) and Wald test (f, i).
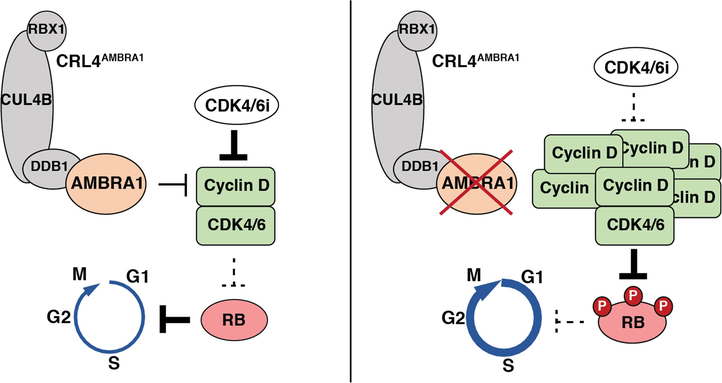
Extended Data Fig. 11 |. AMBRA1 regulates cyclin D protein stability and signalling through the RB pathway.
AMBRA1 limits CDK4/6 activity by mediating ubiquitylation and degradation of D-type cyclins as part of the CRL4 E3 ligase complex. Loss of AMBRA1 leads to accumulation of cyclin D protein and decreased sensitivity to CDK4/6 inhibitors, owing to sustained RB phosphorylation and therefore persistent cell cycle progression.
Supplementary Material
Acknowledgements
We thank S. Rubin and J. Skotheim for critical reading of the manuscript; A. Koff, V. Dulic and K. Keyomarsi for helpful discussions; and all of the members of the laboratory of J.S., and especially G. Coles, for their help and support throughout this study. Research reported in this Article was supported by the NIH (J.S., R01CA228413 and 1R35CA231997; A.C.C., 1F99CA245471-01; E.E.J., 2T32CA009302; R.C., 5T32GM007276; M.M.W. and D.A.P., R01CA2344349; and N.J.K., P50AI150476 and U54CA209891), the California TRDRP (J.S., 28IR-0046) and the NSF (GRFP, to A.C.C.). E.E.J. and M.C.L. were supported by a Stanford Graduate Fellowship. S.L. was supported by a Boehringer Ingelheim Fonds MD Fellowship. C.L. is the Connie and Bob Lurie Fellow of the Damon Runyon Cancer Research Foundation (DRG-2331). J.S. is the Harriet and Mary Zelencik Scientist in Children’s Cancer and Blood Diseases and the Elaine and John Chambers Professor in Pediatric Cancer.
Competing interests J.S. has received research funding from Stemcentrx/Abbvie, Pfizer and Revolution Medicines. M.M.W. and D.P. have equity in, and are advisors for, D2GOncology. C.C. is a scientific advisor to GRAIL and reports stock options as well as consulting for GRAIL and Genentech. N.J.K. has received research support from Vir Biotechnology and F. Hoffmann-La Roche. The authors declare no other competing interests.
Footnotes
Additional information
Supplementary information The online version contains supplementary material available at https://doi.org/10.1038/s41586-021-03474-7.
Peer review information Nature thanks Marianne Bronner, Piotr Sicinski and the other, anonymous, reviewer(s) for their contribution to the peer review of this work. Peer reviewer reports are available.
Reprints and permissions information is available at http://www.nature.com/reprints.
Reporting summary
Further information on research design is available in the NatureResearch Reporting Summary linked to this paper.
Data availability
Sequencing data from Tuba-seq experiments and RNA-sequencing data from AMBRA1-knockout U2OS cells are available from the Gene Expression Omnibus under accession numbers GSE146303 and GSE159920, respectively. Mass spectrometry data from shotgun proteomics experiments and analysis of ubiquitylated proteins are available through the ProteomeXchange Consortium, with dataset identifiers PXD021789 and PXD022111, respectively. Public nonprotected RNA-sequencing, copy number alteration, exome sequencing and reverse-phase protein array lung adenocarcinoma datasets from the TCGA were downloaded from https://gdc.cancer.gov/. Clinical data were obtained from a previous publication36 (PMID: 29625055). Gene dependency data from the Cancer Dependency Map are publicly available at www.depmap.org. Protein sequences for mass spectrometry analysis were obtained from the NCBI Homo sapiens protein database (ftp://ftp.ncbi.nlm.nih.gov/ref-seq/release/release-notes/archive/RefSeq-release86.txt, downloaded 05/11/2018) (shotgun mass spectrometry) and from Uniprot (https://www.uniprot.org/uniprot/?query=proteome:UP000005640%20reviewed:yes, downloaded 02/28/2020) (ubiquitin remnant profiling). All other data are available in the Article and supplementary information, or from the corresponding author upon reasonable request. Source data are provided with this paper.
References
- 1.Deshpande A, Sicinski P & Hinds PW Cyclins and cdks in development and cancer: a perspective. Oncogene 24, 2909–2915 (2005). [DOI] [PubMed] [Google Scholar]
- 2.Sherr CJ Cancer cell cycles. Science 274, 1672–1677 (1996). [DOI] [PubMed] [Google Scholar]
- 3.Malumbres M & Barbacid M Cell cycle, CDKs and cancer: a changing paradigm. Nat. Rev. Cancer 9, 153–166 (2009). [DOI] [PubMed] [Google Scholar]
- 4.Kanie T et al. Genetic reevaluation of the role of F-box proteins in cyclin D1 degradation. Mol. Cell. Biol. 32, 590–605 (2012). [DOI] [PMC free article] [PubMed] [Google Scholar]
- 5.Qie S & Diehl JA Cyclin D degradation by E3 ligases in cancer progression and treatment. Semin. Cancer Biol. 67, 159–170 (2020). [DOI] [PMC free article] [PubMed] [Google Scholar]
- 6.Sherr CJ, Beach D & Shapiro GI Targeting CDK4 and CDK6: from discovery to therapy. Cancer Discov. 6, 353–367 (2016). [DOI] [PMC free article] [PubMed] [Google Scholar]
- 7.Walter DM et al. RB constrains lineage fidelity and multiple stages of tumour progression and metastasis. Nature 569, 423–427 (2019). [DOI] [PMC free article] [PubMed] [Google Scholar]
- 8.Wander SA et al. The Genomic landscape of intrinsic and acquired resistance to cyclin-dependent kinase 4/6 inhibitors in patients with hormone receptor-positive metastatic breast cancer. Cancer Discov. 10, 1174–1193 (2020). [DOI] [PMC free article] [PubMed] [Google Scholar]
- 9.Schoninger SF & Blain SW The ongoing search for biomarkers of CDK4/6 inhibitor responsiveness in breast cancer. Mol. Cancer Ther. 19, 3–12 (2020). [DOI] [PMC free article] [PubMed] [Google Scholar]
- 10.Fimia GM et al. Ambra1 regulates autophagy and development of the nervous system. Nature 447, 1121–1125 (2007). [DOI] [PubMed] [Google Scholar]
- 11.Antonioli M et al. AMBRA1 interplay with cullin E3 ubiquitin ligases regulates autophagy dynamics. Dev. Cell 31, 734–746 (2014). [DOI] [PubMed] [Google Scholar]
- 12.Cianfanelli V et al. AMBRA1 links autophagy to cell proliferation and tumorigenesis by promoting c-Myc dephosphorylation and degradation. Nat. Cell Biol. 17, 706 (2015). [DOI] [PubMed] [Google Scholar]
- 13.Montaudon E et al. PLK1 inhibition exhibits strong anti-tumoral activity in CCND1-driven breast cancer metastases with acquired palbociclib resistance. Nat. Commun. 11, 4053 (2020). [DOI] [PMC free article] [PubMed] [Google Scholar]
- 14.Alt JR, Cleveland JL, Hannink M & Diehl JA Phosphorylation-dependent regulation of cyclin D1 nuclear export and cyclin D1-dependent cellular transformation. Genes Dev. 14, 3102–3114 (2000). [DOI] [PMC free article] [PubMed] [Google Scholar]
- 15.Lin DI et al. Phosphorylation-dependent ubiquitination of cyclin D1 by the SCFFBX4-aB crystallin complex. Mol. Cell 24, 355–366 (2006). [DOI] [PMC free article] [PubMed] [Google Scholar]
- 16.Ewen ME et al. Functional interactions of the retinoblastoma protein with mammalian D-type cyclins. Cell 73, 487–497 (1993). [DOI] [PubMed] [Google Scholar]
- 17.Jahn SC et al. Assembly, activation, and substrate specificity of cyclin D1/Cdk2 complexes. Biochemistry 52, 3489–3501 (2013). [DOI] [PMC free article] [PubMed] [Google Scholar]
- 18.Chytil A et al. Construction of a cyclin D1–Cdk2 fusion protein to model the biological functions of cyclin D1–Cdk2 complexes. J. Biol. Chem. 279, 47688–47698 (2004). [DOI] [PubMed] [Google Scholar]
- 19.Jansen VM et al. Kinome-wide RNA interference screen reveals a role for PDK1 in acquired resistance to CDK4/6 inhibition in ER-positive breast cancer. Cancer Res. 77, 2488–2499 (2017). [DOI] [PMC free article] [PubMed] [Google Scholar]
- 20.Herrera-Abreu MT et al. Early adaptation and acquired resistance to CDK4/6 inhibition in estrogen receptor-positive breast cancer. Cancer Res. 76, 2301–2313 (2016). [DOI] [PMC free article] [PubMed] [Google Scholar]
- 21.James MK, Ray A, Leznova D & Blain SW Differential modification of p27Kip1 controls its cyclin D-cdk4 inhibitory activity. Mol. Cell. Biol. 28, 498–510 (2008). [DOI] [PMC free article] [PubMed] [Google Scholar]
- 22.Guiley KZ et al. p27 allosterically activates cyclin-dependent kinase 4 and antagonizes palbociclib inhibition. Science 366, eaaw2106 (2019). [DOI] [PMC free article] [PubMed] [Google Scholar]
- 23.Pagano M, Theodoras AM, Tam SW & Draetta GF Cyclin D1-mediated inhibition of repair and replicative DNA synthesis in human fibroblasts. Genes Dev. 8, 1627–1639 (1994). [DOI] [PubMed] [Google Scholar]
- 24.Chen SH et al. CRL4AMBRA1 targets elongin C for ubiquitination and degradation to modulate CRL5 signaling. EMBO J. 37, e97508 (2018). [DOI] [PMC free article] [PubMed] [Google Scholar]
- 25.Xia P et al. WASH inhibits autophagy through suppression of beclin 1 ubiquitination. EMBO J. 32, 2685–2696 (2013). [DOI] [PMC free article] [PubMed] [Google Scholar]
- 26.Rogers ZN et al. Mapping the in vivo fitness landscape of lung adenocarcinoma tumor suppression in mice. Nat. Genet. 50, 483–486 (2018). [DOI] [PMC free article] [PubMed] [Google Scholar]
- 27.Simoneschi D & Pagano D CRL4AMBRA1 is a regulator of D-type cyclins. Nature (2021). [Google Scholar]
- 28.Maiani E, Milletti G, Bartek J & Cecconi F AMBRA1 regulates cyclin D to guard S-phase entry and genomic integrity. Nature (2021). [DOI] [PMC free article] [PubMed] [Google Scholar]
- 29.Santra MK, Wajapeyee N & Green MR F-box protein FBXO31 mediates cyclin D1 degradation to induce G1 arrest after DNA damage. Nature 459, 722–725 (2009). [DOI] [PMC free article] [PubMed] [Google Scholar]
- 30.Burkhart DL & Sage J Cellular mechanisms of tumour suppression by the retinoblastoma gene. Nat. Rev. Cancer 8, 671–682 (2008). [DOI] [PMC free article] [PubMed] [Google Scholar]
- 31.Finn RS et al. PD 0332991, a selective cyclin D kinase 4/6 inhibitor, preferentially inhibits proliferation of luminal estrogen receptor-positive human breast cancer cell lines in vitro. Breast Cancer Res. 11, R77 (2009). [DOI] [PMC free article] [PubMed] [Google Scholar]
- 32.Gong X et al. Genomic aberrations that activate D-type cyclins are associated with enhanced sensitivity to the CDK4 and CDK6 inhibitor abemaciclib. Cancer Cell 32, 761–776.e6 (2017). [DOI] [PubMed] [Google Scholar]
- 33.Finn RS et al. Biomarker analyses of response to cyclin-dependent kinase 4/6 inhibition and endocrine therapy in women with treatment-naive metastatic breast cancer. Clin. Cancer Res. 26, 110–121 (2020). [DOI] [PubMed] [Google Scholar]
- 34.DeMichele A et al. CDK 4/6 inhibitor palbociclib (PD0332991) in Rb+ advanced breast cancer: phase II activity, safety, and predictive biomarker assessment. Clin. Cancer Res. 21, 995–1001 (2015). [DOI] [PubMed] [Google Scholar]
- 35.Xue Y et al. CDK4/6 inhibitors target SMARCA4-determined cyclin D1 deficiency in hypercalcemic small cell carcinoma of the ovary. Nat. Commun. 10, 558 (2019). [DOI] [PMC free article] [PubMed] [Google Scholar]
- 36.Liu J et al. An integrated TCA pan-cancer clinical data resource to drive high-quality survival outcome analytics. Cell 173, 400–416 (2018). [DOI] [PMC free article] [PubMed] [Google Scholar]
Associated Data
This section collects any data citations, data availability statements, or supplementary materials included in this article.
Supplementary Materials
Data Availability Statement
Sequencing data from Tuba-seq experiments and RNA-sequencing data from AMBRA1-knockout U2OS cells are available from the Gene Expression Omnibus under accession numbers GSE146303 and GSE159920, respectively. Mass spectrometry data from shotgun proteomics experiments and analysis of ubiquitylated proteins are available through the ProteomeXchange Consortium, with dataset identifiers PXD021789 and PXD022111, respectively. Public nonprotected RNA-sequencing, copy number alteration, exome sequencing and reverse-phase protein array lung adenocarcinoma datasets from the TCGA were downloaded from https://gdc.cancer.gov/. Clinical data were obtained from a previous publication36 (PMID: 29625055). Gene dependency data from the Cancer Dependency Map are publicly available at www.depmap.org. Protein sequences for mass spectrometry analysis were obtained from the NCBI Homo sapiens protein database (ftp://ftp.ncbi.nlm.nih.gov/ref-seq/release/release-notes/archive/RefSeq-release86.txt, downloaded 05/11/2018) (shotgun mass spectrometry) and from Uniprot (https://www.uniprot.org/uniprot/?query=proteome:UP000005640%20reviewed:yes, downloaded 02/28/2020) (ubiquitin remnant profiling). All other data are available in the Article and supplementary information, or from the corresponding author upon reasonable request. Source data are provided with this paper.


