Abstract
Gene regulation in the germline ensures the production of high-quality gametes, long-term maintenance of the species, and speciation. Male germline transcriptomes undergo dynamic changes after the mitosis-to-meiosis transition and have been subject to evolutionary divergence among mammals. However, the mechanisms underlying germline regulatory divergence remain undetermined. Here, we show that endogenous retroviruses (ERVs) influence species-specific germline transcriptomes. After the mitosis-to-meiosis transition in male mice, specific ERVs function as active enhancers to drive germline genes, including a mouse-specific gene set, and bear binding motifs for critical regulators of spermatogenesis such as A-MYB. This raises the possibility that a genome-wide transposition of ERVs rewired germline gene expression in a species-specific manner. Of note, independently evolved ERVs are associated with the expression of human-specific germline genes, demonstrating the prevalence of ERV-driven mechanisms in mammals. Together, we propose that ERVs fine-tune species-specific transcriptomes in the mammalian germline.
Introduction
The testis has the most diverse, complex, and rapidly evolving transcriptome of all the organs in mammals1–3. Furthermore, the testis expresses the largest number of transcription factors (TFs) of all mammalian organs4. These qualities are due, in part, to specific and dynamic bursts in the expression of thousands of germline genes after the mitosis-to-meiosis transition3,5–8. This transition occurs when germ cells have completed mitotic proliferation and have entered into meiosis, an essential process in the preparation of haploid gametes. Notably, a wide variety of species-specific transcripts have been identified in the later stages of spermatogenesis3,9, giving rise to morphologically and functionally diverse gametes in mammals. However, the mechanisms that enable the rapid evolution of species-specific germline transcriptomes remain to be determined.
In this study, we identify a mechanism that underlies germline regulatory divergence. We report that many rapidly evolved cis regulatory elements—in particular, active enhancers—are derived from certain types of endogenous retroviruses (ERVs). ERVs are the remnants of retroviruses that integrated into the germline genome. Transposable elements (TEs) with long terminal repeats (LTR), a feature shared by ERVs and exogenous retroviruses, constitute approximately 10% of mammalian genomes10. Other classes of TEs, which together account for 40–50% of a given mammalian genome11, include other retrotransposons such as long and short interspersed nuclear elements (respectively, LINEs and SINEs), as well as DNA transposons.
TEs have long been considered genetic threats because transposition can be deleterious by, for example, disrupting the exons of protein-coding genes. On the other hand, the geneticist Barbara McClintock, the discoverer of TEs, proposed in 1950 that TEs function as gene regulatory elements12. Studies in the last decade, long after McClintock’s proposal, have indeed established that TEs can impact host genomes by introducing gene regulatory elements, including promoters and enhancers. Many interspersed ERVs have lost the information necessary to encode the proteins that support autonomous transposition (e.g., pol)13; however, their LTRs retain the ability to recruit TFs and regulate gene expression in host genomes14–18.
In the germline, in which mutations due to transposition are potentially heritable, TE mobility is tightly controlled. The germline draws on several TE-suppression mechanisms, including DNA methylation, H3K9 methylation, and PIWI-interacting RNA (piRNA)19–21. Yet despite these silencing mechanisms, recent studies have revealed regulatory functions for TEs in male meiosis, including post-transcriptional regulation of mRNA and long noncoding RNAs (lncRNAs) via the piRNA pathway22, and promoter functions that drive the expression of lncRNAs23. However, at the mitosis-to-meiosis transition, when dynamic reorganization of 3D chromatin and the epigenome takes place8,24–27, cis regulatory functions for TEs remain undetermined.
Here, we use an unbiased, genome-wide approach to identify ERVs that are within accessible chromatin and expressed after the mitosis-to-meiosis transition. We show that ERVs function as species-specific enhancers in the germline. These enhancers drive expression of evolutionarily novel germline genes after the mitosis-to-meiosis transition, thereby defining the species-specificity of germline transcriptomes in mammals. We also demonstrate the prevalence of ERV-driven germline genes in humans, and we propose a model whereby ERVs fine-tune species-specific transcriptomes in mammalian germlines.
Results
Dynamic expression of repetitive elements during mouse spermatogenesis.
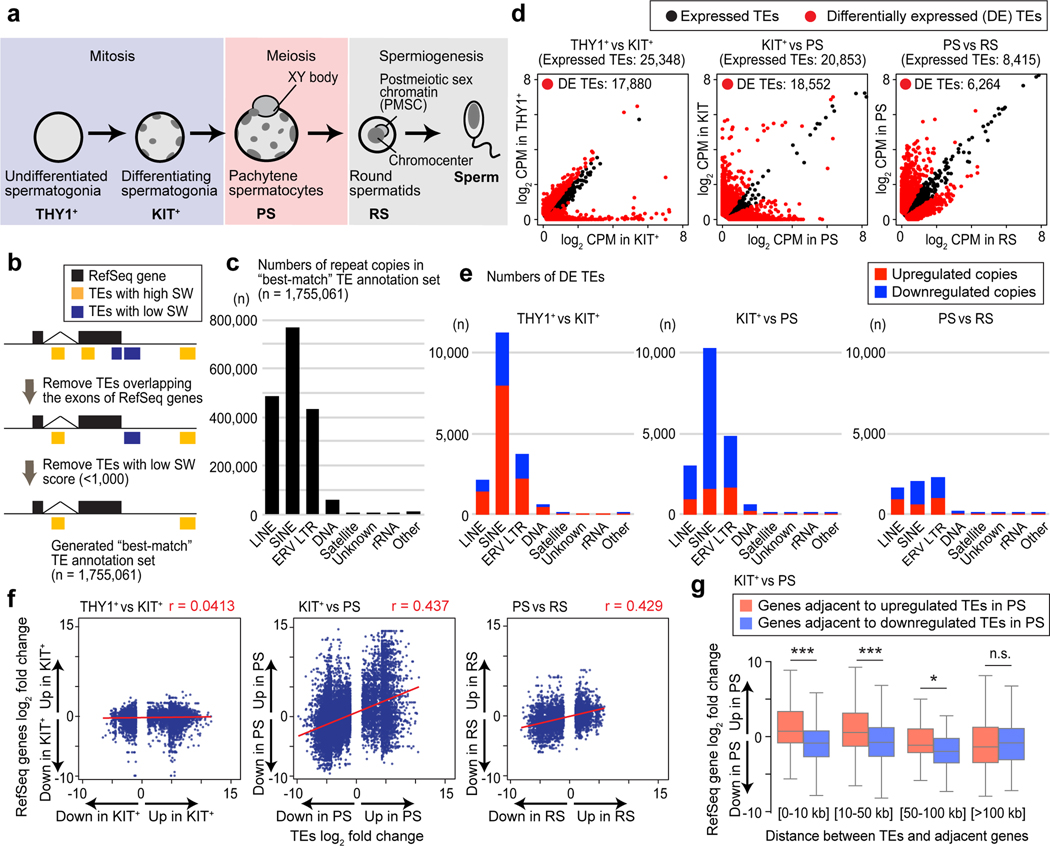
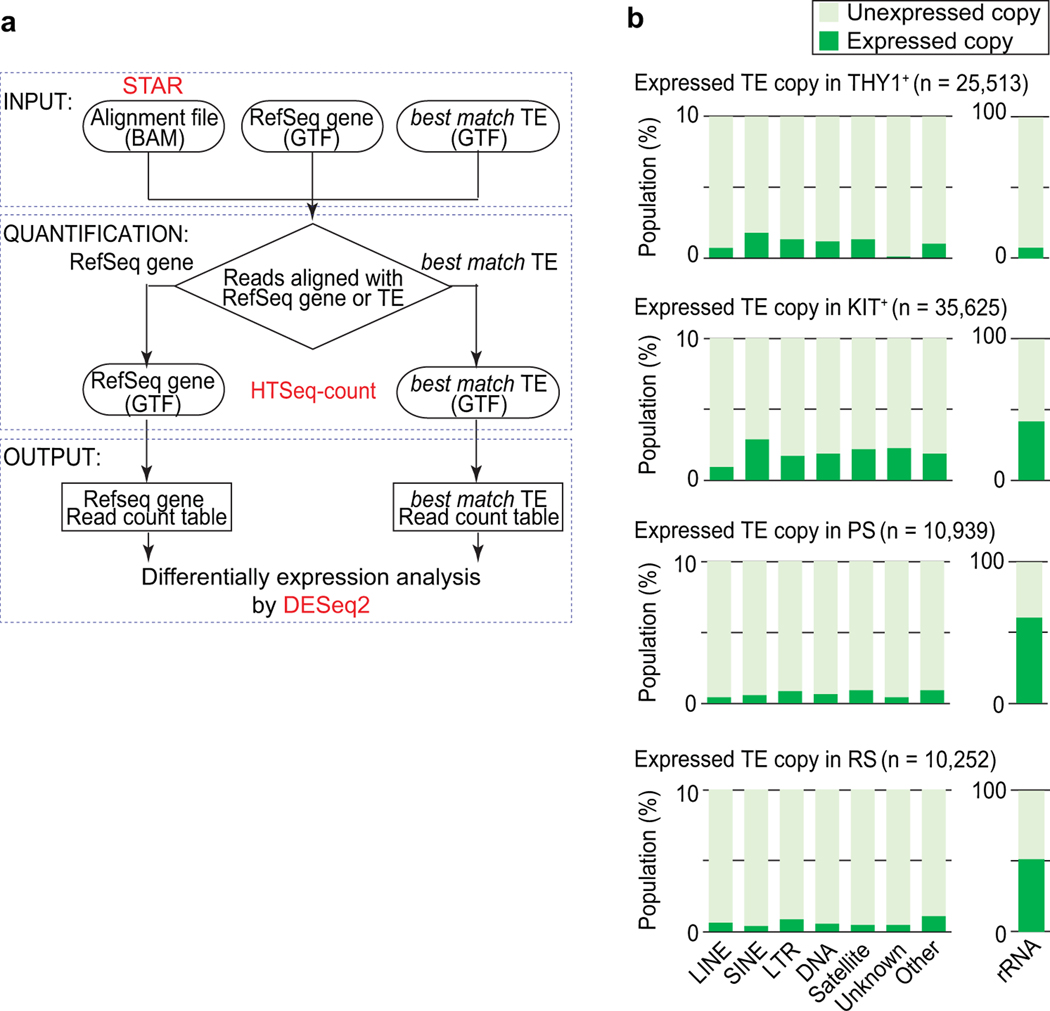
To understand the dynamics of repetitive element expression in spermatogenesis, we analyzed the transcriptomes of four representative stages of spermatogenesis: THY1+ undifferentiated spermatogonia, which contain spermatogonial stem cells and progenitor cells; KIT+ differentiating spermatogonia; pachytene spermatocytes (PS) in the midst of meiosis; and postmeiotic round spermatids (RS)7,8,28 (Fig. 1a). To define regions of interest, we used a RepeatMasker annotation, a unique genomic annotation for interspersed repetitive loci, that specifies the best-matched class of repetitive elements for a given locus, and which does not have redundant annotation (see Methods, Fig. 1b). In this way, we filtered to 1,755,061 “high confidence” loci (Fig. 1c). Applying this “best-match” TE annotation set to our RNA-seq processing pipeline (Extended Data Fig. 1a), we detected the expression of individual TE copies in the four representative stages of spermatogenesis (Extended Data Fig. 1b). Unambiguously expressed TE loci make up a small fraction (less than 3%) of all copies of a given class in the genome (Extended Data Fig. 1b). Yet notably, the majority of detected TEs were differentially expressed during each transition of spermatogenesis (Fig. 1d, Supplementary Data Set 1); in particular, 89.0% (18,552/20,853) of expressed TEs were differentially expressed at the KIT+ spermatogonia-to-PS transition (the mitosis-to-meiosis transition). LINE, SINE, and LTR TEs comprised the major classes of differentially expressed TEs (Fig. 1e). Next, we sought to examine the relationships between stage-to-stage changes in TE expression and stage-to-stage changes in TE-adjacent gene expression. TE expression changes did not correlate with gene expression changes in the THY1+-KIT+ transition (Fig. 1f). However, when we analyzed the KIT+-PS transition, we noted a positive correlation between TE expression changes and changes in adjacent gene expression, and the same was true for the PS-RS transition (Fig. 1f). Next, we examined the distance between TEs and the transcription start sites of their adjacent genes. Our analyses of the KIT+-PS transition revealed that, even when separated by 50–100 kb, TE and adjacent gene expression levels change together (Fig. 1g). This observation raised the possibility that gene transcription in the mitosis-to-meiosis transition is influenced by some portion of TEs in a long-range manner, leading us to interrogate the functions of TEs as enhancers.
Figure 1. Dynamic expression of repetitive elements during mouse spermatogenesis.
(a) Schematic of mouse spermatogenesis and the four representative stages analyzed in this study: THY1+, undifferentiated spermatogonia; KIT+, differentiating spermatogonia; PS, pachytene spermatocytes; RS, round spermatids. (b) Schematic for the generation of a high-confidence, “best-match” TE annotation set (n = 1,755,061). RepeatMasker annotation was used to specify the best-matched repetitive element class/family for a given locus. We removed TEs overlapping exons and/or poorly matching the consensus sequence of their specified element class as evidenced by a low Smith-Waterman (SW) alignment score. (c) Copy numbers of each class of TEs in the “best-match” TE annotation set. (d) Scatter plots show differentially expressed TE copies in each transition. Differentially expressed copies of TEs were defined as those with a ≥2-fold change using DESeq2. We defined expressed TEs as those with baseMean values ≥2 in two successive stages. (e) Numbers of differentially expressed TE copies in each class. (f) Scatter plots show the correlation between expressed TEs and expression of their adjacent genes. Red lines are regression lines (Pearson correlation: r). (g) Box-and-whisker plots show the expression changes of RefSeq genes adjacent to differentially expressed TEs in pachytene. Changes are compared between KIT+ and PS. Distances between TEs and the transcription start sites of their adjacent genes are shown. *P <0.05, ***P < 0.001, n.s., not significant, Mann-Whitney U tests. Central bars represent medians, the boxes encompass 50% of the data points, and the whiskers indicate 90% of the data points. Data for panels in c-g are available as source data.
A subset of ERVs has enhancer-like features in late spermatogenesis.
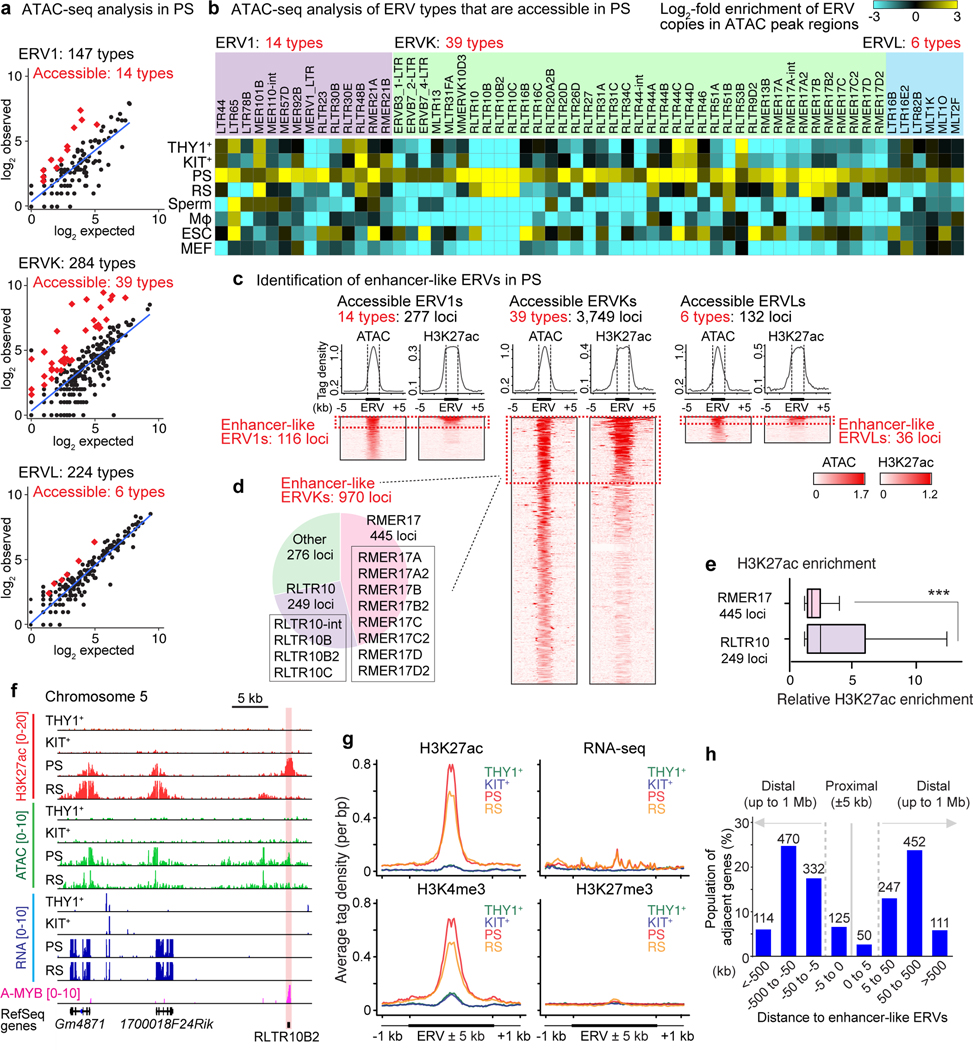
Among the major classes of expressed TEs (LINE, SINE, and ERV LTR), ERV LTRs bear TF-binding sites and are known to function as gene regulatory elements in other settings14–18. Therefore, we suspected that ERVs function as gene regulatory elements after the mitosis-to-meiosis transition. Open, accessible chromatin is a prominent feature of functioning gene regulatory elements; thus, to determine the sites of accessible chromatin in PS, we analyzed previously published ATAC-seq (assay for transposase-accessible chromatin using sequencing) data24. While we found that most ERV loci evince closed chromatin genome-wide (Extended Data Fig. 2a), we found that numerous types of ERVs were significantly enriched in the open, accessible chromatin in PS (Fig. 2a). Interestingly, the majority of ERVs in accessible chromatin come from the ERVK family, one of the three major families that comprise ERVs (ERV1 family: 14 types; ERVK family: 39 types; ERVL family: 6 types; Fig. 2a, b). In analyzing multiple stages of spermatogenesis, we noticed that several types of accessible ERVs were specific to PS or both PS and RS (Fig. 2b), suggesting such ERVs possess specific functions in meiosis and subsequent stages of spermatogenesis.
Figure 2. Identification of enhancer-like ERVs in meiosis.
(a) Scatter plots depict observed ERV copy numbers in regions of acessible chromatin (within ATAC peak regions: y-axis) versus the expected prevalence of ERV loci throughout the mouse genome (X-axis) in the following ERV families in PS: ERV1, ERVK, and ERVL. Each dot represents a single type of ERV within a subfamily; red diamonds represent ERV types that exhibit significant enrichment in ERV copy numbers in regions of accessible chromatin (≥2-fold observed/expected enrichment: P < 0.05, binominal test; see Methods). (b) Heatmaps depict log2-fold enrichment of ERV copies in ATAC peak regions relative to genomic prevalence. ERV loci that are accessible in PS are shown. Mφ, macrophages; ESC, embryonic stem cells; MEF, mouse embryonic fibroblasts. (c) Average tag density plots and heatmaps show ATAC and H3K27ac enrichment at accessible ERV regions in PS. We use the term “enhancer-like ERVs” for ERV loci that exhibit both significant ATAC and H3K27ac (n = 1,122 loci : ≥1.5-fold enrichment in comparison to input; see Methods). (d) Pie chart indicates the relative abundances of enhancer-like ERVKs. (e) Relative H3K27ac enrichment at enhancer-like RMER17 and RLTR10 loci in PS. ***P < 0.001, Mann-Whitney U test. Central bars represent medians, the boxes encompass 50% of the data points, and the whiskers indicate 90% of the data points. (f) Track views of an enhancer-like ERV locus. An enhancer-like ERV locus is highlighted. (g) Average tag density plots around enhancer-like ERVs (±1 kb around ±5 kb of ERVs) in representative stages of spermatogenesis. (h) Bar chart depicts the regional distribution of genes adjacent to enhancer-like ERVs; proximal adjacency: ±5 kb; distal adjacency: up to ±1 Mb. Numbers of genes are shown above bars. Data for panels in a, b, e are available as source data.
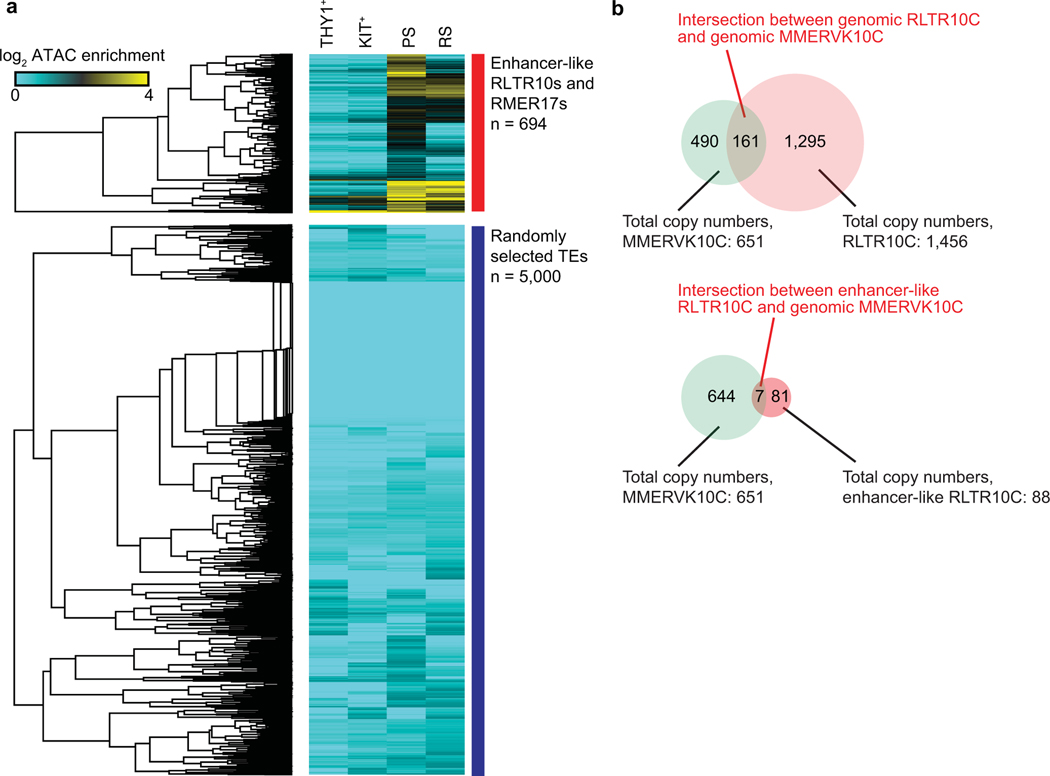
Given that ERVs are interspersed throughout the genome, we hypothesized that ERVs function as enhancers that drive the expression of spermatogenesis-specific genes. To test this hypothesis, we analyzed the ChIP-seq (chromatin immunoprecipitation sequencing) signal enrichment for H3K27 acetylation (H3K27ac), a marker of active enhancers, in PS29 (Maezawa et al.)30. Through the thresholding of H3K27ac enrichment and accessible chromatin at individual ERV loci (see Methods), we defined a category of ERVs said to be “enhancer-like” in PS (ERV1: 116 enhancer-like loci; ERVK: 970 enhancer-like loci; ERVL: 36 enhancer-like loci; Fig. 2c, Supplementary Data Set 2). Two major ERVK subfamilies, RMER17 (445 loci) and RLTR10 (249 loci), were highly represented among ERVK loci bearing significantly enriched H3K27ac and accessible chromatin (Fig. 2d). Notably, H3K27ac was highly enriched on RLTR10 in comparison to RMER17 (Fig. 2e). Curiously, RLTR10C, a type of RLTR10, was frequently adjacent to MMERVK10C, which has full viral elements flanked by two RLTR10C loci31 and is suppressed by Tex19.1 in the germline32. However, the overlap between enhancer-like RLTR10C and MMERVK10C is largely coincidental (Extended Data Fig. 2b), suggesting that enhancer-like RLTR10C is a solo LTR that has lost flanking viral elements.
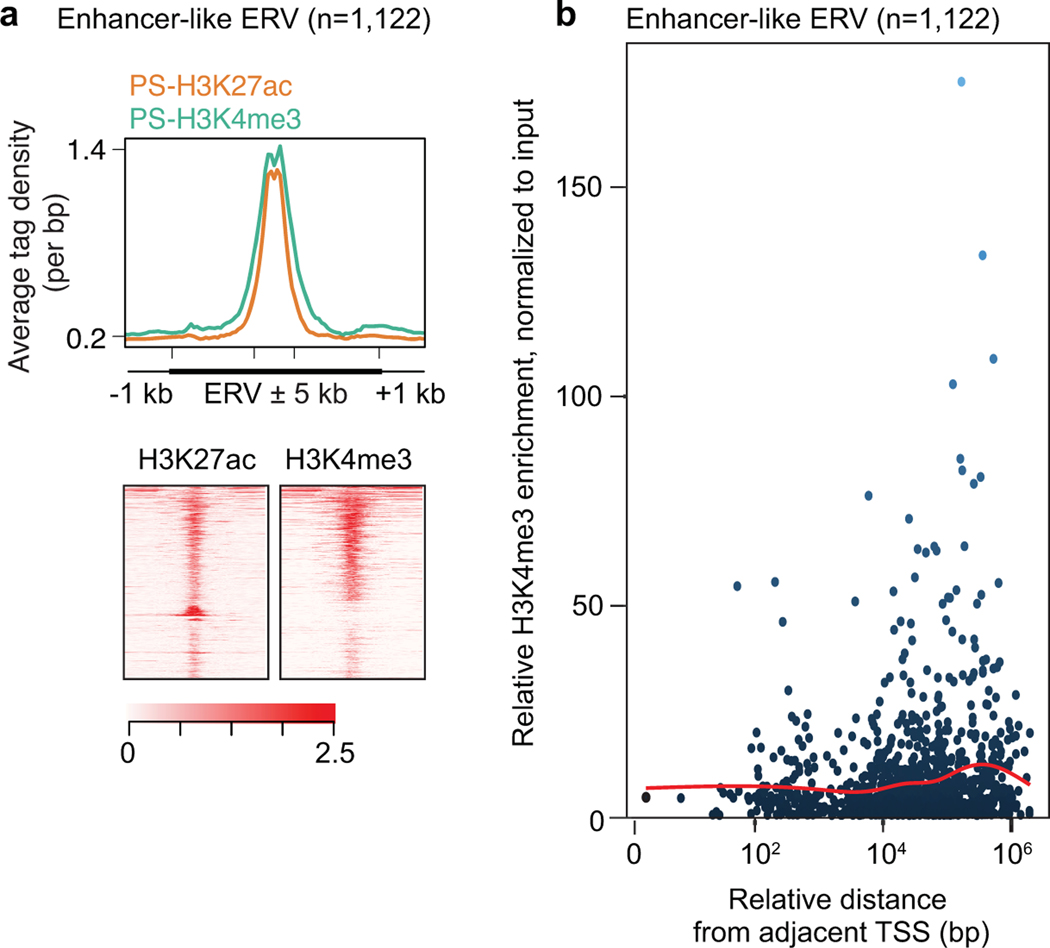
Intriguingly, in PS and RS, we noted that the establishment of H3K27ac and open chromatin at autosomal RTLR10 loci was associated with the transcriptional upregulation of adjacent genes (Fig. 2f). Average tag density analyses revealed significant H3K27ac enrichment within enhancer-like ERVs in PS and RS (Fig. 2g). In support of its putative gene regulatory status, low levels of RNA-seq signal were detected at enhancer-like ERVs (Fig. 2g). Enhancer-like ERVs were also enriched for the active mark H3K4me3 in PS and RS (Fig. 2g). H3K4me3 peaks at enhancer-like ERVs were located far from promoters: ≥10 kb (Extended Data Fig. 3). Consistent with this, the majority of enhancer-like ERV-adjacent genes are located ~5–500 kb away from enhancer-like ERVs (Fig. 2h). Such H3K4me3 localization patterns, together with the low levels of mRNA transcription, comprise a known feature of tissue-specific enhancers33. As a control, we noted that the repressive mark H3K27me3 did not accumulate on enhancer-like ERVs (Fig. 2g). A previous study suggested that ERVs function as enhancers in placenta and testes34. Our results corroborate this notion: Specific subsets of ERVs gain the features of active enhancers in late spermatogenesis.
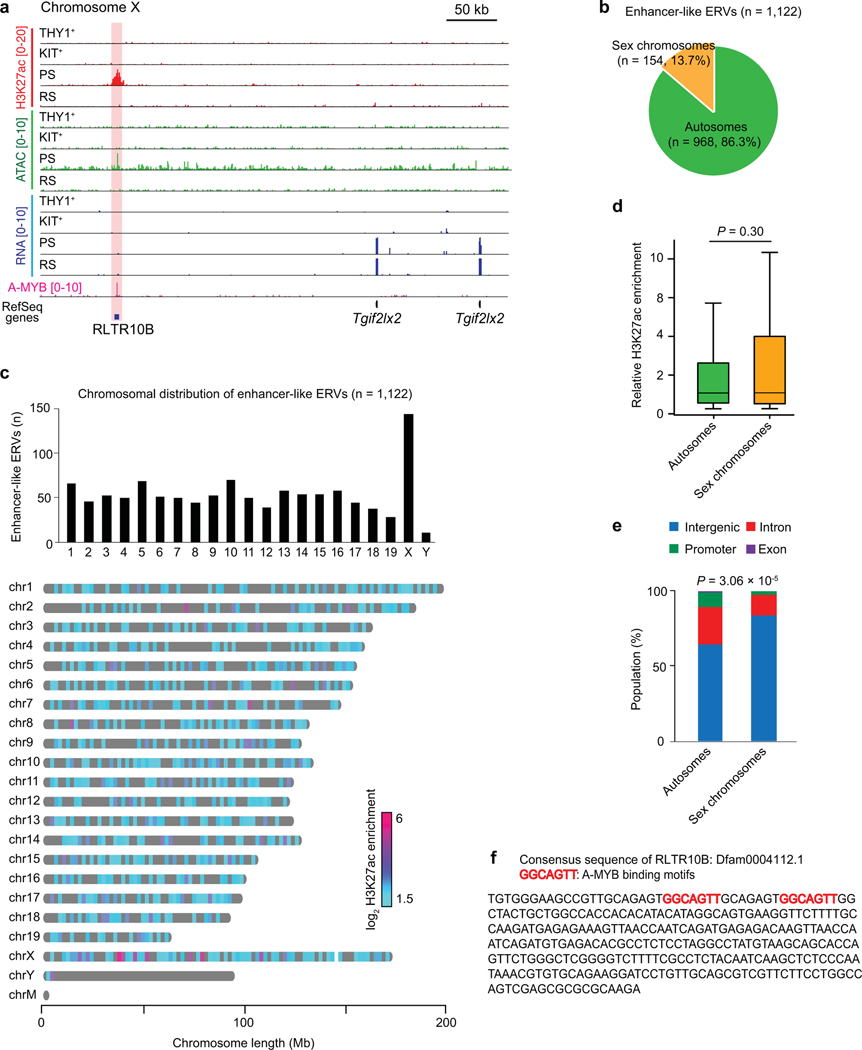
During male meiosis, the sex chromosomes undergo a tightly coordinated process of transcriptional inactivation known as “meiotic sex chromosomes inactivation” (MSCI); perhaps counterintuitively, it is in this context that the accessibility of sex chromosome-associated chromatin increases24 and many active enhancers are established29. A representative track-view demonstrates that, on the PS X chromosome, the establishment of H3K27ac and open chromatin at RTLR10 loci in PS correlates with activation of transcripts that escape postmeiotic silencing in RS (Extended Data Fig. 4a). Of note, enhancer-like ERVs were enriched on the X chromosome (Extended Data Fig. 4b, c), although H3K27ac intensity is comparable between the sex chromosomes and autosomes (Extended Data Fig. 4d), and enhancer-like ERVs on the sex chromosomes are preferentially located in intergenic regions (Extended Data Fig. 4e). The establishment of H3K27ac on the silent X chromosome in meiosis and subsequent escape gene activation in RS is regulated by RNF8, a DNA damage response factor29,35. Therefore, on chromosome X, enhancer-like ERVs are regulated downstream of RNF8.
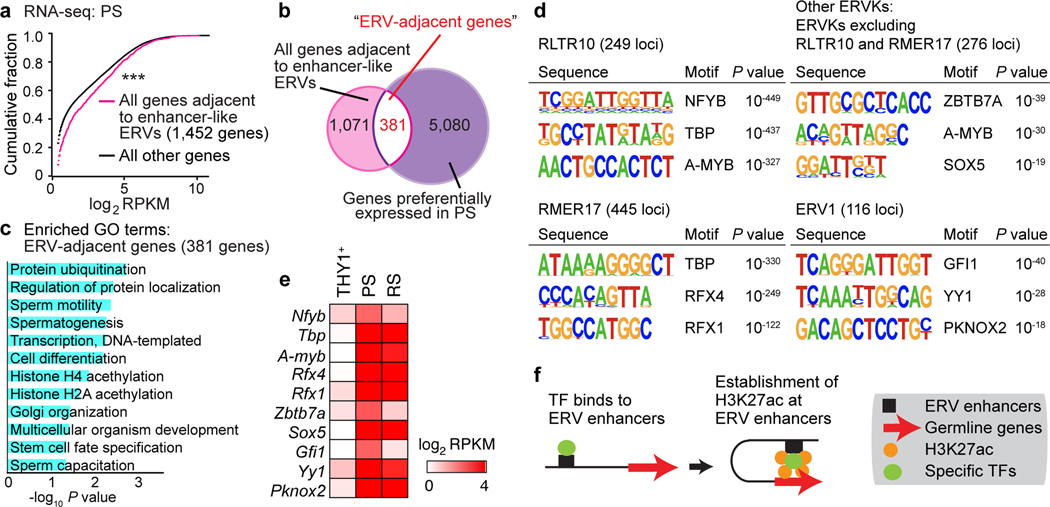
To further define the functions of ERVs as enhancers, we tested the hypothesis that genes adjacent to enhancer-like ERVs evince preferential expression relative to non-adjacent genes after the mitosis-to-meiosis transition. To this end, we identified 1,452 genes that are adjacent to enhancer-like ERVs in PS. Importantly, these 1,452 genes were highly expressed in PS in comparison to other genes in the genome (Fig. 3a; see Methods). Among 1,452 genes, 381 genes (26.2%: Supplementary Data Set 3) overlapped with genes activated in the mitosis-to-meiosis transition (Fig. 3b). We performed gene ontology (GO) analysis on the 381 highly expressed ERV-adjacent, mitosis-to-meiosis genes and revealed that they comprise genes associated with protein ubiquitination, sperm motility, and spermatogenesis (Fig. 3c). While some of the ERV-adjacent genes have established functions in spermatogenesis—e.g., Spata24, Nme8, and Zscan228,29—many of the ERV-adjacent genes have no known roles in spermatogenesis; these include the ~10% of ERV-adjacent genes that bear sequence identifiers such as “Gm,” “BC,” or “Rik”—e.g., Gm1141, BC051142, and 1500011B03Rik.
Figure 3. Enhancer-like ERVs provide binding motifs for critical transcription factors.
(a) Cumulative distribution plot compares the expression of the following gene sets in PS: genes adjacent to enhancer-like ERVs (pink); all other NCBI RefSeq genes (black). Gene expression patterns differ significantly between the two sets: ***P < 0.001, Kolmogorov-Smirnov test. (b) Venn diagram shows the intersection between the following sets of genes: genes adjacent to enhancer-like ERVs (pink: 1,452 genes); genes preferentially expressed in PS (purple: 5,461 genes). When considering the ratio of preferentially expressed genes in PS to all genes in the genome (5,461 preferentially expressed genes / all 22,661 RefSeq genes in the genome), this association (381 genes / 1,452 genes) is statistically significant (P = 0.0270, hypergeometric test). (c) Bar chart depicts statistical significance of gene ontology (GO) terms for genes adjacent to enhancer-like ERVs. (d) HOMER Motif analyses for putative transcription factor-binding sites in the following enhancer-like ERVs: RLTR10; RMER17; a set of all Enhancer-like ERVKs excluding RLTR10B and RMER17; and ERV1 loci. (e) Heatmap depicts the expression levels of representative transcription factors in representative stages of spermatogenesis. (f) Model: Enhancer-like ERVs act as activators of germline genes. Data for panels in a, e are available as source data.
ERVs are known to carry binding sites for TFs and, therefore, bear the potential to rewire transcriptomes via transposition14–18. To determine the TF-binding sites present in enhancer-like ERVs, we performed motif analyses. In enhancer-like RLTR10 loci, we identified TF motifs such as binding sites for A-MYB (also known as MYBL1), a male germline-specific transcription factor that drives spermatogenesis-related gene expression from meiotic prophase onward36,37 (Fig. 3d). In line with this finding, the consensus sequence of RLTR10B, which is listed in the Dfam database38, contains two A-MYB binding motifs (Extended Data Fig. 4f). A-MYB-binding sites were not observed in RMER17, another major ERVK subfamily constituting enhancer-like ERVs, nor were they observed in ERV1 (Fig. 3d). However, A-MYB-binding sites were also detected in a set of all enhancer-like ERVKs that excluded RLTR10B and RMER17 (“other ERVKs”: Fig. 3d). Importantly, A-MYB-binding sites were not detected in non-enhancer-like RLTR10, suggesting a specific function for A-MYB in the regulation of enhancers In support of our motif analyses, A-MYB ChIP-seq peaks from whole testis tissue37 overlapped with enhancer-like ERV loci—specifically, RLTR10B loci—in intergenic regions, both on autosomes and the X chromosome (Fig. 2f, Extended Data Fig. 4a). Consistent with this, a recent study demonstrated that A-MYB binds to RLTR10B39. In addition to A-MYB, we detected binding sites for other TFs. In evaluating motifs associated with (a) RLTR10, (b) RMER17, (c) other ERVKs, and (d) ERV1, we detected binding sites for the following TFs: NFYB, TBP, RFX4, RFX1, ZBTB7A, SOX5, GFI1, YY1, and PKNOX2 (Fig. 3d). Furthermore, the expression of these TFs was highly upregulated in PS (Fig. 3e). Taken together, these analyses raise the following possibility: In late spermatogenesis, various types of ERVs serve as active enhancers by presenting TF-binding sites, the binding of which drives expression of spermatogenesis-specific transcripts (Fig. 3f).
A-MYB acts on ERV enhancers to activate adjacent germline genes.
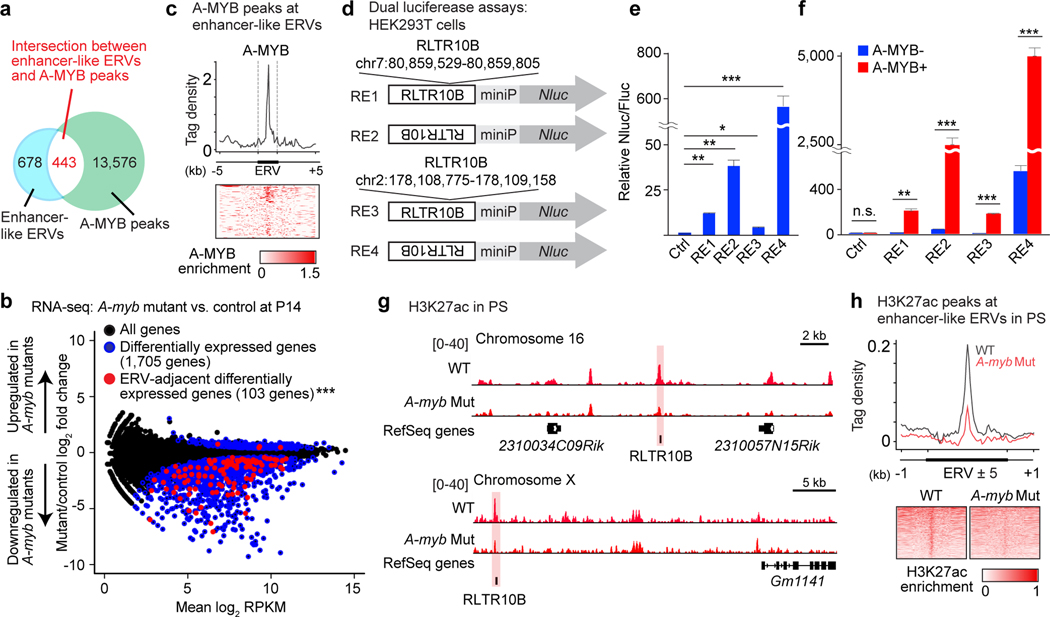
We sought to test the possibility that binding of A-MYB to enhancer-like ERVs enables activation of adjacent genes in late spermatogenesis. In support of this hypothesis, we observed a significant overlap between enhancer-like ERVs and A-MYB-binding sites throughout the genome (443/1,122, 39.5%; Fig. 4a). We analyzed previously published RNA-seq data from the testes of A-myb mutants (Mybl1repro9) at postnatal day 14 (P14)37 (Fig. 4b). Consistent with the reported role of A-MYB in the activation of late spermatogenesis genes, 1,705 genes were differentially expressed, and most of them were downregulated upon the loss of A-MYB (Fig. 4b). Importantly, we observed a significant overlap of ERV-adjacent genes and genes differentially expressed in A-myb mutants: 103 genes out of the set of 381 highly expressed ERV-adjacent, mitosis-to-meiosis genes; many of them were found among the downregulated genes of A-myb mutants. Of note, A-MYB binds the central regions of enhancer-like ERVs adjacent to the 103 genes that are differentially expressed in A-myb mutants, (n = 134 loci; Fig. 4c), suggesting that A-MYB functions at enhancer-like ERV loci.
Figure 4. A-MYB acts on ERV enhancers to drive the expression of adjacent genes.
(a) Venn diagram shows the intersection of enhancer-like ERVs (blue); A-MYB peaks (green). Among 1,122 enhancer-like ERV loci, 443 loci (39.5%) overlapped with A-MYB peaks. This is statistically significant compared to the proportion of 2,807 ERV loci overlapped with A-MYB peaks among 733,999 ERV loci in the genome (0.382%). P < 2.2 × 10⁻¹⁶, Fisher’s exact test. (b) RNA-seq differential gene expression analysis: A-myb mutant vs. heterozygous control testes at postnatal day 14 (P14). 1,705 genes evince significant changes in expression in A-myb mutants (blue circles): P adj < 0.01, binominal test with Benjamini-Hochberg correction; 103 enhancer-like ERV-adjacent genes are present amidst the 1,705 dysregulated genes in A-myb mutants (red circles): ***P = 2.43 × 10⁻³¹, hypergeometric test. 103 dysregulated ERV-adjacent genes (red circle) ÷ 381 ERV-adjacent genes; 1,705 total dysregulated genes (blue circle) ÷ 22,661 NCBI RefSeq genes (all genes: black circle). (c) Average tag density plot and heatmap shows A-MYB enrichment at enhancer-like ERVs (n = 134 loci) adjacent to the 103 dysregulated genes (d) Constructs used for dual luciferase reporter assays in HEK293T cells. miniP: minimal promoter; RE: Regulatory elements (two representative enhancer-like ERV loci). An empty vector was used as a negative control (Ctrl). (e, f) Dual luciferase reporter assays. Relative fold changes in Nluc activity (Nluc/Fluc) were normalized to the negative Ctrl Nluc/Fluc ratio. Error bars represent mean ± s.e.m.: *P <0.05, **P < 0.01, ***P < 0.001, n.s., not significant, unpaired t tests. Three biological replicates were examined. (g) Representative track views show H3K27ac ChIP-seq peaks in wild-type (WT) and A-myb mutant (Mut) PS. Enhancer-like ERV loci are highlighted. (h) Average tag density plot and heatmaps show H3K27ac enrichment at enhancer-like ERV loci in WT and A-myb Mut PS. Data for panels in b, e, f are available as source data.
To determine whether A-MYB acts on enhancer-like ERVs to activate genes, we performed luciferase reporter assays in HEK293T cells to measure the activity of enhancer-like ERVs as regulatory elements under conditions where A-MYB is expressed. In these experiments, we tested the activity of two independent enhancer-like RLTR10B loci with forward and reverse orientations (Fig. 4d). Reverse orientations for both enhancer-like RLTR10B loci exhibited stronger activities (up to 566-fold), confirming the activity of RLTR10B as a gene regulatory element (Fig. 4e). Remarkably, the induction of A-MYB expression boosts the activity up to 5,060-fold (Fig. 4f). Such a result indicates A-MYB acts on RLTR10B to activate target genes.
To test the in vivo function of A-MYB in the activation of enhancer-like ERVs, we performed ultra-low-input native ChIP-seq40 for H3K27ac using small numbers of A-myb mutant PS—an experimental necessity since A-myb mutant PS fail to complete meiosis and, thus, are available in limited quantities. Representative track-views demonstrate that H3K27ac was significantly reduced at enhancer-like ERVs at an autosomal locus and at an X-chromosomal locus (Fig. 4g). We noted that, in A-myb mutant PS, the establishment of H3K27ac was largely impaired at enhancer-like ERVs throughout the genome (Fig. 4h). Taken together, these data support a function for A-MYB in the establishment of enhancer-like ERVs.
ERV enhancers function to activate adjacent germline genes.
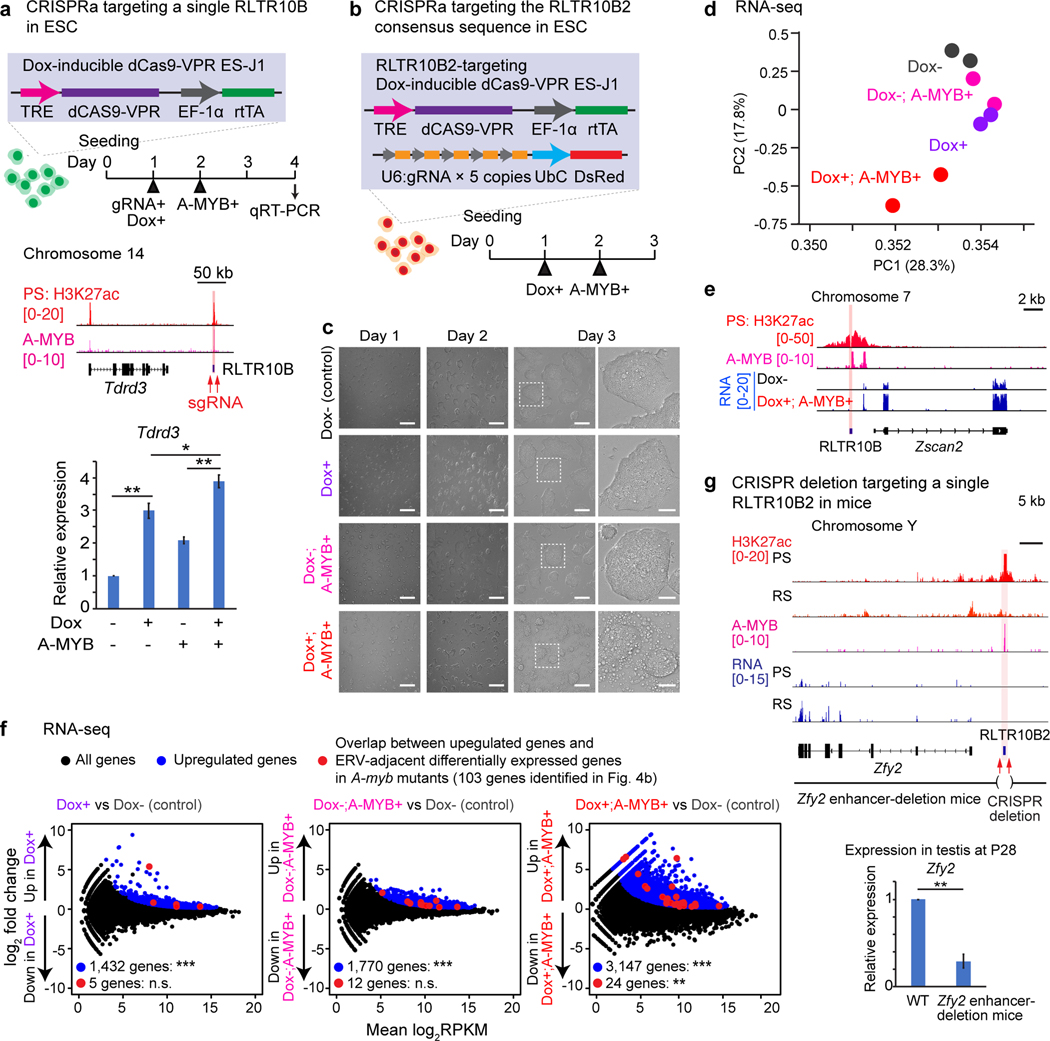
To confirm the activation of germline genes adjacent to enhancer-like ERVs, we performed CRISPR activation (CRISPRa) experiments using embryonic stem (ES) cells in which meiotic enhancer-like ERVs and germline genes are not active. We generated doxycycline (Dox)-inducible CRISPRa ES cells (J1 ES cells harboring a Dox-inducible dCAS9-VPR transgene; Extended Data Fig. 5a). Using the CRISPRa ES cells, we activated a representative enhancer-like RLTR10B locus adjacent to the Tdrd3 gene by introducing two guide RNAs (gRNAs) within a 1-kb region of the A-MYB-binding site (Fig. 5a). Upon Dox induction and gRNA treatment, expression of Tdrd3 was induced (Fig. 5a); upon additional expression of A-MYB, Tdrd3 expression was enhanced (Fig. 5a). Based on the functional validation of an individual RLTR10B locus, we sought to understand the functions of multiple RLTR10B loci via CRISPRa of the RLTR10B2 consensus sequence, which shares high homology with other RLTR10B subtypes. We therefore transduced the cells with a lentiviral construct containing 5 gRNAs that target the consensus sequence of RLTR10B2 (Fig. 5b, Extended Data Fig. 5b). In the Dox+; A-MYB+ model, we observed a significant increase in cell death (Fig. 5c). Principal component analysis (PCA) of our RNA-seq samples confirmed that the Dox+; A-MYB+ model deviated from global gene expression profiles derived from the control (Dox-) model compared to conditions with CRISPRa or A-MYB expression only (Fig. 5d). In accord with our PCA data, RNA-seq analysis revealed ectopic gene expression on both local and global scales. Zscan2, an ERV enhancer-adjacent gene, was activated upon induction of CRISPRa and A-MYB expression (Fig. 5e). Genome-wide, we noted significant upregulation of genes adjacent to enhancer-like ERVs (Fig. 5f), particularly ERV-adjacent differentially expressed genes observed in A-Myb mutants (Fig. 5f). Further, simultaneous induction of CRISPRa and A-MYB expression exacerbates abnormal gene expression in comparison to CRISPRa or A-MYB-expression-only conditions (Fig. 5f, Supplementary Data Set 4).
Figure 5. ERV enhancers function to activate adjacent germline genes.
(a) CRISPR activation (CRISPRa) of a single RLTR10B. Top: Schematic for CRISPRa of a single enhancer-like RLTR10B locus (highlighted in red). Bottom: CRISPRa-dependent expression of the gene Tdrd3 in ES cells as measured by qRT-PCR. Error bars represent mean ± s.e.m.: *P < 0.05, **P < 0.01, unpaired t tests.Three biological replicates were examined. (b) Schematic for CRISPRa experiments targeting the RLTR10B2 consensus sequence in ES cells. (c) Phase contrast images of ES cells in which the RLTR10B2 consensus sequence has been targeted via CRISPRa. Scale bars, first three panels left-to-right: 200 μm; right-most panels: 50 μm. (d) Principal component analysis: RNA-seq of ES cells in which the RLTR10B2 consensus sequence has been targeted via CRISPRa. For each condition, two biological replicates were examined. (e) Track view for ES cells in which the RLTR10B2 consensus sequence has been targeted via CRISPRa. An enhancer-like ERV locus is highlighted. (f) RNA-seq analysis of ES cells in which the RLTR10B2 consensus sequence has been targeted via CRISPRa. 1, 432, 1,770, and 3,147 genes evinced significant upregulation in expression (***P adj < 0.01, binomial test with Benjamini-Hochberg correction) in Dox+, Dox-; A-MYB+, and Dox+; A-MYB+ ES cells (blue circles). n.s., not significant, **P = 6.73 × 10⁻³, hypergeometric test. 5, 12, or 24 upregulated ERV-adjacent genes (red circles) ÷ 103 ERV-adjacent differentially expressed genes in A-myb mutants (identified in Fig. 4b); 3,965 upregulated genes (blue circles) ÷ 22,661 NCBI RefSeq genes. (g) CRISPR deletion of a single representative RLTR10B locus in mice. Top: Schematic for the Zfy2 enhancer-deletion mouse model. Bottom: Expression of Zfy2 as measured by qRT-PCR in testes at P28. Four independent Zfy2 enhancer-deletion mice were examined. Error bars represent mean ± s.e.m.: **P < 0.01, unpaired t tests. Data for panels in a, d, f, g are available as source data.
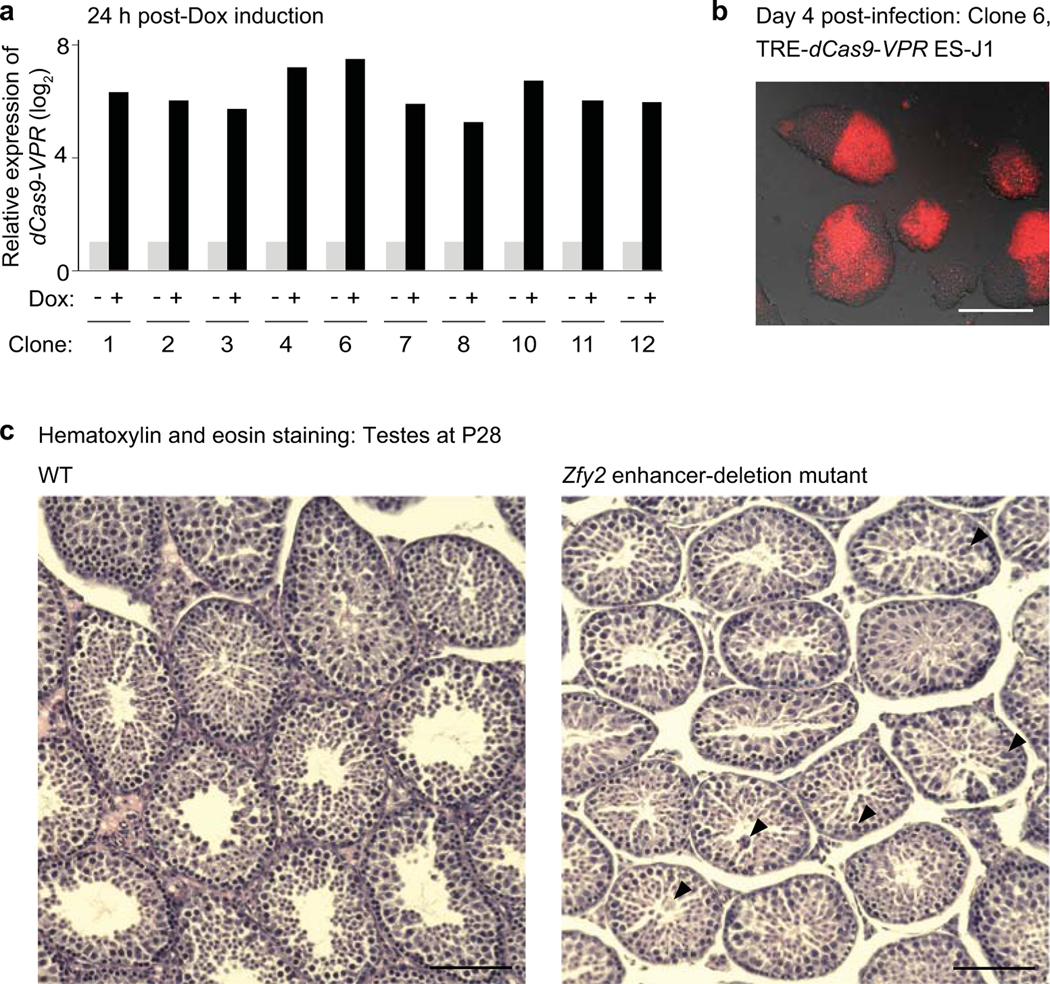
To understand the functional significance of a representative enhancer-like ERV in an in vivo model for spermatogenesis, we performed CRISPR deletion for a representative enhancer-like ERV in mouse spermatogenesis. We generated a mouse line in which an enhancer-like RLTR10B upstream of the gene Zfy2, a Y chromosome-linked gene, was deleted. In this mouse model, Zfy2 expression was compromised in the testes at P28 (Fig. 5g), although testis morphology was not affected (Extended Data Fig. 5c). This result is consistent with an independent study showing that deletion of Zfy2 is compatible with normal spermatogenesis41. We analyzed P28 testes because, at this timepoint, spermatogenesis has progressed to the round spermatid stage42 and Zfy2 is highly expressed41. We conclude that RLTR10B can function as a bona fide enhancer that activates adjacent germline genes, and that A-MYB acts on RLTR10B to activate ERV enhancers. We hereafter refer to enhancer-like ERVs as “ERV enhancers.”
Rodent-specific ERV enhancers regulate species-specific gene expression.
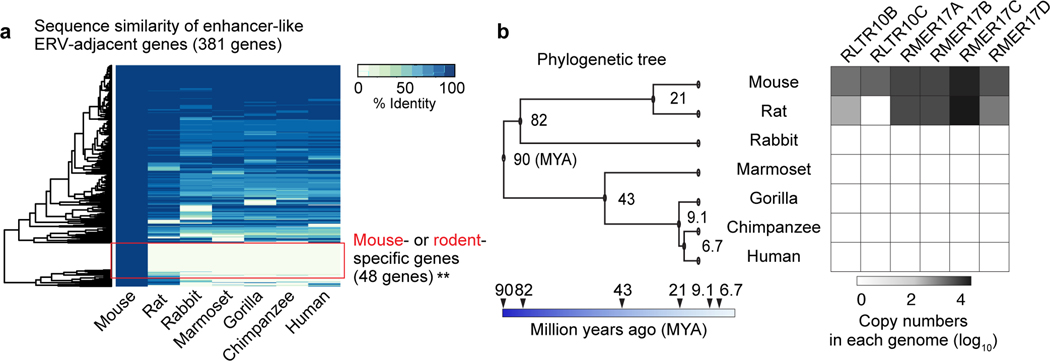
Meiotic spermatocytes and postmeiotic spermatids manifest high levels of transcriptomic diversity across mammalian species3,9. Therefore, we reasoned that rodent-specific ERV enhancers may drive the expression of newly evolved genes, thereby conferring a species-specific form of transcriptomic diversity in late spermatogenesis. To test this possibility, we sought to determine the degree of sequence diversity of ERV-adjacent genes in mammals. Notably, a subset of ERV-adjacent genes found in mice do not have unambiguous homologs in other mammals that we examined—including another rodent, rat (48/381, 12.6%; Fig. 6a). Furthermore, many ERV-associated genes with homologs among mammals are poorly conserved, which raises the possibility of divergent functions in mouse (Fig. 6a). These results suggest that genes close to ERV enhancers are evolutionarily new in mice and/or rapidly evolved among mammals. Thus, ERV enhancers in mice are likely to regulate mouse-specific or evolutionarily diverged genes.
Figure 6. Genes adjacent to rodent enhancer-like ERVKs are less conserved across species.
(a) Heatmap of sequence identity percentages for 381 mouse ERV-adjacent genes across 6 other species. Mouse-specific genes were significantly enriched in enhancer-like ERV-adjacent genes in comparison to a randomly picked background set of genes (see Methods): **P < 0.01, Fisher’s exact test. (b) Phylogenetic tree and heatmap depict the abundance of selected enhancer-like ERVK types across 7 species. Data for panels in a, b are available as source data.
To determine the species-specific features of ERV enhancers, we examined the evolutionary traits of young ERVKs (i.e., ERVKs specific only to mice), RLTR10B and RMER17, in mammals (Fig. 6b). Of the ERV enhancers in mice, specific types are found only in rodents, and one of these ERVKs, RLTR10C, has no counterparts outside of mice (Fig. 6b). ERV enhancers with counterparts in rats displayed varied copy numbers (Fig. 6b). To test the conservation of ERV integration in rats and mice, we compared the genomic distributions of ERV enhancers and found that, for the most part, the genomic distributions and integration of their ERV enhancers differ (Extended Data Fig. 6a, b).
Subsets of ERVK and ERV1 are associated with meiotic gene expression in humans.
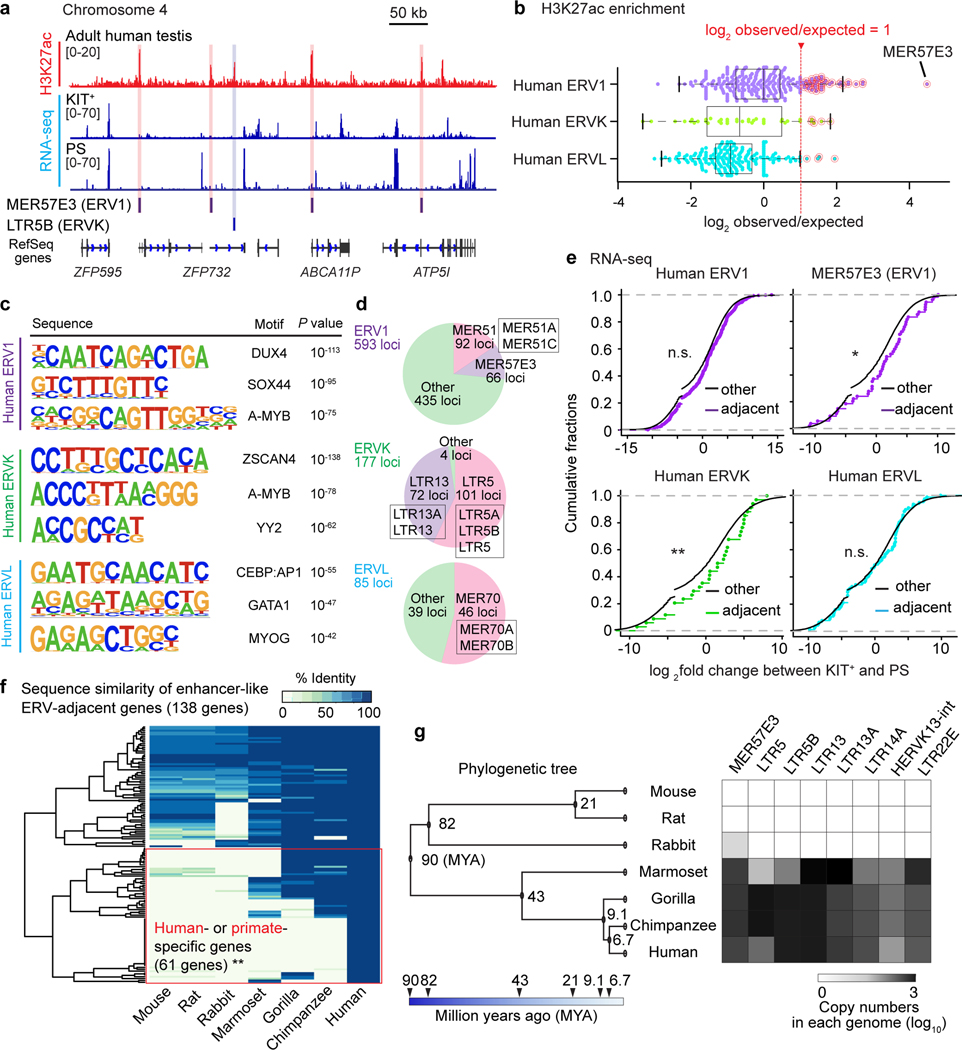
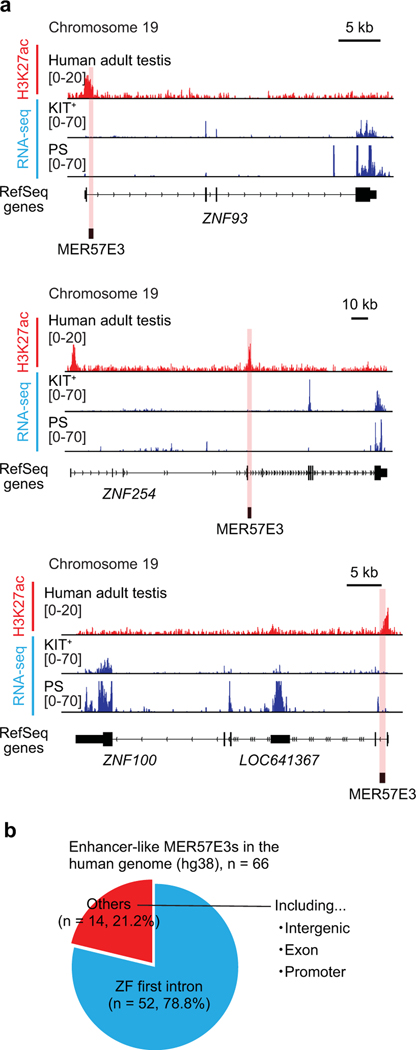
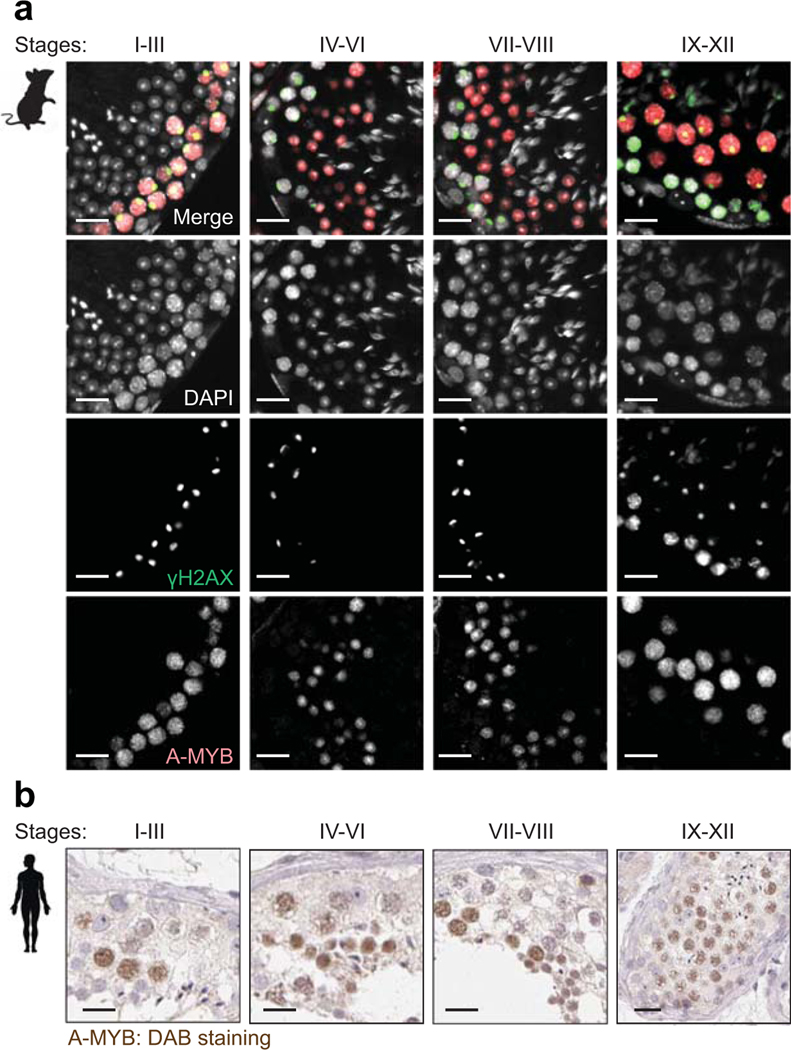
To investigate species-specific functions of ERVs in other mammalian species, we analyzed human spermatogenesis. In particular, we sought to determine whether human-specific ERVs have enhancer-like features in spermatogenesis. To this end, we analyzed H3K27ac ChIP-seq data from human testes deposited in ENCODE43. We found that MER57E3, a type of ERV1, and LTR5B, a type of ERVK, is enriched with H3K27ac and occupies a location adjacent to transcripts in human PS (Fig. 7a). To evaluate the genome-wide features of ERVs in human testes, we examined the enrichment of H3K27ac on each type of ERV in the following ERV families: ERV1, ERVK, and ERVL. We found a subset of human ERV types that is highly enriched with H3K27ac (>2-fold enrichment); of this subset, MER57E3 exhibited the highest levels of H3K27ac (Fig. 7b). Among 66 enhancer-like MER57E3 loci, 52 were found within the first introns of zinc finger (ZF) genes (Extended Data Fig. 7). These findings raise the possibility that a majority of MER57E3 enhancers were amplified as part of gene duplication events. Importantly, among 52 ZF genes, 47 contained Krüppel-associated box (KRAB) domains, enabling us to categorize these genes as KRAB-ZF genes. KRAB-ZF proteins bind ERVs and evolved to regulate host genomes44,45, which draws an interesting coevolutionary link between KRAB-ZF genes and ERVs. Motif analyses of human enhancer-like ERVs revealed that ERV1s and ERVKs contain binding sites for A-MYB (Fig. 7c). In each family, we further identified representative types and individual loci of enhancer-like ERVs (Fig. 7d, Supplementary Data Set 5). These results suggest that, in humans, in addition to ERVKs, ERV1s act as enhancers through A-MYB-dependent mechanisms. In support of this notion, we confirmed that A-MYB is highly expressed in both mouse and human spermatocytes through immunofluorescence analyses of testis sections (Extended Data Fig. 8).
Figure. 7. Enhancer-like human ERVKs and ERV1s are associated with meiotic gene expression.
(a) Representative track view of H3K27ac ChIP-seq and RNA-seq signals in human testes and two spermatogenic cell populations: KIT+ and PS. Red and blue highlights indicate enhancer-like ERV1 and ERVK loci that overlap with H3K27ac deposition. (b) Beeswarm plots of H3K27ac enrichment on each type of ERV in the following families: ERV1, ERVK, and ERVL in human testes. Significantly enriched types of ERV elements were defined as those with values ≥1 log2 observed/expected (see Methods) and were highlighted in red circles. (c) HOMER Motif analyses of enhancer-like human ERV elements for putative transcription factor-binding sites. (d) Pie chart indicates the numbers and representative types of enhancer-like ERV loci. (e) RNA-seq analyses: Cumulative distribution plots of log2 fold changes between KIT+ and PS for the expression of genes adjacent to the following enhancer-like elements: ERV1, ERVK, and ERVL, all with respect to other expressed genes (black). *P <0.05, **P < 0.01, n.s.: not significant, Kolmogorov-Smirnov test. (f) Heatmap of sequence identity percentages for 138 human enhancer-like ERV-adjacent genes across 6 other species. Human- and primate-specific genes were significantly enriched in “enhancer-like ERV adjacent” genes in comparison to a randomly picked background set of genes (see Methods): **P < 0.001, Fisher’s exact test. (g) Phylogenetic tree and a heatmap depicting the abundance of selected enhancer-like ERV copies in respective genomes. Data for panels in b, f, g are available as source data.
Next, we sought to test the hypothesis that genes adjacent to H3K27ac-enriched ERV loci are associated with active genes after the mitosis-to-meiosis transition (i.e., active in PS compared to KIT+ spermatogonia) in humans. We found that, although genes adjacent to H3K27ac-enriched ERV1s did not manifest significant gene expression changes after the mitosis-to-meiosis transition (Fig. 7e), genes adjacent to MER57E3s were significantly activated in PS (Fig. 7e). Notably, genes adjacent to H3K27ac-enriched ERVKs tended to be associated with genes activated after the mitosis-to-meiosis transition compared to other genes in the human genome, while genes adjacent to H3K27ac-enriched ERVLs did not show such an association (Fig. 7e). These results suggest that a subset of ERVKs and ERV1s act as enhancers to activate meiotic genes in humans.
Notably, a subset of ERV-adjacent genes in humans do not have unambiguous homologs in the other mammals that we examined and may thus be specific to humans and/or primates (61/138 genes, 44.2 %; Fig. 7f). ERVs that are enhancer-like in humans are specific to the primate lineage (Fig. 7g), rather than being shared with other mammals. Together, our results support the concept that ERV-driven meiotic enhancers are a general feature of mammals, and we propose that ERV enhancers represent a general mechanism for the divergence of transcriptomes during mammalian late spermatogenesis.
Discussion
We have identified a novel function for ERVs as species-specific enhancers in the germline—a function distinct from the reported functions of ERVLs as promoters that drive lncRNA expression in spermatogenesis23. Curiously, over 15% of all oocyte transcripts start at LTR promoters that belong to the ERVL family; these ERVL promoters function during the oocyte-to-embryo transition46–49. After fertilization, ERVLs are derepressed and expressed in preimplantation embryos, an essential event in early development48,50,51. Together, our results further expand the repertoire of ERV functions, by showing that ERVs are also rapidly evolving enhancers in the germline.
For the most part, both the expression and chromatin state of TEs are reprogrammed at the mitosis-to-meiosis transition. Indeed, ERV enhancers also exhibit low levels of transcription in a meiosis-specific manner (Fig. 2g). One possible explanation is that enhancer RNA52 may be expressed at enhancer-like ERV loci. Although our analyses focus on the genes adjacent to ERV loci as targets of ERV enhancers, there are likely many more target genes because long-distance chromatin interactions were found throughout the genome in spermatogenesis25,26,53. Thus, further investigation is warranted to identify the full repertoire of genes regulated by ERV enhancers.
We have also demonstrated that ERV enhancer activation is regulated by A-MYB. Curiously, reverse orientation of two RLTR10B loci performed better in the luciferase assay compared to forward orientation. Since the orientation of enhancer-like ERVs is randomly integrated with respect to adjacent genes, parsing how enhancer-like ERVs interact with target genes in the 3D chromatin environment is an important future undertaking. In humans, A-MYB-binding sites are found in ERVKs and ERV1s. Therefore, we postulate that retrotransposition of ERVs provides new binding sites for key transcription factors, which, in turn, function as newly evolved cis regulatory elements for many genes. Importantly, we have also shown that A-MYB is associated with super-enhancers to drive the expression of key germline genes (Maezawa et al.)30. Therefore, an A-MYB-dependent mechanism appears to lie at the heart of two distinct enhancer types: (1) super-enhancers, which drive robust activation of germline genes; and (2) ERV-driven, rapidly evolving enhancers, which fine-tune the expression of species-specific germline genes. Together, these findings raise the important follow-up question of how A-MYB-binding sites on ERVs are protected from activation prior to the mitosis-to-meiosis transition. One intriguing possibility involves the function of KRAB-ZF proteins, a family of proteins that has coevolved with ERVs to suppress ERV expression, the consequence of an evolutionary arms race between ERVs and the host genome44,45.
Another important aspect of enhancer-like ERVs is species-specific gene regulation. In trophoblast stem cells, RLTR13D5, which comprises a mouse-specific ERVK type, has enhancer functions to establish a regulatory network specific to trophoblast stem cells, and the same study predicted the existence of enhancer-like ERVs in testes and embryonic stem cells34. Curiously, the placenta is known to be a fast-evolving organ in which many ERVs have been co-opted54,55. It is intriguing to speculate that ERVs are drivers of species-specific transcriptomes in rapidly evolving organs such as the testis and placenta, although mechanisms underlying intrinsic ERV activity in testes and placenta remain undetermined. Because ERV-based molecular mechanisms expose nuclei to risks of transposition and mutagenesis, their presence and, indeed, apparent importance in germline development is highly enigmatic. If KRAB-ZF proteins are involved in the control of such mechanisms, then it will be crucial to determine the crosstalk between KRAB-ZF proteins and other means of epigenetic silencing, such as DNA methylation and the piRNA pathway, to understand the precise control of both TE silencing and vital TE activities in the germline.
Methods
Animals.
Mice were maintained and used according to the guidelines of the Institutional Animal Care and Use Committee (protocol no. IACUC2018–0040) at Cincinnati Children’s Hospital Medical Center. A-mybmut/mut (Mybl1repro9) mice, which were ENU-induced on the C57BL/6J background, have been previously reported36,37. Through mating between male and female A-mybmut/+ heterozygotes,36,37. A-mybmut/mut male mice were born at expected ratios according to Mendel’s Law. For the genotyping of A-mybmut/mut mice, PCR was carried out using specific primer sets36 (Supplementary Data Set 6).
Methods for the design of sgRNAs and the production of animals have been described previously56. In short, we targeted each side of the Zfy2-associated ERV with two chemically modified sgRNAs (IDT) according to on- and off-target scores generated via the web tool CRISPOR (http://crispor.tefor.net)57.57. The target sequences are AAAGTTGAACATGTTCCGGG and AATAGACTTGGACTATCCTG for the upstream sites, and CCTAGTCCTACCCAAAAACA and TTTGCCATGAGTGAGCTACT for the downstream sites. To form ribonucleoprotein complexes (RNPs), sgRNAs (25 ng/μL each) were mixed with Cas9 protein (IDT; 200 ng/μL) in Opti-MEM (ThermoFisher) and incubated at 37°C for 15 min. Zygotes from superovulated female mice on the C57BL/6 genetic background were electroporated with 7.5 μL of RNPs on ice using a Genome Editor electroporator (BEX; 30V, 1-ms width, 5 pulses with 1-s intervals). Two minutes after electroporation, zygotes were moved into 500 μL cold M2 medium (Sigma), warmed to room temperature, and then transferred into the oviductal ampulla of pseudopregnant CD-1 females. Pups were born and genotyped by PCR and Sanger sequencing. Animals were housed in a controlled environment with a 12-h light/12-h dark cycle, with free access to water and a standard chow diet. All animal procedures were carried out in accordance with the Institutional Animal Care and Use Committee-approved protocol of Cincinnati Children’s Hospital Medical Center.
Cell lines.
Wild-type J1 male embryonic stem cells (henceforth “ES cells”) derived from male agouti 129S4/SvJae embryos have been described previously58. Human HEK293T cells were obtained from ATCC (CRL-11268). CRISPRa ES cell and RLTR10B2-targeting CRISPRa ES cell lines have been generated in this study. Since these cells were easily distinguished based on colony morphologies, cell lines have been authenticated by microscopic inspection. CRISPRa ES cells and RLTR10B2-targeting CRISPRa ES cells were further authenticated by genotyping using specific primer sets (Supplementary Data Set 6). None of the cell lines have been tested for mycoplasma contamination.
Cell culture.
ES cells were cultured in ESC media (15% FBS, 25 mM HEPES, 1× GlutaMAX, 1× MEM Non-essential Amino Acids Solution, 1× Penicillin/Streptomycin, and 0.055 mM β-Mercaptoethanol in DMEM High Glucose (4.5 g/L)) containing 2i (1 μM PD0325901, LC Laboratories; and 3μM CHIR99021, LC Laboratories) and LIF (1300 U/mL, in-house) on cell culture plates coated with 0.2% gelatin under feeder-free conditions. HEK293T cells (CRL-11268, ATCC) were cultured in DMEM High Glucose supplemented with solution (10% FBS, 1× Penicillin/Streptomycin, 1 mM sodium pyruvate, 1× MEM Non-essential Amino Acids Solution, and 1× GlutaMAX) on cell culture plates. The expanded ES colonies and confluent HEK293T cells were dissociated using 0.25% trypsin-EDTA solution for passaging.
Generation of CRISPRa ES cell lines.
To generate stable ES cell lines expressing dCas9-VPR proteins in the presence of doxycycline (Dox), we used Lipofectamine 3000 Transfection Reagent (Thermo Fisher) to transfect approximately 5×10⁵ cells in each well of a six-well plate with 1.8 μg of dCas9-VPR PiggyBac expression vector (PB-TRE-dCas9-VPR, #63800, Addgene59) and 800 ng of pCyL43 transposase vector60. Then, we allowed cell colonies to expand for 2 days in ESC media containing 2i and LIF. Following transfection, cells were seeded onto a 100 mm dish coated with 0.2% gelatin. We selected for dCas9-VPR integrant-containing cells through exposure to of 200 μg/mL hygromycin B Gold (InvivoGen) for 10 days. Isolated individual ES colonies were screened by genomic PCR using a specific primer set (Supplementary Data Set 6). To determine an optimal clone with the highest expression level of dCas9-VPR upon addition of 1 μg/mL Dox, mRNA levels of dCas9-VPR in respective clones were validated by RT-qPCR using specific a primer set following 24 h of Dox induction (Extended Data Fig. 5a).
CRISPRa: RLTR10B2 consensus sequence.
To generate RLTR10B2-targeting CRISPRa ES cell lines, we designed five single guide RNAs (sgRNAs) that target interspersed genomic RLTR10B2 loci using CRISPOR (http://crispor.tefor.net/; Supplementary Data Set 6). We subcloned individual annealed sgRNA sequences into pX459 plasmids. For subsequent steps, a transcriptional unit of each gRNA vector was amplified by PCR using a specific primer set containing 20 nucleotides of homologous sequence at the 5’ end of the reverse and forward primers (Supplementary Data Set 6). Individual transcriptional units were assembled into one fragment via the NEBuilder HiFi DNA Assembly Cloning Kit (NEB). An assembled 5×RLTR10B2 targeting sgRNA array was inserted among the BstBI and BsaBI recognition sites of the pLV-U6-gRNA-UbC-DsRed-P2A-Bsr plasmid (#83919, Addgene).
We generated sgRNA lentiviral particles by transfecting HEK293T cells with the following plasmids and vectors: constructed RLTR10B2-targeting sgRNA expression plasmid (with DsRed reporter and blasticidin S resistance genes), psPAX2 (#12260, Addgene) packaging vector, and pMD2.G (#12259, Addgene) viral envelope expressing vector. The transfection was done at a ratio of 0.377 (sgRNA plasmid) : 0.377 (psPAX2 vector) : 0.247 (pMD2.G vector) using Transfection Reagent (Thermo Fisher). After 24 h of transfection, cells were treated with 10 μM forskolin (#F3917, Sigma-Aldrich). Viral supernatants were collected 48 h following forskolin treatment and concentrated via Lenti-X Concentrator (#631231, Clontech). The virus titer was measured by the Lenti-X GoStix Plus (#631280, Clontech) and then stored at −80°C.
One day before transduction, 1×10⁶ CRISPRa ES cells were seeded onto a 60 mm dish coated with 0.2% gelatin. For the viral infection of CRISPRa ES cells, concentrated sgRNA lentiviral particles (≥9×10⁶ IFU) were used with 8 μg/mL of polybrane (TR-1003-G, Millipore) and 1/100 diluted ViralPlus Transduction Enhancer (G698, abm). Following transduction, cells were allowed to expand for 4 days in ESC media with 2i and LIF. To enrich samples for DsRed-positive cells, cells were sorted with a FACS instrument (SH800S Cell Sorter, SONY; a 100-μm microfluidic sorting chip was used) 4 days after selection in ESC media containing 2i, LIF, 200 μg/mL hygromycin B Gold (InvivoGen), and 20 μg/mL blasticidin S (Gibco). We termed the newly established cell line “RLTR10B2-targeting CRISPRa ES cells.” The cell line was maintained in ESC media containing 2i, LIF, 200 μg/mL hygromycin B Gold (InvivoGen), and 20 μg/mL blasticidin S (Gibco).
To evaluate the roles of enhancer-like ERVs in the expression of adjacent genes, we seeded 2×10⁵ RLTR10B2-targeting CRISPRa ES cells into each well of a 24-well plate. The wells were coated with 0.2% gelatin and contained ESC media supplemented with 2i and LIF. The following day, we replaced the above ESC media with ESC media supplemented with 1 μg/mL Dox. After 24 h of Dox-induction, we transfected the cells with 500 ng of A-MYB expression vector (PGK-A-MYB plasmid) using Lipofectamine 3000 Transfection Reagent (Thermo Fisher); we followed the manufacturer’s instructions. At day 3, the adherent cells in each well were lysed for RNA extraction.
CRISPRa: a representative enhancer-like ERV locus.
To perform functional evaluations of a representative enhancer-like ERV locus (Tdrd3-ERVe) via CRISPR activation (CRISPRa), we used CRISPOR (http://crispor.tefor.net/) to design 2 gRNAs for the the loci of regions flanking Tdrd3-ERVe A-MYB peaks. The gRNAs were synthesized as TrueGuide Modified Synthetic sgRNA (Thermo Fisher; Supplementary Data Set 6). One day before transfection, 2×10⁵ CRISPRa ES cells were seeded into each well of a 24-well plate coated with 0.2% gelatin. At day 1, transient transfections were performed with Lipofectamine RNAiMAX Transfection Reagent (Thermo Fisher) following the manufacturer’s instructions. 240 ng of equimolar pooled sgRNA was used. At day 2, 500 ng of A-MYB expression vector (PGK-A-MYB plasmid) was transfected with Lipofectamine 3000 Transfection Reagent (Thermo Fisher) following the manufacturer’s instructions. Using ESC media without 2i and LIF, and containing hygromycin B Gold with or without 1 μg/mL Dox, the cell culturing media was changed every day following one wash with PBS. At day 4, the adherent cells in each well were lysed for RNA extraction.
RNA extraction and RT-qPCR.
Total RNA was isolated using an RNeasy Plus Mini Kit (Qiagen). First-strand cDNA synthesis was performed using 200 ng of total RNA with the SuperScript IV Reverse Transcriptase and oligo-dT (20) primer (Thermo Fisher) according to the manufacturer’s instructions. Real-time PCR was performed using a StepOnePlus Real-Time PCR System (Applied Biosystems) with Fast SYBR Green Master Mix (Thermo Fisher) and specific primer sets (Supplementary Data Set 6). Relative gene expression was quantified with the ΔΔCT method and normalized to Hprt expression.
RNA-seq.
We extracted total RNA from the ES cells in each well of a 24-well plate using an RNeasy Plus Mini Kit (Qiagen) with genomic DNA elimination. RNA-seq library preparation was carried out using a TruSeq Stranded mRNA Library Prep Kit (Illumina) following the manufacturer’s instructions. Indexed libraries were pooled and sequenced using an Illumina Novaseq-6000 sequencer (paired-end, 100 bp). Two independent biological replicates were generated for each sample.
Dual-luciferase reporter assays.
We performed dual-luciferase reporter assays in which the activity of regulatory elements was indicated by the expression of NanoLuc luciferase (Nluc). Nluc was driven by a minimal promoter and normalized to the expression of control firefly luciferase (Fluc), in turn driven by a PGK promoter. For the construction of A-MYB expression vectors, the full-length of a PGK promoter sequence was amplified via PCR using KOD Xtream Hot Start DNA Polymerase (Sigma-Aldrich) and a specific primer set containing BsrGI and AsiSI recognition sites at the 5’ ends (Supplementary Data Set 6). The PCR product was inserted between BsrGI and AsiSI recognition sites of MG225161 plasmid (OriGene), which bears the complete cDNA sequence for A-MYB (NM_008651). To construct pNL3.2 reporter, DNA fragments in both orientations of two representative enhancer-like ERV loci (chr7: 80,859,529–80,859,805, RLTR10B; chr2:178,108,775–178,109,158, RLTR10B) were synthesized as regulatory elements (REs) by Synbio Technologies (Supplementary Data Set 6). Synthesized RE fragments were amplified via PCR using KOD Xtream Hot Start DNA Polymerase (Sigma-Aldrich) and a specific primer set (Supplementary Data Set 6). PCR products were inserted between the NheI and HindIII recognition sites of pNL3.2[NlucP/minP] plasmid (Promega).
To measure the activity of the above-prepared REs, we used the Nano-Glo Dual-Luciferase Reporter Assay System (Promega). 5×10⁴ HEK293T cells were seeded into each well of a tissue culture-treated 96-well solid white polystyrene microplate (Corning) 1 day before transfection. Transient transfections were performed with Lipofectamine 3000 Transfection Reagent (Thermo Fisher) following the manufacturer’s instructions. The cells in each well were co-transfected with the following: 30 ng of pGL3.54 (Promega), a transfection control reporter; 30 ng of pNL3.2 with or without the REs, an experimental reporter; and 40 ng of A-MYB expression vector (MG225161 or PGK-A-MYB plasmids). Three replicates were used for each condition. After 48 h of transfection, dual-luciferase assays were performed according to the manufacturer’s instructions (Promega). Luciferase activity in each well was measured using a Synergy H1 Hybrid Multi-Mode Microplate Reader (BioTek) with a 1-s integration time.
Native ChIP and sequencing.
For native ChIP-seq (chromatin immunoprecipitation sequencing) of pachytene spermatocytes (PS) from wild-type and A-myb mutant testes, we prepared testicular cell suspensions from single male mice aged 8–12 weeks. We isolated A-myb mutant PS using the small-scale STA-PUT method as described in our previous report29. Briefly, a pair of testes from one mouse, wild-type or mutant, underwent digestion by treatments with collagenase, trypsin, and DNase I. The cells were isolated and suspended in Krebs-Ringer Bicarbonate Buffer containing 0.5% BSA, and the suspension was loaded into a gradient of Krebs-Ringer Bicarbonate Buffer containing 2% and 4% BSA; the gradient was generated through the use of a gradient maker (VWR; GM-100). The cell suspension was allowed to settle for 3 h at 4°C before fractions were collected. Purity was confirmed by nuclear staining of a sample aliquot of each collected fraction with Hoechst 33342 via fluorescence microscopy. Greater than 90% purity was confirmed for each purification. To collect wild-type PS, we used an optimized quick sorting method. After preparing testicular cell suspensions, cells were stained with Vybrant DyeCycler Violet Stain (DCV, Thermo Fisher) for 30 min at 35°C (2 μl DCV per 2×10⁷ cells). DCV staining patterns for testis cell types were detected and sorted via flow cytometry (SH800S Cell Sorter, SONY; a 100-μm microfluidic sorting chip was used). Approximately 5–7.5×10⁴ cells were used for one native ChIP-seq experiment.
The protocol for native ChIP was adapted from a previous report40 with minor modifications. Briefly, isolated PS were suspended in 20 μL of Nuclei EZ Lysis Buffer (Sigma-Aldrich) and digested chromatin with 2 IU/μL Micrococcal Nuclease (MNase, NEB) at 37°C for 5 min. The MNase reaction was halted with the addition of 10%-volume 100 mM EDTA. Chromatin was completely solubilized with the addition of 10%-volume detergent solution (1% TritonX-100 and 1% sodium deoxycholate) with gentle inversion at 4°C for 1 h. After the solubilization of chromatin, 10% of total chromatin was removed for use as an input control. The chromatin immunoprecipitation reaction was performed using 1 μg of rabbit anti-H3K27ac polyclonal antibody (ab4729, Abcam) conjugated with Dynabeads Protein A/G (1:1) magnetic beads (Life Technologies) overnight at 4°C with gentle inversion and agitation. To remove non-specific binding interactions, magnetic beads bound to antibody-chromatin complexes were washed 3 times with a low salt wash buffer (150 mM NaCl) and then 2 times with a high salt buffer (500 mM NaCl). The chromatin was eluted from magnetic beads through resuspension in ChIP Elution Buffer (100 mM NaHCO3 and 1% sodium dodecyl sulfate in ddH2O) shook at 65°C for 1 h. Immunoprecipitated DNA was isolated and purified by phenol-chloroform extraction and ethanol precipitation.
ChIP-seq library preparation was carried out using a NEBNext Ultra II DNA Library Prep Kit (NEB) following the manufacturer’s instructions. Indexed libraries were pooled and sequenced using an Illumina NextSeq 500 sequencer (paired-end, 150 bp). Two independent biological replicates were generated for each sample.
RNA-seq analyses.
Raw RNA-seq reads were aligned to either the mouse (GRCm38/mm10) or human (GRCh38/hg38) genomes using HISAT261 (version 2.1.0), and uniquely aligned reads were extracted by calling grep with the -v option. To quantify uniquely aligned reads on respective annotated transcript loci (NCBI RefSeq transcripts), we used the htseq-count function, part of the HTSeq package62, with or without -s reverse argument. The RPKM expression levels for each transcript were calculated using StringTie63 (version 1.3.4).
To understand the dynamics of repetitive element expression in spermatogenesis, we analyzed previously published RNA-seq datasets for representative stages of spermatogenesis7,8,28. We analyzed the transcriptomes of THY1+ undifferentiated spermatogonia from postnatal day 7 (P7) testes, which contain spermatogonial stem cells and progenitor cells; KIT+ differentiating spermatogonia from P7 testes; pachytene spermatocytes (PS) in the midst of meiosis; and postmeiotic round spermatids (RS) from adult testes7,8,28. Repetitive annotation in mm10 genome (mm10.fa.out, open-4.0.5, GRCm38/mm10) was downloaded from the RepeatMasker website (http://www.repeatmasker.org/species/mm.html). TE annotation in this file does not include overlapping. To prepare the “best match” TE annotation set, TE copies which overlapped with exonic regions of a gene annotation set or had low Smith-Waterman (SW) scores (≤ 500 for SINE and DNA transposons, and ≤ 1,000 for other transposons) were removed using BEDTools64 (version 2.26.0) intersect function and custom Python scripts. To prepare the gene annotation set, mouse gene annotation (gencode.vM24.annotation.gtf, GRCm38/mm10) was downloaded from the GENCODE website (https://www.gencodegenes.org/mouse/). We removed transcripts with a flag ‘retained_intron’ from the GENCODE gene annotations and used them as the gene annotation set. Then, format of best match TE annotation set was converted to GTF and termed “best_match_mm10_TE_annotaion_set.gtf” (N = 1,755,061 loci, Figure 1b).
Raw single-end RNA-seq reads in each spermatogenic stage were aligned to indexed mouse genome (GRCm38/mm10) using STAR aligner version 2.5.3a with --outFilterMultimapNmax 1 and --sjdbGTFfile ./best_match_mm10_TE_annotaion_set.gtf options for unique alignments. Short reads of repetitive element RNAs could potentially be mapped to multiple loci bearing homologous elements; to ensure interpretability of our results at the individual locus level, we counted only uniquely-mapping RNA-seq reads. To quantify uniquely aligned reads on respective TE loci, we used the htseq-count function, part of the HTSeq package65 with best_match_mm10_TE_annotaion_set.gtf annotation. After quantification, unexpressed TE copies through spermatogenesis (< Raw read count: 2) were removed, and values of count per million (CPM) were calculated by dividing raw aligned reads by total uniquely aligned reads. To detect differentially expressed TE copy between two biological samples, a read count output file was input to the DESeq2 package65 (version 1.16.1); then, the program functions DESeqDataSetFromMatrix and DESeq were used to compare each TE copy’s expression level between two biological samples. Differentially expressed TE copies were identified through two criteria: (1) ≥2-fold change and (2) ≥ baseMean 2 in two stages, which are compared. A custom Python script was used for the detection of adjacent RefSeq genes to differentially expressed TE copies between two biological samples. We generated scatter plots using the R ggplot2 package to visualize the expression patterns of TE copies.
To detect differentially expressed RefSeq genes between two biological samples, a read count output file was input to the DESeq2 package65 (version 1.16.1); then, the program functions DESeqDataSetFromMatrix and DESeq were used to compare each gene’s expression level between two biological samples. Differentially expressed genes were identified through two criteria: (1) ≥2-fold change and (2) binominal tests (P adj < 0.01; P values were adjusted for multiple testing using the Benjamini-Hochberg method). The 5,461 genes specifically activated in the mitosis-to-meiosis transition were defined through differential expression analyses of THY1+ spermatogonia and PS based on three parameters: (1) a fold change in gene expression of ≥2, (2) statistical significance determined using a Wald test adjusted with a Benjamini-Hochberg false discovery rate of <0.05, and (3) PS expression levels of ≥2 RPKM.
To perform gene ontology analyses, we used the functional annotation clustering tool in DAVID 66 (version 6.8), and we applied a background of all mouse genes. Biological process term groups with a significance of P < 0.05 from a modified Fisher’s exact test were considered significant. Further analyses were performed with R (version 3.4.0) and visualized as heatmaps using Morpheus (https://software.broadinstitute.org/morpheus, Broad Institute).
To visualize read enrichments over representative genomic loci, TDF files were created from sorted BAM files using the IGVTools count function67 (Broad Institute). Figures of continuous tag counts over selected genomic intervals were created in the IGV browser67 (Broad Institute).
ATAC- and ChIP-seq analyses.
Raw ATAC- and ChIP-seq reads were aligned to either the mouse (GRCm38/mm10) or human (GRCh38/hg38) genomes using bowtie2 (version 2.3.3.1) with default settings68; the reads were filtered to remove alignments mapped to multiple locations by calling grep with the -v option. Using SeqMonk (Barbraham Bioinformatics), we calculated Pearson correlation coefficients between 1-kb bins of biological replicates. Peak calling for ATAC- and ChIP-seq data was performed using MACS (version 1.4.2) with default arguments69; we used a cut-off of P ≤ 10-5. We normalized aligned ChIP-seq reads in enhancer-like ERV loci to RPKM, and relative ChIP-seq enrichments were calculated by dividing ChIP enrichment by input enrichment.
To detect enhancer-like ERVs, we obtained RepeatMasker track annotations (GRCm38/mm10) from the UCSC Genome Browser (genome.ucsc.edu). First, to identify accessible ERV loci in the PS stage, we determined overrepresented ERV families through comparisons of the observed copy numbers of ERV families overlapping MACS-defined ATAC-seq peak regions versus the expected background. The expected background was estimated by randomly generating and calculating numbers of background genomic regions equal to the numbers of ATAC-seq peak regions. We computed the numbers of overlapping ERV copies within ATAC-seq peak regions (observed) and background genomic prevalence (expected) using custom shell scripts that call the BEDTools64 (version 2.26.0) function intersect. Specific types of ERVs evincing ≥2-fold observed/expected enrichment (P < 0.05, binominal test) were defined as “accessible ERVs” in PS (Fig. 2a, b). Accessible ERVs in PS were further filtered to require ≥1.5 H3K27ac ChIP-seq enrichment relative to input control and defined as “Meiosis-specific enhancer-like ERVs” (n = 1,122; Fig. 2c, Supplementary Data Set 2). The program ngs. plot70 was used to draw tag density plots and heatmaps for read enrichment (H3K27ac, H3K4me3, and H3K27me3 ChIP-seq reads, and RNA-seq reads) within ±5 kb of identified enhancer-like ERVs. To detect genes adjacent to enhancer-like ERVs, we used the HOMER71 (version 4.9) function annotatePeaks.pl. To perform functional annotation enrichment of enhancer-like ERVs, we used GREAT tools72). To identify the enrichment of known motifs within enhancer-like ERV loci in mice and humans, we used the HOMER71 (version 4.9) function findMotifsGenome.pl with default parameters and a fragment size denoted by the argument -gain. To visualize read enrichment over representative genomic loci, TDF files were created from sorted BAM files using the IGVTools count function67 (Broad Institute). Figures for continuous tag counts over selected genomic intervals were created in the IGV browser67 (Broad Institute). To identify human enhancer-like ERVs in spermatogenesis, the same method was performed with RepeatMasker tracks (GRCh38/hg38) and human testis H3K27ac ChIP-seq data (Fig. 7, Supplementary Data Set 5).
Evaluation of sequence similarities across mammalian species.
We sought to calculate sequence similarities and detect orthologous genes adjacent to mouse and human enhancer-like ERVs across the following mammalian species: rat, rabbit, marmoset, gorilla, and chimpanzee. To do so, we applied a list of mouse and human ERV-adjacent genes to BioMart73 to compute sequence similarities, i.e., percent identities of target genes in other species in comparison to respective mouse query genes. To determine the statistical significance of species-specific gene enrichment amid a superset of ERV-adjacent genes, we performed Fisher’s exact tests on observed species-specific gene enrichment versus expected background—which was estimated by randomly generating and analyzing numbers of background genes equal to the numbers of observed genes—and computed sequence similarities across the species. For these analyses, we made use of NCBI RefSeq genes.
Histology and immunofluorescence analyses.
Wild-type C57BL/6J male mice (three independent mice, at 90–120 days of age) were used for the immunofluorescence analysis and histological analysis. To prepare testicular paraffin blocks, testes were fixed with 4% paraformaldehyde (PFA) overnight at 4°C. Testes were dehydrated and embedded in paraffin. For histological analyses, 5 μm-thick paraffin sections were deparaffinized and autoclaved in target retrieval solution (DAKO) for 10 min at 121°C. Sections were blocked with Blocking One Histo (Nacalai) for 1 h at room temperature and then incubated with anti-γH2AX (05–636-AF647, Millipore) and anti-MYBL1 (A-MYB; NBP1–90171, Novus Biologicals) primary antibodies overnight at 4°C. The resulting signals were detected by incubation with secondary antibodies conjugated to fluorophores (Thermo Fisher Scientific, Biotium, or Jackson ImmunoResearch). Sections were counterstained with DAPI. Images were obtained with a TiE fluorescence microscope (Nikon) and processed with NIS-Elements (Nikon) and ImageJ (National Institutes of Health)74.
Statistics.
Statistical methods and p values for each plot are listed in the figure legends and/or in the corresponding Methods sections. In brief, all grouped data are represented as mean±s.e.m. All box-and-whisker plots are represented as: center lines, median; box limits, interquartile range (25 and 75 percentiles); whiskers, >90% of the data points, unless stated otherwise. Statistical significances for pairwise comparisons were determined using the two-sided Mann-Whitney U tests, Kolmogorov-Smirnov tests, unpaired t-tests, and Chi-square tests with Yates’s correction. All quantitative analyses, excluding Extended Data Figure 5a, are represented as the mean±s.e.m. of three-to-four biological replicates. Fisher’s exact test and hypergeometric test were used for the detection of significantly enriched GO terms, genes, and loci compared with backgrounds. Differentially expressed genes and TE copies were determined in the DESeq2 package. Next-generation sequencing data (RNA-seq, ATAC-seq, and ChIP-seq) are based on two independent replicates. For all experiments, no statistical methods were used to predetermine sample size. Experiments were not randomized, and investigators were not blinded to allocation during experiments and outcome assessments.
Extended Data
Extended Data Fig. 1. Analysis of repetitive element expression during mouse spermatogenesis.
(a) The RNA-seq pipeline for comprehensive quantification of TE copies. The flowchart indicates the various RNA-seq and data analysis processes that comprise the pipeline. Round-corner rectangles, input files; rectangles, output files; diamond, branch condition. The specific tools used are highlighted in red. (b) The proportion of expressed and unexpressed copies of repetitive elements in each class during spermatogenesis. Of note, nearly half of rRNA genes are expressed in spermatogenic differentiation following the KIT+spermatogonia stage.
Extended Data Fig. 2. ATAC-seq read enrichment at representative enhancer-like ERV loci and 5,000 randomly selected repetitive element loci.
(a) Heatmap depicts RPKM-normalized ATAC-seq reads at enhancer-like RLTR10 and RMER17 loci (n = 694), and 5,000 randomly selected repetitive element loci in representative stages of spermatogenesis. (b) Top: Venn diagram shows the intersection between total copy numbers of MMERVK10C loci (green) and total copy numbers of all RLTR10C loci (pink). Bottom: Venn diagram shows the intersection between total copy numbers of MMERVK10C loci (green) and total copy numbers of enhancer-like RLTR10C loci (red).
Extended Data Fig. 3. H3K4me3 enrichment at enhancer-like ERVs loci.
(a) Average tag density plots and heatmaps show H3K27ac and H3K4me3 enrichments around enhancer-like ERVs (±1 kb around ±5 kb of ERVs) in PS. (b) Scatter plot depicts H3K4me3 enrichments at enhancer-like ERV loci in PS. X-axis indicates relative distance of enhancer-like ERV loci from TSS of nearest genes. Y-axis indicates relative H3K4me3 enrichments at individual enhancer-like ERV loci. Red line shows a regression line.
Extended Data Fig. 4. The genomic features of enhancer-like ERVs in meiosis.
(a) Representative track views show H3K27ac ChIP-seq, ATAC-seq, RNA-seq, and A-MYB ChIP-seq signals on chromosome X. The red highlight indicates an enhancer-like ERV locus. (b) Pie charts indicate the distributions of enhancer-like ERVs on autosomes and sex chromosome. (c) Top: Bar chart depicts the numbers of enhancer-like ERVs on each chromosome. Bottom: Chromosome map shows the distribution of enhancer-like ERVs throughout the mouse genome. Values for H3K27ac enrichment represent log2 fold enrichment of H3K27ac signal relative to input. (d) Box-and-whisker plots show relative H3K27ac enrichment at enhancer-like ERV loci on autosomes and sex chromosomes. Values: log2 fold enrichment of H3K27ac signal relative to input. Central bars represent medians, the boxes encompass 50% of the data points, and the error bars indicate 90% of the data points. We detected no statistical difference in H3K27ac enrichment at autosome enhancer-like ERVs vs. sex chromosome enhancer-like ERVs: P = 0.307, Mann-Whitney U test. (e) Bar chart shows enhancer-like ERVs distribution across genomic entities (intergenic, intronic, etc.) in autosomes versus the sex chromosomes: P = 3.6 × 10⁻⁵, Chi-square test with Yates’s correction. (f) The consensus sequence of RLTR10B, listed in the Dfam database, contains two A-MYB binding motifs (GGCAGTT).
Extended Data Fig. 5. The generation of CRISPRa embryonic stem cell lines, and the evaluation of CRISPR-deletion mice.
(a) qRT-PCR analyses of CRISPRa embryonic stem (ES) cells show expression level changes of the dCas9-VPR transgene 24 h after doxycycline (Dox) induction. Expression levels were normalized to the endogenous housekeeping gene Hprt. Upon addition of Dox, all ES cell clones evinced overt dCas9-VPR mRNA expression. Because clone #6 exhibited the highest upregulation of dCas9-VPR transcript, we restricted further experiments to clone #6. (b) Representative image of CRISPRa ES cell colonies at day 4 after transduction with the sgRNA lentiviral construct. We validated the degree of sgRNA expression through observations of the red fluorescent reporter protein DsRed. Scale bar, 200 μm. (c) Testis sections from wild-type (WT; left) and Zfy2 enhancer-deletion mice (right) at postnatal day 28 (P28). The sections were stained with hematoxylin and eosin. Scale bars, 100 μm. In our observations of Zfy2 enhancer-deletion samples, we noted no gross changes to testis morphology; however, we observed multinucleated cells (arrowheads).
Extended Data Fig. 6. The synteny of mouse meiosis-specific enhancer-like ERVs in rats and other placental mammals.
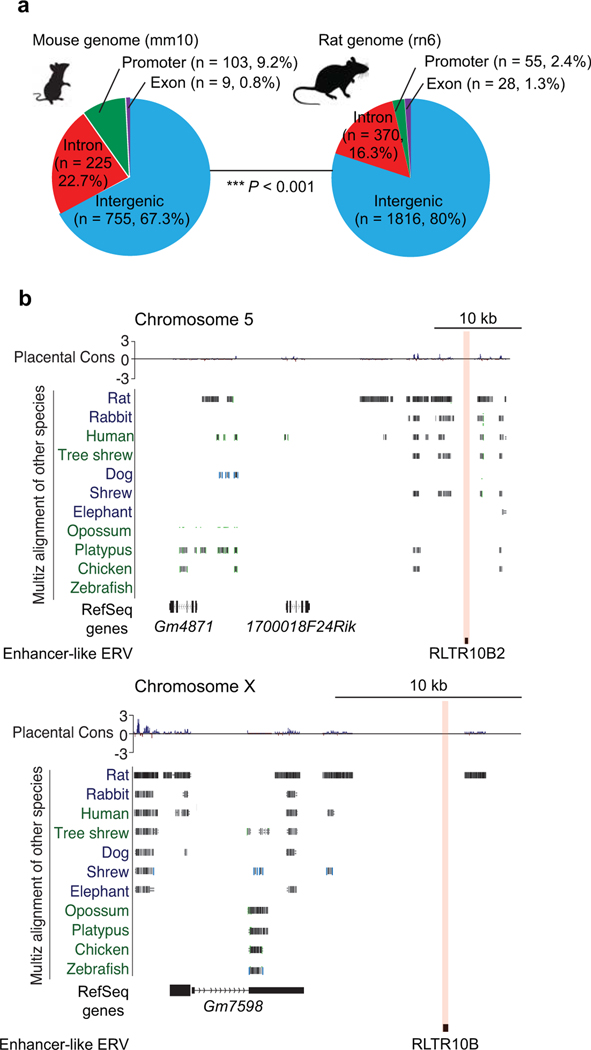
(a) Pie charts indicate the genomic distribution of enhancer-like ERVs in the following genomes: mouse (mm10) and rat (rn6). Between the two species, genomic feature enrichment statistically differs: *** P < 0.001, Chi-square test with Yates’s correction. (b) Representative track views show evolutionary conservation in regions adjacent to enhancer-like ERVs across several placental mammals. Red highlights indicate enhancer-like ERV loci; such loci exhibit low levels of conservation across placental mammals, including rats, a species closely related to mice.
Extended Data Fig. 7. MER57E3 is enriched in KRAB-ZF-encoding genes that have rapidly evolved in primates or humans.
(a) Representative track views show H3K27ac ChIP-seq enrichment for whole, adult human testis tissue and RNA-seq signal in human KIT+ and PS. Red highlights indicate enhancer-like MER57E3s that overlap high levels of H3K27ac deposition. (b) Pie charts indicate the genomic distribution of enhancer-like MER57E3 loci in the human genome (hg38). Most enhancer-like MER57E3s are located within the first intronic regions of KRAB-ZF-encoding genes.
Extended Data Fig. 8. A-MYB is highly expressed in both mouse and human spermatocytes.
(a) Testis sections from mice at 12 weeks of age immunostained with antibodies raised against A-MYB (red) and γH2AX (green), and counterstained with DAPI (gray). The Roman numerals indicate stages of the seminiferous epithelium cycle. Scale bars, 20 μm. (b) Representative testis sections from humans at 29-to-65 years of age immunohistochemically stained with an antibody raised against A-MYB (brown), counterstained with hematoxylin. Images of human testis sections were sourced and adapted from the Human Protein Atlas (www.proteinatlas.org/ENSG00000185697-MYBL1/tissue/testis). Scale bars, 20 μm.
Supplementary Material
Acknowledgements
We thank M. Weirauch and members of the Namekawa laboratory for discussion and helpful comments regarding the manuscript; the CCHMC Research Flow Cytometry Core for sharing FACS equipment, which is supported by NIH S10OD023410; X. Li at the University of Rochester Medical Center for sharing A-myb mutant mice; the laboratory of B. Bernstein at Massachusetts General Hospital for providing human testis H3K27ac ChIP-seq data (ENCSR136ZQZ, ENCODE); and the Transgenic Animal and Genome Editing Core at CCHMC for generating the Zfy2 enhancer-deletion mice. Funding sources: Lalor Foundation Postdoctoral Fellowship and JSPS Overseas Research Fellowship to A.S.; the Research Project Grant by the Azabu University Research Services Division, Ministry of Education, Culture, Sports, Science and Technology (MEXT)-Supported Program for the Private University Research Branding Project (2016–2019), Grant-in-Aid for Research Activity Start-up (19K21196), and the Uehara Memorial Foundation Research Incentive Grant (2018) to S.M.; Albert J. Ryan Fellowship to K.G.A.; National Institute of Health (NIH) DP2 GM119134 to A.B.; March of Dimes Prematurity Research Centre Collaborative Grant (#22-FY14–470) to M.P.; and NIH R01 GM122776 to S.H.N.
Footnotes
Code availability. Source code for all software and tools used in this study with documentation, examples and additional information, is available at following URLs:
・https://github.com/GenomeImmunobiology/Sakashita_et_al_2020 (best-match TE annotation set)
・https://github.com/alexdobin/STAR (STAR RNA-seq aligner)
・http://crispor.tefor.net (CRISPOR)
・http://daehwankimlab.github.io/hisat2 (HISAT2)
・https://ccb.jhu.edu/software/stringtie (StringTie)
・https://htseq.readthedocs.io/en/master (HTSeq)
・https://bedtools.readthedocs.io/en/latest/content/installation.html (BEDTools)
・https://bioconductor.org/packages/release/bioc/html/DESeq2.html (DESeq2)
・https://david.ncifcrf.gov/summary.jsp (DAVID)
・https://software.broadinstitute.org/morpheus (Morpheus)
・https://software.broadinstitute.org/software/igv/igvtools (IGVTools)
・http://bowtie-bio.sourceforge.net/bowtie2 (bowtie2)
・https://www.bioinformatics.babraham.ac.uk/projects/seqmonk (SeqMonk)
・https://github.com/taoliu/MACS (MACS)
・https://github.com/shenlab-sinai/ngsplot (ngsplot)
・https://rdrr.io/cran/gplots (gplots)
・https://github.com/tidyverse/ggplot2 (ggplot2)
・https://cran.r-project.org/web/packages/chromoMap/vignettes/chromoMap.html#install-chromomap (chromoMap)
・http://homer.ucsd.edu/homer (HOMER)
・http://great.stanford.edu/public/html (GREAT)
・https://useast.ensembl.org/info/data/biomart/index.html (BioMart)
・https://imagej.net/Fiji/Downloads (Fiji — ImageJ)
・https://systems.crump.ucla.edu/hypergeometric/ (Hypergeometric p-value calculator)
Reporting Summary. Further information on research design is available in the Nature Research Reporting Summary linked to this article.
Data availability
H3K27ac ChIP-seq data reported in this study are described in the accompanying study (Maezawa et al.)30 and deposited to the Gene Expression Omnibus (GEO) under the accession number GSE130652. H3K27ac native ChIP-seq data in WT and A-myb mutant PS are deposited under the accession number GSE142173. All other next-generation sequencing datasets used in this study are publicly available and referenced in Supplementary Data Set 77,9,24,28,37,43,75–80.
Source data for Figs. 1c,d,e,f,g,2a,b,e,3c,e,4b,e,f,5a,d,f,g,6a,b,7b,f,g are available with the paper online.
Competing Interest Statement
A.B. is a cofounder of Datirium, LLC.
References
- 1.Ramskold D, Wang ET, Burge CB & Sandberg R. An abundance of ubiquitously expressed genes revealed by tissue transcriptome sequence data. PLoS Comput Biol 5, e1000598 (2009). [DOI] [PMC free article] [PubMed] [Google Scholar]
- 2.Brawand D. et al. The evolution of gene expression levels in mammalian organs. Nature 478, 343–8 (2011). [DOI] [PubMed] [Google Scholar]
- 3.Soumillon M. et al. Cellular source and mechanisms of high transcriptome complexity in the mammalian testis. Cell Rep 3, 2179–90 (2013). [DOI] [PubMed] [Google Scholar]
- 4.Lambert SA et al. The Human Transcription Factors. Cell 172, 650–665 (2018). [DOI] [PubMed] [Google Scholar]
- 5.Shima JE, McLean DJ, McCarrey JR & Griswold MD The murine testicular transcriptome: characterizing gene expression in the testis during the progression of spermatogenesis. Biol Reprod 71, 319–30 (2004). [DOI] [PubMed] [Google Scholar]
- 6.Namekawa SH et al. Postmeiotic sex chromatin in the male germline of mice. Curr Biol 16, 660–7 (2006). [DOI] [PubMed] [Google Scholar]
- 7.Hasegawa K. et al. SCML2 Establishes the Male Germline Epigenome through Regulation of Histone H2A Ubiquitination. Dev Cell 32, 574–88 (2015). [DOI] [PMC free article] [PubMed] [Google Scholar]
- 8.Sin HS, Kartashov AV, Hasegawa K, Barski A. & Namekawa SH Poised chromatin and bivalent domains facilitate the mitosis-to-meiosis transition in the male germline. BMC Biol 13, 53 (2015). [DOI] [PMC free article] [PubMed] [Google Scholar]
- 9.Lesch BJ, Silber SJ, McCarrey JR & Page DC Parallel evolution of male germline epigenetic poising and somatic development in animals. 48, 888–94 (2016). [DOI] [PubMed] [Google Scholar]
- 10.Waterston RH et al. Initial sequencing and comparative analysis of the mouse genome. Nature 420, 520–62 (2002). [DOI] [PubMed] [Google Scholar]
- 11.Lander ES et al. Initial sequencing and analysis of the human genome. Nature 409, 860–921 (2001). [DOI] [PubMed] [Google Scholar]
- 12.McClintock B. The origin and behavior of mutable loci in maize. Proc Natl Acad Sci U S A 36, 344–55 (1950). [DOI] [PMC free article] [PubMed] [Google Scholar]
- 13.Meyer TJ, Rosenkrantz JL, Carbone L. & Chavez SL Endogenous Retroviruses: With Us and against Us. Front Chem 5, 23 (2017). [DOI] [PMC free article] [PubMed] [Google Scholar]
- 14.Rebollo R, Romanish MT & Mager DL Transposable elements: an abundant and natural source of regulatory sequences for host genes. Annu Rev Genet 46, 21–42 (2012). [DOI] [PubMed] [Google Scholar]
- 15.Friedli M. & Trono D. The developmental control of transposable elements and the evolution of higher species. Annu Rev Cell Dev Biol 31, 429–51 (2015). [DOI] [PubMed] [Google Scholar]
- 16.Chuong EB, Elde NC & Feschotte C. Regulatory activities of transposable elements: from conflicts to benefits. Nat Rev Genet 18, 71–86 (2017). [DOI] [PMC free article] [PubMed] [Google Scholar]
- 17.Garcia-Perez JL, Widmann TJ & Adams IR The impact of transposable elements on mammalian development. Development 143, 4101–4114 (2016). [DOI] [PMC free article] [PubMed] [Google Scholar]
- 18.Thompson PJ, Macfarlan TS & Lorincz MC Long Terminal Repeats: From Parasitic Elements to Building Blocks of the Transcriptional Regulatory Repertoire. Mol Cell 62, 766–76 (2016). [DOI] [PMC free article] [PubMed] [Google Scholar]
- 19.Zamudio N. & Bourc’his D. Transposable elements in the mammalian germline: a comfortable niche or a deadly trap? Heredity (Edinb) 105, 92–104 (2010). [DOI] [PubMed] [Google Scholar]
- 20.Crichton JH, Dunican DS, Maclennan M, Meehan RR & Adams IR Defending the genome from the enemy within: mechanisms of retrotransposon suppression in the mouse germline. Cell Mol Life Sci 71, 1581–605 (2014). [DOI] [PMC free article] [PubMed] [Google Scholar]
- 21.Ku HY & Lin H. PIWI proteins and their interactors in piRNA biogenesis, germline development and gene expression. Natl Sci Rev 1, 205–218 (2014). [DOI] [PMC free article] [PubMed] [Google Scholar]
- 22.Watanabe T, Cheng EC, Zhong M. & Lin H. Retrotransposons and pseudogenes regulate mRNAs and lncRNAs via the piRNA pathway in the germline. Genome Res 25, 368–80 (2015). [DOI] [PMC free article] [PubMed] [Google Scholar]
- 23.Davis MP et al. Transposon-driven transcription is a conserved feature of vertebrate spermatogenesis and transcript evolution. EMBO Rep 18, 1231–1247 (2017). [DOI] [PMC free article] [PubMed] [Google Scholar]
- 24.Maezawa S, Yukawa M, Alavattam KG, Barski A. & Namekawa SH Dynamic reorganization of open chromatin underlies diverse transcriptomes during spermatogenesis. Nucleic Acids Res 46, 593–608 (2018). [DOI] [PMC free article] [PubMed] [Google Scholar]
- 25.Alavattam KG et al. Attenuated chromatin compartmentalization in meiosis and its maturation in sperm development. Nat Struct Mol Biol 26, 175–184 (2019). [DOI] [PMC free article] [PubMed] [Google Scholar]
- 26.Patel L. et al. Dynamic reorganization of the genome shapes the recombination landscape in meiotic prophase. Nat Struct Mol Biol 26, 164–174 (2019). [DOI] [PMC free article] [PubMed] [Google Scholar]
- 27.Wang Y. et al. Reprogramming of Meiotic Chromatin Architecture during Spermatogenesis. Mol Cell 73, 547–561.e6 (2019). [DOI] [PubMed] [Google Scholar]
- 28.Maezawa S. et al. Polycomb protein SCML2 facilitates H3K27me3 to establish bivalent domains in the male germline. Proc Natl Acad Sci U S A 115, 4957–4962 (2018). [DOI] [PMC free article] [PubMed] [Google Scholar]
- 29.Adams SR et al. RNF8 and SCML2 cooperate to regulate ubiquitination and H3K27 acetylation for escape gene activation on the sex chromosomes. PLoS Genet 14, e1007233 (2018). [DOI] [PMC free article] [PubMed] [Google Scholar]
- 30.Maezawa S. et al. Super-enhancer switching drives a burst in germline gene expression at the mitosis-to-meiosis transition. Nat Struct Mol Biol (2020). [DOI] [PMC free article] [PubMed] [Google Scholar]
- 31.Reichmann J. et al. Microarray analysis of LTR retrotransposon silencing identifies Hdac1 as a regulator of retrotransposon expression in mouse embryonic stem cells. PLoS Comput Biol 8, e1002486 (2012). [DOI] [PMC free article] [PubMed] [Google Scholar]
- 32.Ollinger R. et al. Deletion of the pluripotency-associated Tex19.1 gene causes activation of endogenous retroviruses and defective spermatogenesis in mice. PLoS Genet 4, e1000199 (2008). [DOI] [PMC free article] [PubMed] [Google Scholar]
- 33.Russ BE et al. Regulation of H3K4me3 at Transcriptional Enhancers Characterizes Acquisition of Virus-Specific CD8(+) T Cell-Lineage-Specific Function. Cell Rep 21, 3624–3636 (2017). [DOI] [PubMed] [Google Scholar]
- 34.Chuong EB, Rumi MA, Soares MJ & Baker JC Endogenous retroviruses function as species-specific enhancer elements in the placenta. Nat Genet 45, 325–9 (2013). [DOI] [PMC free article] [PubMed] [Google Scholar]
- 35.Sin HS et al. RNF8 regulates active epigenetic modifications and escape gene activation from inactive sex chromosomes in post-meiotic spermatids. Genes Dev 26, 2737–48 (2012). [DOI] [PMC free article] [PubMed] [Google Scholar]
- 36.Bolcun-Filas E. et al. A-MYB (MYBL1) transcription factor is a master regulator of male meiosis. Development 138, 3319–30 (2011). [DOI] [PMC free article] [PubMed] [Google Scholar]
- 37.Li XZ et al. An ancient transcription factor initiates the burst of piRNA production during early meiosis in mouse testes. Mol Cell 50, 67–81 (2013). [DOI] [PMC free article] [PubMed] [Google Scholar]
- 38.Hubley R. et al. The Dfam database of repetitive DNA families. Nucleic Acids Res 44, D81–9 (2016). [DOI] [PMC free article] [PubMed] [Google Scholar]
- 39.Isbel L. et al. Trim33 Binds and Silences a Class of Young Endogenous Retroviruses in the Mouse Testis; a Novel Component of the Arms Race between Retrotransposons and the Host Genome. PLoS Genet 11, e1005693 (2015). [DOI] [PMC free article] [PubMed] [Google Scholar]
- 40.Brind’Amour J. et al. An ultra-low-input native ChIP-seq protocol for genome-wide profiling of rare cell populations. Nat Commun 6, 6033 (2015). [DOI] [PubMed] [Google Scholar]
- 41.Nakasuji T. et al. Complementary Critical Functions of Zfy1 and Zfy2 in Mouse Spermatogenesis and Reproduction. PLoS Genet 13, e1006578 (2017). [DOI] [PMC free article] [PubMed] [Google Scholar]
- 42.McCarrey JR Toward a more precise and informative nomenclature describing fetal and neonatal male germ cells in rodents. Biol Reprod 89, 47 (2013). [DOI] [PMC free article] [PubMed] [Google Scholar]
- 43.An integrated encyclopedia of DNA elements in the human genome. Nature 489, 57–74 (2012). [DOI] [PMC free article] [PubMed] [Google Scholar]
- 44.Ecco G. et al. Transposable Elements and Their KRAB-ZFP Controllers Regulate Gene Expression in Adult Tissues. Dev Cell 36, 611–23 (2016). [DOI] [PMC free article] [PubMed] [Google Scholar]
- 45.Imbeault M, Helleboid PY & Trono D. KRAB zinc-finger proteins contribute to the evolution of gene regulatory networks. Nature 543, 550–554 (2017). [DOI] [PubMed] [Google Scholar]
- 46.Peaston AE et al. Retrotransposons regulate host genes in mouse oocytes and preimplantation embryos. Dev Cell 7, 597–606 (2004). [DOI] [PubMed] [Google Scholar]
- 47.Veselovska L. et al. Deep sequencing and de novo assembly of the mouse oocyte transcriptome define the contribution of transcription to the DNA methylation landscape. Genome Biol 16, 209 (2015). [DOI] [PMC free article] [PubMed] [Google Scholar]
- 48.Franke V. et al. Long terminal repeats power evolution of genes and gene expression programs in mammalian oocytes and zygotes. Genome Res 27, 1384–1394 (2017). [DOI] [PMC free article] [PubMed] [Google Scholar]
- 49.Bogutz AB et al. Evolution of imprinting via lineage-specific insertion of retroviral promoters. Nat Commun 10, 5674 (2019). [DOI] [PMC free article] [PubMed] [Google Scholar]
- 50.De Iaco A. et al. DUX-family transcription factors regulate zygotic genome activation in placental mammals. Nat Genet 49, 941–945 (2017). [DOI] [PMC free article] [PubMed] [Google Scholar]
- 51.Hendrickson PG et al. Conserved roles of mouse DUX and human DUX4 in activating cleavage-stage genes and MERVL/HERVL retrotransposons. Nat Genet 49, 925–934 (2017). [DOI] [PMC free article] [PubMed] [Google Scholar]
- 52.Kim TK et al. Widespread transcription at neuronal activity-regulated enhancers. Nature 465, 182–7 (2010). [DOI] [PMC free article] [PubMed] [Google Scholar]
- 53.Wang M. et al. Single-Cell RNA Sequencing Analysis Reveals Sequential Cell Fate Transition during Human Spermatogenesis. Cell Stem Cell 23, 599–614.e4 (2018). [DOI] [PubMed] [Google Scholar]
- 54.Dunn-Fletcher CE et al. Anthropoid primate-specific retroviral element THE1B controls expression of CRH in placenta and alters gestation length. PLoS Biol 16, e2006337 (2018). [DOI] [PMC free article] [PubMed] [Google Scholar]
- 55.Chuong EB The placenta goes viral: Retroviruses control gene expression in pregnancy. PLoS Biol 16, e3000028 (2018). [DOI] [PMC free article] [PubMed] [Google Scholar]
- 56.Yuan CL & Hu YC A Transgenic Core Facility’s Experience in Genome Editing Revolution. Adv Exp Med Biol 1016, 75–90 (2017). [DOI] [PubMed] [Google Scholar]
- 57.Haeussler M. et al. Evaluation of off-target and on-target scoring algorithms and integration into the guide RNA selection tool CRISPOR. Genome Biol 17, 148 (2016). [DOI] [PMC free article] [PubMed] [Google Scholar]
- 58.Li E, Bestor TH & Jaenisch R. Targeted mutation of the DNA methyltransferase gene results in embryonic lethality. Cell 69, 915–26 (1992). [DOI] [PubMed] [Google Scholar]
- 59.Chavez A. et al. Highly efficient Cas9-mediated transcriptional programming. Nat Methods 12, 326–8 (2015). [DOI] [PMC free article] [PubMed] [Google Scholar]
- 60.Wang W. et al. Chromosomal transposition of PiggyBac in mouse embryonic stem cells. Proc Natl Acad Sci U S A 105, 9290–5 (2008). [DOI] [PMC free article] [PubMed] [Google Scholar]
- 61.Kim D, Langmead B. & Salzberg SL HISAT: a fast spliced aligner with low memory requirements. Nat Methods 12, 357–60 (2015). [DOI] [PMC free article] [PubMed] [Google Scholar]
- 62.Anders S, Pyl PT & Huber W. HTSeq--a Python framework to work with high-throughput sequencing data. Bioinformatics 31, 166–9 (2015). [DOI] [PMC free article] [PubMed] [Google Scholar]
- 63.Pertea M, Kim D, Pertea GM, Leek JT & Salzberg SL Transcript-level expression analysis of RNA-seq experiments with HISAT, StringTie and Ballgown. Nat Protoc 11, 1650–67 (2016). [DOI] [PMC free article] [PubMed] [Google Scholar]
- 64.Quinlan AR & Hall IM BEDTools: a flexible suite of utilities for comparing genomic features. Bioinformatics 26, 841–2 (2010). [DOI] [PMC free article] [PubMed] [Google Scholar]
- 65.Love MI, Huber W. & Anders S. Moderated estimation of fold change and dispersion for RNA-seq data with DESeq2. Genome Biol 15, 550 (2014). [DOI] [PMC free article] [PubMed] [Google Scholar]
- 66.Huang da W, Sherman BT & Lempicki RA Systematic and integrative analysis of large gene lists using DAVID bioinformatics resources. Nat Protoc 4, 44–57 (2009). [DOI] [PubMed] [Google Scholar]
- 67.Robinson JT et al. Integrative genomics viewer. Nat Biotechnol 29, 24–6 (2011). [DOI] [PMC free article] [PubMed] [Google Scholar]
- 68.Langmead B. & Salzberg SL Fast gapped-read alignment with Bowtie 2. Nat Methods 9, 357–9 (2012). [DOI] [PMC free article] [PubMed] [Google Scholar]
- 69.Feng J, Liu T. & Zhang Y. Using MACS to identify peaks from ChIP-Seq data. Curr Protoc Bioinformatics Chapter 2, Unit 2.14 (2011). [DOI] [PMC free article] [PubMed] [Google Scholar]
- 70.Shen L, Shao N, Liu X. & Nestler E. ngs.plot: Quick mining and visualization of next-generation sequencing data by integrating genomic databases. BMC Genomics 15, 284 (2014). [DOI] [PMC free article] [PubMed] [Google Scholar]
- 71.Heinz S. et al. Simple combinations of lineage-determining transcription factors prime cis-regulatory elements required for macrophage and B cell identities. Mol Cell 38, 576–89 (2010). [DOI] [PMC free article] [PubMed] [Google Scholar]
- 72.McLean CY et al. GREAT improves functional interpretation of cis-regulatory regions. Nat Biotechnol 28, 495–501 (2010). [DOI] [PMC free article] [PubMed] [Google Scholar]
- 73.Kinsella RJ et al. Ensembl BioMarts: a hub for data retrieval across taxonomic space. Database (Oxford) 2011, bar030 (2011). [DOI] [PMC free article] [PubMed] [Google Scholar]
- 74.Schneider CA, Rasband WS & Eliceiri KW NIH Image to ImageJ: 25 years of image analysis. Nat Methods 9, 671–5 (2012). [DOI] [PMC free article] [PubMed] [Google Scholar]
- 75.Jung YH et al. Chromatin States in Mouse Sperm Correlate with Embryonic and Adult Regulatory Landscapes. Cell Rep 18, 1366–1382 (2017). [DOI] [PMC free article] [PubMed] [Google Scholar]
- 76.Lavin Y. et al. Tissue-resident macrophage enhancer landscapes are shaped by the local microenvironment. Cell 159, 1312–26 (2014). [DOI] [PMC free article] [PubMed] [Google Scholar]
- 77.Guo J. et al. Chromatin and Single-Cell RNA-Seq Profiling Reveal Dynamic Signaling and Metabolic Transitions during Human Spermatogonial Stem Cell Development. Cell Stem Cell 21, 533–546.e6 (2017). [DOI] [PMC free article] [PubMed] [Google Scholar]
- 78.Li D. et al. Chromatin Accessibility Dynamics during iPSC Reprogramming. Cell Stem Cell 21, 819–833.e6 (2017). [DOI] [PubMed] [Google Scholar]
- 79.He S. et al. Hemi-methylated CpG sites connect Dnmt1-knockdown-induced and Tet1-induced DNA demethylation during somatic cell reprogramming. Cell Discov 5, 11 (2019). [DOI] [PMC free article] [PubMed] [Google Scholar]
- 80.Cao S. et al. Chromatin Accessibility Dynamics during Chemical Induction of Pluripotency. Cell Stem Cell 22, 529–542.e5 (2018). [DOI] [PubMed] [Google Scholar]
Associated Data
This section collects any data citations, data availability statements, or supplementary materials included in this article.


