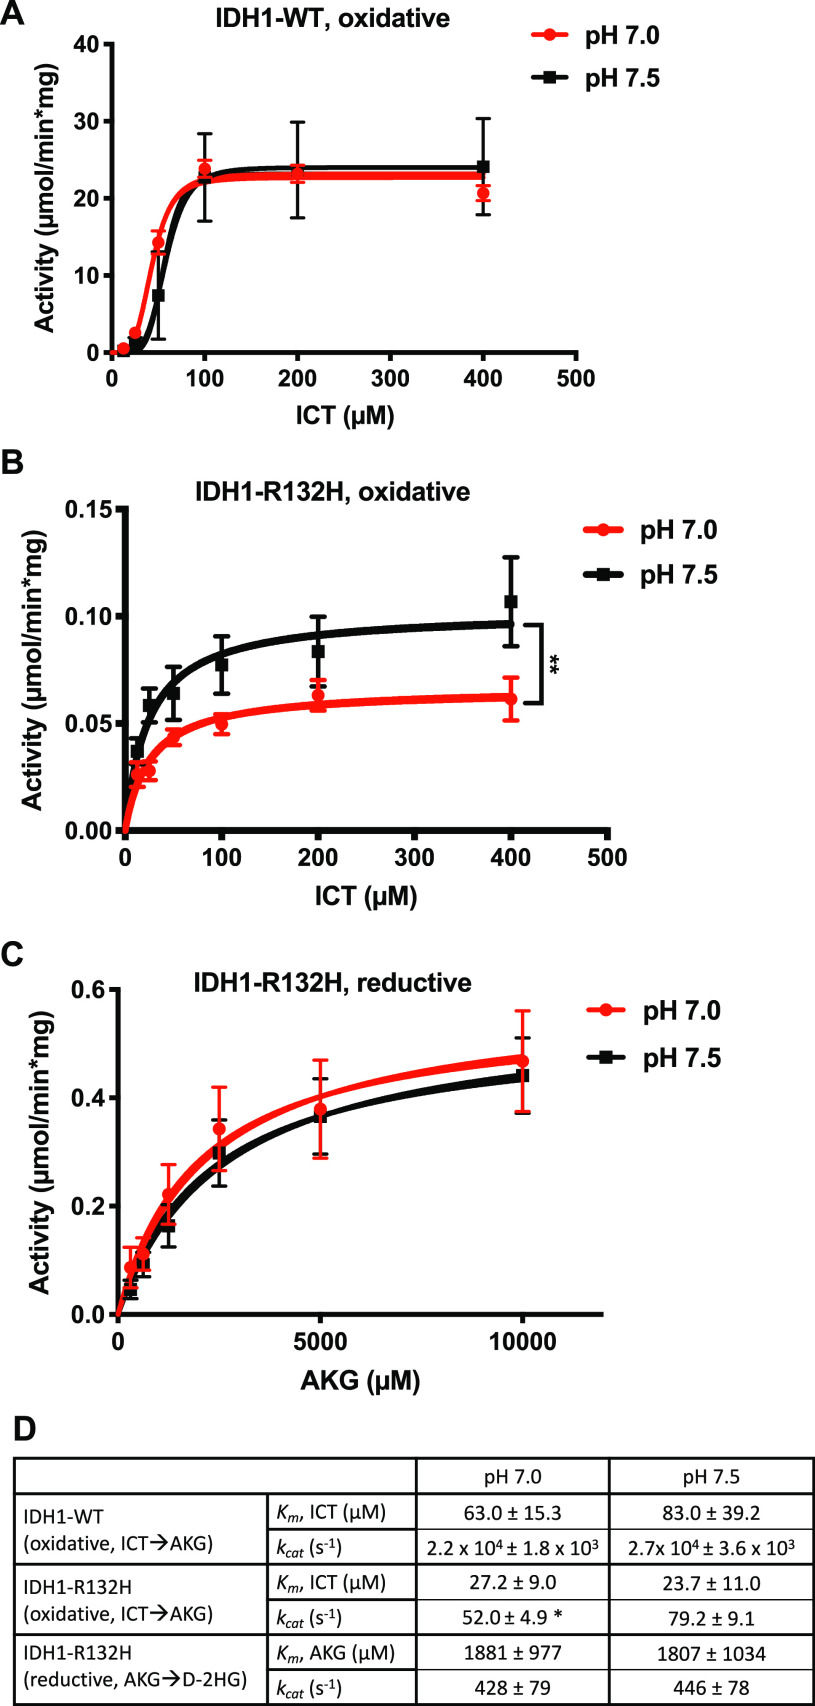
Figure 3.
IDH1 homodimer activities in vitro show pH insensitive D-2HG production. See Methods for assembly protocols for in vitro activity assays. (A) Activity of IDH1-WT (micromoles per minute per milligram of protein) for forward oxidative (ICT → AKG) reaction at two buffer pH values (7.0 and 7.5). (B) Activity of IDH1-R132H (micromoles per minute per milligram of protein) for the forward oxidative (ICT → AKG) reaction at two buffer pH values: 7.0 and 7.5. (C) Activity of IDH1-R132H (micromoles per minute per milligram of protein) for the reverse reductive (AKG → D-2HG) reaction at two buffer pH values (7.0 and 7.5). Data in panel A–C are from seven replicates across two protein preparations and shown as scatter plots (mean ± standard error of the mean), with curve fits shown. Significance was determined using Graph Pad Prism Michaelis–Menten curve fitting (see Methods for details) (**p < 0.01) for Vmax. (D) Table of Michaelis–Menten kinetic constants kcat and Km quantified from the data in panels A–C. Significance was determined using Graph Pad Prism Michaelis–Menten curve fitting (see Methods for details) (*p < 0.05, compared to pH 7.5).

