

Abstract
Background
EAACI guidelines emphasize the importance of patient history in diagnosing food allergy (FA) and the need for studies investigating its value using standardized allergy‐focused questionnaires.
Objective
To determine the contribution of reaction characteristics, allergic comorbidities and demographics to prediction of FA in individuals experiencing food‐related adverse reactions.
Methods
Adult and school‐age participants in the standardized EuroPrevall population surveys, with self‐reported FA, were included. Penalized multivariable regression was used to assess the association of patient history determinants with “probable” FA, defined as a food‐specific case history supported by relevant IgE sensitization.
Results
In adults (N = 844), reproducibility of reaction (OR 1.35 [95% CI 1.29‐1.41]), oral allergy symptoms (OAS) (4.46 [4.19‐4.75]), allergic rhinitis (AR) comorbidity (2.82 [2.68‐2.95]), asthma comorbidity (1.38 [1.30‐1.46]) and male sex (1.50 [1.41‐1.59]) were positively associated with probable FA. Gastrointestinal symptoms (0.88 [0.85‐0.91]) made probable FA less likely. The AUC of a model combining all selected predictors was 0.85 after cross‐validation. In children (N = 670), OAS (2.26 [2.09‐2.44]) and AR comorbidity (1.47 [CI 1.39‐1.55]) contributed most to prediction of probable FA, with a combined cross‐validation‐based AUC of 0.73. When focusing on plant foods, the dominant source of FA in adults, the pediatric model also included gastrointestinal symptoms (inverse association), and the AUC increased to 0.81.
Conclusions
In both adults and school‐age children from the general population, reporting of OAS and of AR comorbidity appear to be the strongest predictors of probable FA. Patient history particularly allows for good discrimination between presence and absence of probable plant FA.
Keywords: Europe, food allergy, food sensitization, patient history, prediction
In support of expert opinion, data collected in a standardized manner all across Europe reveal that information available from patient history can accurately predict IgE sensitization corresponding to a food‐specific case history (probable FA). OAS and AR comorbidity are strongly associated with presence of FA and GI symptoms with absence of FA (particularly plant FA) in adults and children.
Abbreviations: AA, allergic asthma; AR, allergic rhinitis; FA, food allergy; GI, gastrointestinal; OAS, oral allergy symptoms
Abbreviations
- AD
atopic dermatitis
- AR
allergic rhinitis
- CI
confidence interval
- FA
food allergy
- GI
gastrointestinal
- OAS
oral allergy syndrome
- OR
odds ratio
1. INTRODUCTION
Typical food allergies (FAs) are IgE‐mediated. In some parts of Europe, the prevalence of self‐reported FA to commonly incriminated foods is as high as 19% in adults and 25% in school‐age children from the general population. 1 , 2 The majority of these self‐reported adverse reactions to foods are however not attributed to IgE: the prevalence of probable FA, defined as a food‐specific case history supported by relevant IgE sensitization, is much lower than the prevalence of self‐reported FA. 1 , 2 , 3
A key tool available to all physicians for assessing the likelihood of FA is patient history. FA guidelines from the European Academy of Allergy and Clinical Immunology (EAACI) acknowledge the importance of patient history in the diagnosis of FA, but also highlight that studies evaluating the accuracy of predictions using standardized allergy‐focused history questionnaires are lacking, as well as studies modelling the use of history to predict FA. 4 Current evidence is based on expert opinion. 4 , 5 Therefore, the EAACI guidelines have assigned high priority to clinical studies investigating this knowledge gap. 4
The data collected using well‐standardized questionnaires in the EU‐funded multicenter EuroPrevall project, designed to evaluate FA across Europe, provide a unique opportunity to investigate the value of information available from patient history for predicting FA. The objective of this study was to ascertain which reaction characteristics, allergic comorbidities and demographic factors contribute to prediction of probable FA in adults and school‐age children reporting food‐related symptoms.
2. METHODS
2.1. Study design, setting and subjects
As part of the EuroPrevall project, data were collected between 2005 and 2009 from 20‐ to 54‐year‐old and 7‐ to 10‐year‐old randomly sampled individuals from the general population of socio‐economically and climatically different regions in Europe. The detailed methodology of this study is described elsewhere. 2 , 3 , 6 The study population for the current study consisted of subjects with self‐reported FA from Athens (Greece), Lodz (Poland), Madrid (Spain), Reykjavik (Iceland), Utrecht (the Netherlands), Vilnius (Lithuania) and Zurich (Switzerland). Subjects responded to a short screening questionnaire on adverse reactions to food, symptoms and incriminated foods, in phase I of the EuroPrevall study. Subjects were further evaluated in phase II if they indicated that they had symptoms to one of 24 foods frequently consumed or commonly implicated in food allergic reactions across Europe (so‐called priority foods: hen's egg, cow's milk, fish, shrimp, peanut, hazelnut, peach, apple, celery, walnut, soy, wheat, buckwheat, kiwi fruit, corn, carrot, tomato, melon, banana, lentils, sesame seed, mustard seed, sunflower seed and poppy seed). Phase II consisted of an extensive questionnaire and blood sampling to test for presence of IgE against priority foods. All subjects with self‐reported symptoms to one of the 24 priority foods, a completed phase II questionnaire and IgE serology testing, were included in this study. 2 , 3
The local ethical committees of all participating centers approved this study, and informed consent was obtained from all participants.
2.2. Data collection
The outcome, probable FA, was considered present in subjects with IgE sensitization corresponding to a self‐reported adverse reaction to at least one of the 24 priority foods. Commercially available ImmunoCAP tests (Phadia, currently Thermo Fisher Scientific) were used to measure serum sIgE levels, and a value ≥0.35 kUA/L was considered positive. All serology testing was performed in a single laboratory at the Amsterdam University Medical Centers (location AMC, Amsterdam, the Netherlands).
The evaluated predictors were as follows: reaction characteristics (time until onset, reproducibility of the reaction, oral allergy symptoms [OAS], skin symptoms, gastrointestinal symptoms, rhinoconjunctivitis, respiratory symptoms and cardiovascular symptoms); allergic comorbidities (allergic rhinitis [AR], asthma, atopic dermatitis [AD]); demoghraphic factors (age, sex, [parental] level of education); and (parental) smoking. The predictor information was obtained from both the phase I and phase II questionnaires, which were enriched versions of well‐standardized allergy questionnaires, 7 with a specific focus on reactions to the priority foods. The phase I questionnaire was self‐administered, while the phase II questionnaire was conducted by trained interviewers.
2.3. Data analysis
Analyses were performed separately for adults and children. Differences between subjects with and without probable FA were described and analyzed using the chi‐square test, two‐sample T test or Mann‐Whitney U test, as appropriate for the variable's distribution. After obtaining crude odds ratios (ORs) for each of the evaluated predictors through univariable logistic regression, multivariable logistic regression was performed with all predictors to determine adjusted ORs. Because the probability of probable FA is known to differ per center, 2 , 3 center was included as a covariate in the analysis. The Lithuanian site Vilnius was only included in the pediatric population, as very few (N = 4) Lithuanian adults with self‐reported FA participated in phase II. 3
In order to present a parsimonious model with the most discriminative combination of the evaluated predictors for probable FA, and to avoid overfitting, Least Absolute Shrinkage and Selection Operator (Lasso) regression was applied. Lasso regression is a form of penalized regression, in which only the most contributive variables are selected, and shrinkage of regression coefficients is applied through cross‐validation, to arrive at a more generalizable model. 8 The area under the curve (AUC) of the receiver operating characteristic (ROC) was calculated to evaluate the diagnostic value of both the full and penalized model.
We know from previous research that probable FA to plant source foods dominates in adults, 3 but that both plant and animal source probable FA play important roles in school‐age children. 2 Because the presentation of FA may depend on the type of food eliciting the reaction, patient history determinants of children with only plant source probable FA and of children with only animal source probable FA were compared univariably in an extra explorative analysis. The Lasso regression was then repeated in the source population of children with self‐reported FA to plant source foods, and the outcome plant source probable FA was evaluated, as this concerned the largest group of children and improved comparability to the adult population.
Analyses were conducted with SPSS version 25 and R version 3.4.1.
3. RESULTS
3.1. Adults
Of 862 adult subjects reporting symptoms to priority foods and completing phase II, 3 the 844 with available serology were evaluated in this study. Positive IgE serology matching the food reported to cause symptoms was identified in 207/844 (25%) subjects, who were classified as having probable FA. Table 1 shows the population characteristics of these subjects. Most adults had probable FA to hazelnut, followed by apple, peach, kiwi, carrot and walnut (Table S1).
TABLE 1.
Population characteristics
| Adults | P‐value* | Children | P‐value* | |||
|---|---|---|---|---|---|---|
| Probable FA | No probable FA | Probable FA | No probable FA | |||
| N = 207 | N = 637 | N = 136 | N = 534 | |||
| Age, mean (SD) | 35.9 (9.0) | 37.8 (9.5) | .012 | 9.02 (0.99) | 8.88 (0.95) | .138 |
| Sex, N (%) | ||||||
| Male | 93 (44.9) | 198 (31.1) | <.001 | 68 (50.0) | 254 (47.6) | .612 |
| Female | 114 (55.1) | 439 (68.9) | 68 (50.0) | 280 (52.4) | ||
| Level of education a , N (%) | ||||||
| Low | 69 (33.3) | 208 (32.7) | .856 | 82 (60.3) | 297 (55.6) | .326 |
| High | 138 (66.7) | 429 (67.3) | 54 (39.7) | 237 (44.4) | ||
| (Parental) smoking b , N (%) | 106 (51.2) | 321 (50.4) | .838 | 78 (57.4) | 258 (48.4) | .062 |
| Allergic comorbidities, N (%) | ||||||
| Allergic rhinitis | 190 (91.8) | 376 (59.0) | <.001 | 101 (74.3) | 234 (43.8) | <.001 |
| Asthma | 81 (39.1) | 119 (18.7) | <.001 | 54 (39.7) | 145 (27.2) | .004 |
| Atopic dermatitis | 55 (26.6) | 179 (28.1) | .669 | 89 (65.4) | 288 (53.9) | .016 |
| Reproducibility of reaction c , N (%) | 195 (95.6) | 547 (88.1) | .002 | 120 (90.9) | 481 (92.3) | .592 |
| Time onset in minutes, median (Q1‐Q3) | 5 (1‐15) | 30 (10‐120) | <.001 | 5 (1.0‐60.0) | 60.0 (5.0‐240.0) | <.001 |
| Symptoms d , N (%) | ||||||
| Oral allergy | 169 (81.6) | 214 (33.6) | <.001 | 75 (55.1) | 112 (21.0) | <.001 |
| Skin | 79 (38.2) | 259 (40.7) | .524 | 108 (79.4) | 345 (64.6) | .001 |
| Gastrointestinal | 52 (25.1) | 286 (44.9) | <.001 | 38 (27.9) | 205 (38.4) | .024 |
| Rhinoconjunctivitis | 61 (29.5) | 142 (22.3) | .036 | 55 (40.4) | 133 (24.9) | <.001 |
| Respiratory | 44 (21.3) | 71 (11.1) | <.001 | 27 (19.9) | 47 (8.8) | <.001 |
| Cardiovascular | 15 (7.2) | 79 (12.4) | .041 | 6 (4.4) | 18 (3.4) | .560 |
| Center, N (%) | ||||||
| Athens | 5 (2.4) | 17 (2.7) | <.001 | 7 (5.1) | 17 (3.2) | .003 |
| Lodz | 26 (12.6) | 88 (13.8) | 30 (22.1) | 174 (32.6) | ||
| Madrid | 19 (9.2) | 63 (9.9) | 22 (16.2) | 43 (8.1) | ||
| Reykjavik | 21 (10.1) | 189 (29.7) | 26 (19.1) | 128 (24.0) | ||
| Utrecht | 60 (29.0) | 139 (21.8) | 28 (20.6) | 78 (14.6) | ||
| Zurich | 76 (36.7) | 141 (22.1) | 17 (12.5) | 48 (9.0) | ||
| Vilnius | ‐ | ‐ | 6 (4.4) | 46 (8.6) | ||
Low level of education: None, primary school only, secondary school only or lower level vocational training. High level of education: higher level vocational training, university or full‐time student. For children, the highest level of education of the best‐educated parent was taken into account.
For adults: “Ever smoked for at least one year?” For children: “Has either parent smoked at least 1 cigarette (or alternative) a day since the birth of the child?”
Reproducibility of reaction: the reaction occurred more than once (reference = once).
Oral allergy symptoms = itching, tingling or swelling of the mouth, lips or throat; Skin symptoms = rash, nettle sting or itchy skin; Rhinoconjunctivitis = runny or stuffy nose or red, sore or running eyes; Gastrointestinal symptoms = diarrhoea or vomiting; Respiratory symptoms = breathlessness; Cardiovascular symptoms = fainting or dizziness.
The P‐values pertain to the comparison of the two preceding columns using the chi‐square test, two‐sample T test or Mann‐Whitney U test as appropriate for the variable's distribution.
Complete data on the predictor variables, as required for multivariable analyses, were available for 807 subjects. There were no significant differences in demographics, allergic comorbidities, or reaction characteristics between the subjects with complete data (N = 807) and the subjects with missing data on food serology or predictor variables (N = 55), except that subjects from certain centers were more likely to have complete data (Table S2).
Univariable analysis revealed that shorter time until onset of the reaction, reproducibility of the reaction and reporting of OAS, rhinoconjunctivitis or respiratory symptoms in response to the culprit food were statistically significantly (P < .05) associated with probable FA, as were allergic comorbidities AR and asthma, and demographic factors younger age and male sex (Tables 1 and 2). Reporting of gastrointestinal (GI) symptoms and of potential cardiovascular symptoms (ie fainting or dizziness) were associated with not having probable FA.
TABLE 2.
Associations between reaction characteristics, allergic comorbidities, and demographic factors, and probable FA in individuals reporting food‐related symptoms
| Adults | Children | |||||||
|---|---|---|---|---|---|---|---|---|
| Crude OR a | 95%‐CI | Adjusted OR b | 95%‐CI | Crude OR a | 95%‐CI | Adjusted OR b | 95%‐CI | |
| Reaction characteristics | ||||||||
| Time until onset (per 30 min) | 0.94 | 0.90‐0.96 | 0.96 | 0.93‐0.99 | 0.99 | 0.98‐1.00 | 1.00 | 0.99‐1.00 |
| Reproducibility of reaction | 2.93 | 1.52‐6.39 | 3.24 | 1.41‐8.33 | 0.83 | 0.44‐1.70 | 0.75 | 0.34‐1.72 |
| Oral allergy symptoms | 8.79 | 6.02‐13.12 | 5.62 | 3.61‐8.93 | 4.63 | 3.12‐6.91 | 3.43 | 2.07‐5.71 |
| Skin symptoms | 0.90 | 0.65‐1.24 | 0.92 | 0.59‐1.42 | 2.11 | 1.36‐3.37 | 1.67 | 0.96‐2.96 |
| Gastrointestinal symptoms | 0.41 | 0.29‐0.58 | 0.59 | 0.38‐0.90 | 0.62 | 0.41‐0.93 | 0.86 | 0.52‐1.42 |
| Rhinoconjunctivitis | 1.46 | 1.02‐2.07 | 1.11 | 0.69‐1.77 | 2.05 | 1.38‐3.03 | 1.43 | 0.85‐2.38 |
| Respiratory symptoms | 2.15 | 1.41‐3.25 | 1.41 | 0.82‐2.41 | 2.57 | 1.52‐4.28 | 1.01 | 0.50‐1.98 |
| Cardiovascular symptoms | 0.55 | 0.30‐0.95 | 0.63 | 0.30‐1.25 | 1.32 | 0.44‐3.23 | 1.39 | 0.40‐3.82 |
| Allergic comorbidities | ||||||||
| Allergic rhinitis | 7.76 | 4.74‐13.52 | 4.44 | 2.52‐8.26 | 3.70 | 2.45‐5.70 | 3.13 | 1.87‐5.33 |
| Asthma | 2.80 | 1.98‐3.94 | 1.88 | 1.21‐2.95 | 1.77 | 1.19‐2.61 | 1.20 | 0.71‐2.02 |
| Atopic dermatitis | 0.93 | 0.65‐1.31 | 0.74 | 0.47‐1.16 | 1.62 | 1.10‐2.41 | 1.36 | 0.85‐2.22 |
| Demographic factors | ||||||||
| Age | 0.98 | 0.96‐1.00 | 0.98 | 0.96‐1.00 | 1.16 | 0.95‐1.42 | 0.99 | 0.78‐1.26 |
| Male sex | 1.81 | 1.31‐2.49 | 2.34 | 1.55‐3.57 | 1.10 | 0.76‐1.61 | 1.03 | 0.65‐1.61 |
| High level of education | 0.97 | 0.70‐1.36 | 1.01 | 0.64‐1.59 | 0.83 | 0.56‐1.21 | 0.93 | 0.57‐1.50 |
| (Parental) smoking | 1.03 | 0.75‐1.41 | 1.43 | 0.95‐2.16 | 1.43 | 0.98‐2.10 | 1.22 | 0.77‐1.96 |
| AUC | 0.86 (0.83‐0.89) | 0.76 (0.71‐0.82) | ||||||
Bold print: significant at P < .05.
Abbreviations: AUC, area under the receiver operating characteristic curve; CI, confidence interval; OR, Odds ratio.
Unadjusted OR, results of univariable logistic regression analysis.
Adjusted OR, results of multivariable logistic regression analysis with all covariates included, that is the full model. Model coefficients were adjusted for center.
In multivariable analyses, the combination of all predictor variables resulted in an AUC of 0.86 (95%‐CI 0.83‐0.89), implying good discriminative ability. Seven patient history predictors (reaction time, reproducibility of the reaction, OAS, GI symptoms, asthma, AR and sex) were found to independently and statistically significantly contribute to differentiation between presence or absence of probable FA (Table 2). The strongest of these predictors were reporting of OAS and of AR comorbidity, with respective OR's of 5.62 (95%‐CI 3.61‐8.93) and 4.44 (95%‐CI 2.52‐8.26).
The results from Lasso regression are presented in Figure 1. The same seven patient history variables were selected to optimally predict probable FA (Figure 1), though the ORs were less extreme and the AUC of this parsimonious model (based on cross‐validation) was lower (0.85 (95%‐CI 0.82‐0.87)), as expected.
FIGURE 1.
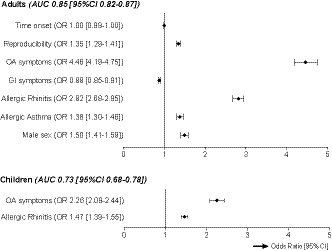
Independent predictors of probable FA in individuals reporting food‐related symptoms, results from Lasso regression analysis. 95% confidence intervals were calculated from standard errors obtained through 1000 bootstrap samples.GI, gastrointestinal; OA, oral allergy
3.2. Children
As regards the population of school‐age children, 702 subjects with self‐reported FA completed phase II, 2 and 670 underwent food serology testing. A total of 136/670 (20%) children were found to have probable FA (Table 1). Children were mostly allergic to cow's milk, hen's egg, hazelnut, peanut, apple, kiwi, peach and walnut (Table S1).
Multivariable analyses could be performed in 593 children with complete data on predictor variables. As seen in Table S2, the population characteristics of the children with complete data (N = 593) were not significantly different to those of children with missing data on food serology or predictor variables (N = 109).
Similarly to adults in univariable analyses, shorter time until onset of the reaction; OAS, rhinoconjunctivitis, or respiratory symptoms; and having comorbid AR or asthma, were significantly associated with probable FA, and subjects reporting GI symptoms were less likely to have probable FA (Tables 1 and 2). In contrast to adults, reporting skin symptoms and having comorbid atopic dermatitis were positively and significantly associated with probable FA in children, and reproducibility of the reaction, although not statistically significant, was inversely associated with probable FA. None of the demographic factors age, sex or level of education predicted probable FA in children.
All patient history variables combined in multivariable analysis, yielded a full model with an AUC of 0.76 (0.71‐0.82). Two variables, which were also the strongest predictors in adults, were statistically significant for prediction of probable FA in children: OAS (OR 2.94 [95%‐CI 1.75‐4.97]) and AR comorbidity (OR 3.39 [95%‐CI 1.98‐5.91]) (Table 2). These two variables were also selected in the Lasso regression (Figure 1), which again resulted in less extreme ORs, and a lower cross‐validation‐based AUC of 0.73 (95% CI 0.68‐0.78).
3.3. Plant vs animal source causative foods in children
Although the vast majority of adults with probable FA were allergic to plant source foods (188/207, 91%), probable FA in children was frequently caused by animal source foods (62/136, 46%) as well as by plant source foods (92/136, 68%) (Table S1).
Table 3 shows that children with probable FA to only plant source foods (N = 74) reported OAS and AR comorbidity more often than children with probable FA to only animal source foods (N = 44). Furthermore, 58% of children with probable FA to animal source foods reported GI symptoms, compared with only 13% of children with probable FA to plant source foods.
TABLE 3.
Population characteristics for plant vs animal source probable FA
| Children | P‐value* | ||
|---|---|---|---|
| Plant source probable FA | Animal source probable FA | ||
| N = 74 | N = 44 | ||
| Age, mean (SD) | 9.2 (1.02) | 8.7 (0.85) | .017 |
| Sex, N (%) | |||
| Male | 37 (50.0) | 22 (50.0) | >.99 |
| Female | 37 (50.0) | 22 (50.0) | |
| Level of education parents, N (%) | |||
| Low | 49 (66.2) | 26 (59.1) | .437 |
| High | 25 (33.8) | 18 (40.9) | |
| Parental smoking, N (%) | 43 (58.1) | 27 (61.4) | .728 |
| Allergic comorbidities, N (%) | |||
| Allergic rhinitis | 62 (83.8) | 23 (52.3) | <.001 |
| Asthma | 27 (36.5) | 17 (38.6) | .815 |
| Atopic dermatitis | 44 (59.5) | 29 (65.9) | .485 |
| Reproducibility of reaction, N (%) | 61 (87.1) | 41 (93.2) | .306 |
| Time onset in minutes, median (Q1‐Q3) | 5.0 (1.0‐120.0) | 15.0 (3.0‐90.0) | .404 |
| Symptoms, N (%) | |||
| Oral allergy | 45 (60.8) | 15 (34.1) | .005 |
| Skin | 60 (81.1) | 32 (72.7) | .290 |
| Gastrointestinal | 9 (12.2) | 23 (52.3) | <.001 |
| Rhinoconjunctivitis | 33 (44.6) | 13 (29.5) | .105 |
| Respiratory | 11 (14.9) | 8 (18.2) | .635 |
| Cardiovascular | 5 (6.8) | 0 (0.0) | .078 |
| Center, N (%) | |||
| Athens | 3 (4.1) | 1 (2.3) | .002 |
| Lodz | 16 (21.6) | 11 (25.0) | |
| Madrid | 13 (17.6) | 6 (13.6) | |
| Reykjavik | 7 (9.5) | 16 (36.4) | |
| Utrecht | 15 (20.3) | 8 (18.2) | |
| Zurich | 16 (31.6) | 0 (0.0) | |
| Vilnius | 4 (5.4) | 2 (4.5) | |
In 18/136 children, both animal and plant source foods caused probable FA (Table S1). These subjects are excluded in this table.
The P‐values pertain to the comparison of the two preceding columns using the chi‐square test, two‐sample T test or Mann‐Whitney U test as appropriate for the variables distribution. Exploratory analyses, not corrected for multiple testing.
When probable FA to plant source foods rather than to all priority foods was taken as the outcome of interest, in a source population of children with self‐reported FA to plant source foods, Lasso regression selected OAS (OR 1.69, 95% CI 1.57‐1.82), rhinoconjunctivitis symptoms (OR 1.08, 95% CI 1.04‐1.13), GI symptoms (OR 0.63, 95% CI 0.59‐0.66) and AR comorbidity (OR 3.10, 95% CI 2.86‐3.37), as contributive predictors. The cross‐validation‐based AUC of this Lasso model focused on plant source probable FA, 0.81 (95% CI 0.75‐0.89), was more comparable to the AUC in adults, than the AUC of the Lasso model for predicting probable FA due to any priority food.
4. DISCUSSION
Experts describe patient history as the most important single test for diagnosing FA. 9 To our knowledge, the current study is the first to quantify the value of specific reported reaction characteristics (reaction time, reproducibility of reaction, symptoms) alongside allergic comorbidities and demographic factors, for predicting IgE sensitization corresponding to the culprit food, making FA probable. We also found that combining seven independent predictors (reaction time, reproducibility of reaction, OAS, GI symptoms, AR comorbidity, asthma comorbidity and sex) in a prediction model, allowed for good discrimination between presence and absence of probable FA in adults, with an AUC after cross‐validation of 0.85. For school‐age children, OAS and AR comorbidity were found to be the most discriminative combination of predictors for probable FA, with a comparatively lower AUC of 0.73, but which tended to improve when focusing solely on plant source causative foods, the main source of FA in adults.
Based on expert opinion, current guidelines state that timing, reproducibility, symptoms and co‐existing allergic diseases should be addressed in patient history for FA. 4 , 5 , 10 Our findings lend scientific evidence in support of these recommendations. A shorter time until onset of a reaction, reporting of OAS, rhinoconjunctivitis or respiratory symptoms upon ingestion of the culprit food, and AR or asthma comorbidity, were positively associated with probable FA in both adults and children. However, predictors of probable FA in children contrasted with those in adults in that time until onset and reproducibility of the reaction were not independently associated with probable FA in the pediatric multivariable analyses, and that skin symptoms tended to be more strongly associated with probable FA in children than in adults. An explanation for these observations could be that parents may not pick up on their child's reaction until later, when objective symptoms (ie skin symptoms) appear. Parents are also likely to ensure strict avoidance of a food after a child experiences a single adverse reaction, whereas adults may retry a food in case of mild symptoms, leading to reproducible reactions in adults and not in children. Another important difference between adults and children that affects which patient history determinants are associated with probable FA, is that adults are mainly allergic to plant source foods, whereas children are also likely to be allergic to animal source foods. Probable FAs to plant source foods rarely present with GI symptoms, whereas GI symptoms are often reported in relation to probable FA to animal source foods (Table 3). This observation explains why GI symptoms were inversely associated with probable FA in adults, but this association was only found in children when the analyses focused on plant source probable FA.
The strongest predictor of probable FA in both the adult and pediatric population was reporting of OAS. Clinical experience teaches that this clearly identifiable symptom is generally the first symptom that subjects with an IgE‐mediated reaction experience, 11 , 12 though it is particularly associated with pollen‐related FA. Pollen‐related FA is a very common cause of FA in European adults and adolescents and generally presents with mild OAS in reaction to raw fruits, vegetables and nuts that cross‐react with pollen allergens to which the symptomatic individual is sensitized (most often PR10 proteins found in birch, or profilin found in all pollen). 13 , 14 The majority of subjects in our study were from birch endemic regions in Central and Northern Europe. In order to evaluate the relative importance of OAS independently of birch pollen sensitization and the modification of its predictive effect by birch pollen sensitization, we performed an additional analysis. We added IgE sensitization to major birch pollen allergen Bet v 1, 13 and an interaction between OAS and IgE sensitization to Bet v 1, to the full multivariable model. As expected, there was a statistically significant interaction between reporting of OAS and Bet v 1 sensitization in adults (P = .02). OAS was particularly predictive of FA in those with Bet v 1 sensitization (OR 11.8 [95% CI 3.9‐37.6]), and a less strong predictor in those without Bet v 1 sensitization (OR 2.6 [95% CI 1.4‐4.9]). Nonetheless, OAS remained a statistically significant independent predictor of probable FA in adults. As birch pollen‐related FA is not yet as common in 7‐ to 10‐year‐old children as in adults, it was not surprising that a similar interaction was not observed in children.
Although it goes beyond the scope of this paper to delve into geographical variation in the likelihood of probable FA, as this topic was extensively discussed in previous publications, 2 , 3 it is worth noting that the effect of center on probable FA in adults in multivariable analysis was strongest in countries known for high level of birch pollen sensitization (Switzerland, Poland and the Netherlands). The effect of center was no longer statistically significant after adjustment for Bet v 1 sensitization in the full model. In Lasso regression analysis, only Switzerland, the EuroPrevall country with the most birch pollen sensitization, 3 was selected as predictive of probable FA in adults. In the pediatric multivariable models, center was not a statistically significant predictor in the full model with all covariates included nor was it selected during Lasso regression. Apparently, most of the variation between centers in the pediatric population is explained by the other covariates included in the model (Table 2).
Previous studies taking the predictive value of patient history into account tend to focus only on severity of reported symptoms. In a pediatric outpatient population selected for food challenge in Ireland and the UK, DunnGalvin et al 15 found that increasing severity of reported symptoms increased the likelihood of challenge‐confirmed peanut, milk and egg allergy. In a Dutch adult outpatient population, Klemans et al 16 observed no statistically significant association between reported symptom severity and challenge‐confirmed peanut allergy. For comparative purposes, we graded reported symptoms according to the severity classification used by DunnGalvin et al, 15 in an additional analysis (Table S3). Similarly to DunnGalvin et al, the likelihood of probable FA tended to increase with increasing symptom severity in children in our study, though the trend was less clear in adults. Interestingly, our model with specific symptoms included independently (Table 2) rather than grouped in severity classifications (Table S3), was significantly better at discriminating between presence and absence of probable FA, specifically in adults (AUC = 0.86 [95% CI 0.83‐0.89) vs 0.81 [0.78‐0.84], PDe Long's test < .001 in adults; and AUC 0.76 [0.71‐0.82] vs 0.73 [0.68‐0.79], PDe Long's test = .43 in children).
The high predictive ability of our multivariable models for probable FA in adults, which combine reaction time, reproducibility of reaction, OAS, GI symptoms, AR comorbidity, asthma comorbidity and sex, may be useful in clinical practice. Our parsimonious model corrected for overfitting (Figure 1) aimed to be more generalizable to the general population of patients with food‐related complaints (Table 2). Details for the prediction formula and accuracy measures corresponding to specific cut‐offs of the formula's outcome score are available in Tables S4 and S5. Of particular interest is the high negative predictive value of the prediction formula. If all adults with a prediction score smaller than 0.17 (= 46% of the population) were to be classified as not having probable FA, 95% of these adults would indeed not have a probable FA. This might be of interest to GPs for identifying adults in whom to conduct further IgE sensitization testing, although formal validation of this formula should probably be performed before it can be used as such.
Although there were no food challenge outcomes available to assess the diagnostic value of patient history by comparing it to the reference standard for diagnosis of FA, our findings from prediction analyses yield essential evidence on the value of patient history in support of clinical practice. Our findings for probable FA are in line with expectations from expert opinion, according to which timing, reproducibility, symptoms and co‐existing allergic diseases should be addressed in patient history for FA. 4 , 5 , 10 The individual weights provided for these patient history determinants of probable FA in the current study, may in the future inform physicians' decision‐making in daily practice, particularly to help avoid unnecessary IgE testing in adults reporting adverse reactions to (mainly plant source) foods. All in all, our findings reinforce the value of patient history in the diagnostic workup of FA.
CONFLICT OF INTEREST
Outside of submitted work: Dr Papadopoulos reports personal fees from Novartis, Nutricia, HAL Allergy, Menarine/Faes Farma, Sanofi, Mylan/Meda, Biomay, AstraZeneca, GSK, MSD, ASIT Biotech, Boehringer Ingelheim; and grants from Gerolymatos International SA, and Capricare. Dr Fernández‐Rivas reports grants from Aimmune and Diater, and personal fees from Aimmune, Diater, ALK, DBV, Allergy Therapeutics, GSK, HAL Allergy, Thermo Fisher Scientific and SPRIM. Dr Ballmer‐Weber reports personal fees from Thermo Fisher Scientific. Dr Xepapadaki reports personal fees from Uriach, Novartis, Nestle, and Nutricia. Dr Mills reports grants from Reacta Biotech; and is shareholder of Reacta Biotech Ltd. Dr Van Ree reports personal fees from HAL Allergy BV, Citeq BV, Angany Inc, and Thermo Fisher Scientific. The other authors declare that they have no relevant conflicts of interest.
AUTHOR CONTRIBUTIONS
PGJB, MFR, IK, JP and ENCM contributed to epidemiological design. ACK, MFR, BBW, MC, MLK, RD, NGP and TAP coordinated the study. ACK, MFR, BBW, LB, CB, MC, RD, CFP, MJC, MLK, TK, TBM, NGP, TAP, PX and TML contributed to recruitment and clinical investigation of the patients. SAV contributed to immunoCAP IgE testing. PB, IK and JP contributed to database design. IK, JP and SAL contributed to data cleaning. SAL contributed to statistical data analyses and writing of the manuscript. PMJW, TML, ACK and RvR contributed to supervision of the statistical data analyses and writing of the manuscript. ACK, PGJB, MFR, BBW, LB, CB, MC, RD, CFP, MJC, MLK, TK, IK, TBM, HvOM, NGP, TAP, JP, PMJW, PX, SAV, ENCM, RvR and TML reviewed the manuscript.
Supporting information
Table S1‐5
ACKNOWLEDGMENTS
We would like to thank all the patients for their participation in the study. We acknowledge the support of the EuroPrevall project by the EU (grant FP6‐FOOD‐CT‐2005‐514000).
Lyons SA, Knulst AC, Burney PGJ, et al. Predicting food allergy: The value of patient history reinforced. Allergy.2021;76:1454–1462. 10.1111/all.14583
REFERENCES
- 1. Burney PG, Potts J, Kummeling I, et al. The prevalence and distribution of food sensitization in European adults. Allergy. 2014;69(3):365‐371. [DOI] [PubMed] [Google Scholar]
- 2. Lyons SA, Clausen M, Knulst AC, et al. Prevalence of food sensitization and food allergy in children across Europe. J Allergy Clin Immunol Pract. 2020;8(8):2736‐2746.e9. [DOI] [PubMed] [Google Scholar]
- 3. Lyons SA, Burney PGJ, Ballmer‐Weber BK, et al. Food allergy in adults: substantial variation in prevalence and causative foods across Europe. J Allergy Clin Immunol Pract. 2019;7(6):1920‐1928.e11. [DOI] [PubMed] [Google Scholar]
- 4. Muraro A, Werfel T, Hoffmann‐Sommergruber K, et al. EAACI food allergy and anaphylaxis guidelines: diagnosis and management of food allergy. Allergy. 2014;69(8):1008‐1025. [DOI] [PubMed] [Google Scholar]
- 5. Skypala IJ, Venter C, Meyer R, et al. The development of a standardised diet history tool to support the diagnosis of food allergy. Clin Transl Allergy. 2015;5:7. [DOI] [PMC free article] [PubMed] [Google Scholar]
- 6. Kummeling I, Mills EN, Clausen M, et al. The EuroPrevall surveys on the prevalence of food allergies in children and adults: background and study methodology. Allergy. 2009;64(10):1493‐1497. [DOI] [PubMed] [Google Scholar]
- 7. Burney PG, Luczynska C, Chinn S, Jarvis D. The European community respiratory health survey. Eur Respir J. 1994;7(5):954‐960. [DOI] [PubMed] [Google Scholar]
- 8. Tibshirani R. Regression shrinkage and selection via the Lasso. J Roy Stat Soc B. 1996;58(1):267‐288. [Google Scholar]
- 9. Sicherer SH, Sampson HA. Food allergy: a review and update on epidemiology, pathogenesis, diagnosis, prevention, and management. J Allergy Clin Immunol. 2018;141(1):41‐58. [DOI] [PubMed] [Google Scholar]
- 10. Sampson HA. Food allergy–accurately identifying clinical reactivity. Allergy. 2005;60(Suppl. 79):19‐24. [DOI] [PubMed] [Google Scholar]
- 11. Turner PJ, Baumert JL, Beyer K, et al. Can we identify patients at risk of life‐threatening allergic reactions to food? Allergy. 2016;71(9):1241‐1255. [DOI] [PubMed] [Google Scholar]
- 12. Amlot PL, Kemeny DM, Zachary C, Parkes P, Lessof MH. Oral allergy syndrome (OAS): symptoms of IgE‐mediated hypersensitivity to foods. Clin Allergy. 1987;17(1):33‐42. [DOI] [PubMed] [Google Scholar]
- 13. Werfel T, Asero R, Ballmer‐Weber BK, et al. Position paper of the EAACI: food allergy due to immunological cross‐reactions with common inhalant allergens. Allergy. 2015;70(9):1079‐1090. [DOI] [PubMed] [Google Scholar]
- 14. Lyons SA, Dijk AMV, Knulst AC, Alquati E, Le TM, Os‐Medendorp HV. Dietary interventions in pollen‐related food allergy. Nutrients. 2018;10(10):1520. [DOI] [PMC free article] [PubMed] [Google Scholar]
- 15. DunnGalvin A, Daly D, Cullinane C, et al. Highly accurate prediction of food challenge outcome using routinely available clinical data. J Allergy Clin Immunol. 2011;127(3):633‐639.e3. [DOI] [PubMed] [Google Scholar]
- 16. Klemans RJ, Broekman HC, Knol EF, et al. Ara h 2 is the best predictor for peanut allergy in adults. J Allergy Clin Immunol Pract. 2013;1(6):632‐638.e1. [DOI] [PubMed] [Google Scholar]
Associated Data
This section collects any data citations, data availability statements, or supplementary materials included in this article.
Supplementary Materials
Table S1‐5