

Abstract
Aim
Pharmacologic effects were analysed to determine a dose recommendation for oseltamivir in immunocompromised (IC) adults with influenza.
Methods
Quantitative clinical pharmacology methods were applied to data from 160 adult IC patients (aged 18‐78 years) from two studies (NV20234, 150 patients; NV25118, 10 patients) who received oseltamivir 75‐200 mg twice daily for up to 10 days. An established population‐pharmacokinetic (PK) model with additional effects on oseltamivir and oseltamivir carboxylate (OC) clearance described the PK characteristics of oseltamivir in IC patients versus otherwise healthy (OwH) patients from previous clinical trials. Estimated PK parameters were used to evaluate exposure‐response relationships for virologic endpoints (time to cessation of viral shedding, viral load measures and treatment‐emergent resistance). A drug‐disease model characterized the viral kinetics of influenza accounting for the effect of OC on viral production.
Results
Oseltamivir clearance was 32.5% lower (95% confidence interval [CI], 26.1‐38.8) and OC clearance was 33.7% lower (95% CI, 23.2‐44.1) in IC versus OwH patients. No notable exposure‐response relationships were identified for exposures higher than those achieved after conventional dose oseltamivir 75 mg, which appeared to be close to the maximum effect of oseltamivir. Simulations of the drug‐disease model predicted that initiating treatment within 48 hours of symptom onset had maximum impact, and a treatment duration of 10 days was favourable over 3‐5 days to limit viral rebound.
Conclusions
Our findings support the use of conventional‐dose oseltamivir 75 mg twice daily for 10 days in the treatment of IC adult patients with influenza.
Keywords: clinical trials, immunosuppression, modelling and simulation, pharmacokinetic‐pharmacodynamic, population analysis
What is already known about this subject
Compared with otherwise healthy patients, immunocompromised patients are at greater risk of developing complications from influenza infections and are more prone to viral resistance and prolonged viral shedding.
Oseltamivir is approved globally for the treatment of influenza infection at a recommended dose in adults of 75 mg twice daily for 5 days. Extensive research has been undertaken to evaluate the pharmacologic effects of oseltamivir and its active metabolite, oseltamivir carboxylate, in immunocompetent patients.
There is limited information on the pharmacologic properties of oseltamivir in immunocompromised patients. We applied different quantitative clinical pharmacologic methods to optimize the dosing regimen for oseltamivir in immunocompromised adults.
What this study adds
In immunocompromised patients, clearance of oseltamivir was 32.5% lower (95% CI, 26.1‐38.8) and clearance of oseltamivir carboxylate was 33.7% lower (95% CI, 23.2‐44.1), compared with otherwise healthy patients.
Pharmacologic methods applied showed limited benefit when increasing the dose of oseltamivir from 75 to 150 mg twice daily in immunocompromised adult patients. Early treatment initiation maximizes the impact of oseltamivir and prolonged treatment duration limits viral rebound.
Taken together with clinical findings, our data support the use of conventional‐dose oseltamivir 75 mg twice daily for 10 days in the treatment of immunocompromised adult patients with influenza.
1. INTRODUCTION
Immunocompromised (IC) patients experience an increased duration of viral shedding, are more prone to viral resistance and are at greater risk of developing complications from influenza infections than patients who are otherwise healthy (OwH), with associated mortality rates of 25‐40% in untreated organ transplant recipients. 1 , 2 , 3 , 4 Oseltamivir is approved globally for the treatment and prophylaxis of influenza infection (recommended dose in adults: 75 mg twice daily for 5 days [treatment] or once daily for 10 days [prophylaxis]). 5 , 6 The phase 3b, randomized, double‐blind NV20234 trial (ClinicalTrials.gov identifier NCT00545532) evaluated conventional‐dose oseltamivir (75 mg twice daily orally in adults, adolescents and adjusted for age and body weight for children <13 years) versus double‐dose oseltamivir (150 mg twice daily orally, adjusted for age and body weight for children <13 years), for an extended dosing period of 10 days in IC patients with influenza, 7 given the prolonged viral shedding reported in these patients. 2 Oseltamivir was well tolerated in this patient population, but there was a trend toward better safety/tolerability with the conventional dose versus the double dose. 7 The time to alleviation of symptoms (TTAS) was similar between the groups, although the study was not designed to assess differences in efficacy between the doses. The effects of an increased dose of oseltamivir were also investigated in study NV25118 (ClinicalTrials.gov identifier NCT01050257), which enrolled IC and immunocompetent patients aged ≥13 years; oseltamivir was administered for a minimum of 3 days in either 100‐mg or 200‐mg doses intravenously (iv) every 12 hours. Although the NV20234 and NV25118 studies included some paediatric patients, the focus of this current article is adult patients aged ≥18 years.
The prodrug oseltamivir is rapidly absorbed from the gastrointestinal tract and hepatically metabolized to the active form oseltamivir carboxylase (OC), a stable and selective inhibitor of influenza A and B neuraminidase enzymes. 8 There has been extensive evaluation of the population pharmacokinetic (PK) profiles of oseltamivir and OC in immunocompetent patients. 9 , 10 , 11 Additionally, a drug‐disease model describing the effect of oseltamivir inhibition on influenza progression in an immunocompetent population has been reported, 12 and the PK/pharmacodynamic (PD) relationship of oseltamivir has been described in healthy volunteers. 13 However, there is limited information on the PK and PK/PD of oseltamivir in IC patients. Therefore, quantitative clinical pharmacology methods were applied to data from IC adult patients.
We evaluated conventional‐dose (75 mg twice daily) or double‐dose (150 mg twice daily) oseltamivir for 10 days to determine a dose recommendation for treatment of IC adults with influenza. In particular, the objectives of this analysis were to: describe the PK of oseltamivir in IC adult patients and compare with exposure data from OwH patients, evaluate the pharmacologic response to oseltamivir in IC patients by using exposure‐response analysis to measure virologic endpoints and evaluate the antiviral treatment effect of oseltamivir in IC patients via the development of a drug‐disease viral kinetics (VK) model. The current disease model does not include clinical symptoms, as the relationship between virologic endpoints and symptoms is not well characterized, especially in naturally acquired influenza where the time of infection and inoculum size are unknown.
2. METHODS
2.1. Clinical studies and samples
This analysis included data from two clinical studies of oseltamivir (Table 1). Study NV20234 was a randomized, double‐blind, multicenter study of conventional‐dose (75 mg twice daily) versus double‐dose (150 mg twice daily) oseltamivir, or equivalent for children, for the treatment of influenza in 228 IC adults and children for an extended 10‐day period; eligibility criteria have been described previously. 7 Using a sparse sampling strategy, plasma samples for PK assessment were collected from patients who consented to participate at steady state no earlier than day 6 (ie, not before the 11th dose) consisting of four time points: within 30 minutes before dose administration and 1.5 ± 0.5, 4 ± 1 and 8 ± 1.5 hours after dosing. For virology sampling, two nasopharyngeal and one throat swab were collected from all patients on day 1 (pretreatment), day 2 or 3, day 6, day 8, day 11 (end of treatment) and follow‐up days 15 and 40. All swabs were tested centrally for influenza A or B riboncleic acid using reverse transcriptase‐polymerase chain reaction (RT‐PCR). A value of ≤2.6 log10 viral particles (vp)/mL for influenza A and ≤3.0 log10 vp/mL for influenza B strains was interpreted as a negative result.
TABLE 1.
Baseline demographic and clinical characteristics of immunocompromised patients
| Population PK a | PK/PD a | Disease modelling | |||
|---|---|---|---|---|---|
| Characteristic | NV20234 (n = 26) b | NV25118 (n = 10) | NV20234 (n = 20) | NV25118 (n = 6) | NV20234 and NV25118 (n = 156) |
| Male, n (%) | 15 (58) | 4 (40) | 10 (50) | 4 (67) | 78 (50) |
| Median (range) age, yr | 44.5 (4, 78) | 53 (33, 69) | 47.5 (29, 73) | 57.5 (40, 69) | 47 (18, 90) |
| Median (range) weight, kg | 77.0 (18.0, 105) | 84.3 (54.1, 105) | 79.0 (48.0, 105) | 84.3 (75.3, 105) | 74.2 (39.5, 140) |
| Transplant patient, n (%) | 16 (62) | 0 | 15 (75) | 0 | 78 (50) c |
| Stem cell transplant | 2 (8) | 0 | 1 (5) | 0 | 26 (17) |
| Kidney transplant | 14 (54) | 0 | 14 (70) | 0 | 51 (33) |
| Median (range) creatinine clearance, mL/min | 83.4 (50.4, 229) | 126 (47.6, 166) | 73.5 (51.3, 123) | 119 (47.6, 150) | 67.3 (27.7, 156) |
Abbreviations: PD, pharmacodynamics; PK, pharmacokinetics.
Patient data from studies NV20234 and NV25118 were used in separate analyses.
Includes four paediatric patients.
Includes one patient with a liver transplant.
The population PK and exposure‐response analyses of study NV20234 were supported by additional analysis of patients from study NV25118. For disease modelling, patient data from studies NV20234 and NV25118 were combined. Study NV25118 was a randomized, multicenter, parallel‐group study of iv/oral oseltamivir (100‐ or 200‐mg iv infusion every 12 hours for 5 days with the option of oral administration (150 mg twice daily) after six iv infusions) in adult and adolescent patients, some of whom were IC. Samples for PK analysis were collected on day 1 (within 15 minutes before dosing, and 1, 2, 3.5, 9 and 12 hours after dosing) and on day 3 or 4 (within 15 minutes before dosing, and 2, 3.5, 9 and 12 hours after dosing). Two nasopharyngeal and one throat swab were collected at each scheduled time point. Swabs were collected within 6 hours before dosing at baseline and within 12 hours after dosing on days 4, 6, 11, 15 and 30. All swabs were analysed by RT‐PCR and viral resistance monitoring. A value of ≤2.6 log10 vp/mL was interpreted as a negative result.
Both studies were approved by applicable institutional review boards/ethics committees and conducted in accordance with country regulations, the International Conference on Harmonisation Good Clinical Practice guidelines, and the principles of the Declaration of Helsinki. Written informed consent was obtained from all patients.
The population PK analysis included concentration‐time data for oseltamivir and OC from IC patients in study NV20234 compared with previous clinical data from oseltamivir studies in OwH patients (WV15670, WV15671 and WP16263) who received 75 to 450 mg twice daily doses of oseltamivir. 14 , 15 , 16 , 17 Concentrations of oseltamivir and its metabolite in plasma were measured simultaneously using a validated liquid chromatography tandem mass spectrometry method (calibration range used for NV20234: 1.0‐500 ng/mL for oseltamivir and 10.0‐5000 ng/mL for OC; calibration range used for NV25118, WV15670, WV15671 and WP16263: 1.0‐250 ng/mL for oseltamivir and 10.0‐10 000 ng/mL for OC). Exposure‐response and drug‐disease analyses included RT‐PCR‐derived viral load data from studies NV20234 and NV25118. Exposure of patients from study NV25118 was computed using the model developed earlier. 10
2.2. Population PK model
Population PK analysis was conducted based on the established nonlinear mixed‐effects model 10 using NONMEM version 7.3.0. 18 Sparse sampling (204 oseltamivir and OC observations from 26 patients) was considered insufficient for developing a de novo model. Therefore, established population PK models were tested, initially with all model parameters fixed to prior estimates. External validation indicated that the observed data were under‐predicted by all prior models. Thus, the current model allowed the study effects on clearance to account for differences between IC and OwH patients. As a result, all model parameters were fixed to the prior estimates, but additional study effects on oseltamivir and OC clearances were introduced to describe PK differences between OwH patients from the earlier analyses and IC patients of the current analysis. Model evaluation included an extensive set of diagnostic plots, including the visual predictive check (VPC) 19 and nonparametric bootstrap with 1000 replications (as implemented in NONMEM software).
The population PK model and nominal dosing history were used to estimate the individual PK model parameters and compute the following steady‐state exposure measures for oseltamivir and OC: C max, C min and AUC0‐12. Exposure estimates in IC adults from study NV20234 were compared with exposure estimates in OwH adults treated with 75, 150, 225 and 450 mg twice daily oseltamivir in previous clinical trials (WV15670, WV15671 and WP16263). Studies WV15670 and WV15671 were pivotal studies which evaluated the 75 mg twice daily and 150 mg twice daily doses. The 150 mg twice daily dose was only evaluated in those two studies. Study WP16263 was selected as this QT study investigated a broad range of doses (75, 225 and 450 mg twice daily oseltamivir) in a large number of adults (93‐99 adults per dose).
Individual dose‐normalized OC exposure estimates following administration of 100 and 200 mg twice daily oseltamivir in study NV25118 were summarized and compared for IC and OwH patients.
2.3. Exposure‐response analysis
Predicted OC steady‐state exposure measures (C min,OC and AUC12h,OC) were highly correlated, therefore only C min,OC was used for exposure‐response analysis for the following PD endpoints: time to cessation of viral shedding (TTCVS) based on RT‐PCR and culture data (Kaplan‐Meier and semi‐parametric Cox proportional‐hazards model analyses), viral load/titre measures (AUCs and peak viral load/titres based on RT‐PCR and culture data, regression analyses), longitudinal VK using absolute values and change from baseline for viral load by RT‐PCR and viral titre by culture (graphical exploration with exposure bins) and treatment‐emergent resistance (genotypic/phenotypic, logistic regression). Time to cessation of viral shedding was defined as the time from treatment initiation to the time of first negative result from RT‐PCR and culture with no subsequent positive results. For RT‐PCR, a value below the limit of quantification was interpreted as a negative result and for culture a value of ≤0.5 for log10 TCID50 was interpreted as a negative result. Patients withdrawn from the study were treated as censored observations.
2.4. Disease model
A generalized stepwise approach was used to develop the influenza VK and drug inhibition model, including the initial characterization of the structural base model and exploration of covariate effects that may explain random variability. Influenza VK were characterized using an established target cell‐limited, three‐compartment model representing uninfected target epithelial cells, infected cells and pool of free virus. 12 Observed viral load was implemented into the free virus compartment. The antiviral effect of oseltamivir was modelled according to its known mechanism of action for rate of viral production (p) inhibition (INH) and was described by the following equations 12 :
where AUC is the area under the concentration‐time curve for OC within a dosing interval at steady state, AUC50 is the exposure at half‐maximal inhibition and pNT is the rate of free virus production in the absence of drug inhibition. Post hoc individual estimates for the AUC of OC were derived from the independent population PK model described above. The INH effect was implemented only for the treatment duration and was negated before and after the dosing period. Thus, in the absence of treatment, p is defined by pNT (where INH = 0).
The following assumptions were made to accommodate physiologic or pharmacologic plausibility: the initial number of uninfected target epithelial cells was 4 × 10⁸ cells, based on known respiratory physiology in healthy human adults, 20 the initial conditions for infected cells were 0 cells and for free virus was 1 vp/mL, and drug inhibition was driven by predicted exposures (AUC) for OC. A key assumption was defining the time of infection, which was unknown for patients in the present study. A +36‐hour empirical time shift was assumed based on an exploratory evaluation and on the observation that 36 hours were required for the onset of positive viral titres and symptoms in human challenge studies. 12 , 21 This assumption was further refined by testing different time shifts (12, 24, 36 and 48 hours) and comparing the model outcomes via a sensitivity analysis. Pre‐ and post‐treatment viral load‐time data were simultaneously analysed using nonlinear mixed‐effects modelling (MONOLIX Suite 2016R1; Lixoft, France). Data analyses were performed using the stochastic approximation expectation maximization estimation method with importance sampling to calculate −2 × log‐likelihood.
The following covariates were considered as pharmacologically relevant for further exploration of the VK in IC patients: transplant status, corticosteroid use, viral strain type, vaccination status and lymphocyte count. Formal assessment of covariate effects was considered only if a strong relationship was visually apparent between random effects and covariates, with no significant shrinkage (η shrinkage < 35%) in the estimated random effects.
A VPC was used to evaluate the performance of the disease model, in which 500 datasets were simulated in MONOLIX using the original data as a template. For each replicate dataset, the median, 5th and 95th percentiles were calculated. These summary percentiles were used to compute the 90% prediction interval and plotted as shaded areas on the VPC graph, which was compared with the corresponding median, 5th and 95th percentiles from the observed data.
Monte Carlo simulations were performed (mrgsolve package; R version 3.3.1) to investigate the impact of dose, therapy initiation and treatment duration on influenza VK. The total number of patients in each replicate dataset was 156 (NV20234, n = 150; NV25118, n = 6). Clinical trial simulations (250 replicates) were performed using the final parameter estimates from the base VK model. For each of the above simulation scenarios, median, 5th and 95th percentiles were calculated and plotted as median curves with shaded 90% prediction intervals.
3. RESULTS
3.1. Population PK analysis
The population PK analysis dataset included 101 oseltamivir and 103 OC quantifiable plasma concentrations collected from 26 IC patients in study NV20234 (adults ≥18 years, n = 22; children <18 years, n = 4). Paediatric patients were included in this analysis as defined in the NV20234 study protocol. Eleven patients received conventional‐dose oseltamivir and 15 received double‐dose oseltamivir; patient characteristics are shown in Table 1. Just over half of the patients (14/26 [54%]) had undergone a kidney transplant. Overall, patients had mild renal impairment (median creatinine clearance [CLCR] 83.4 mL/min). The original model 10 did not include weight explicitly. Implicitly, dependence of CL, CLM and oseltamivir to OC metabolism rate constant (k met) on weight were incorporated using CLCR that correlated with weight. CLCR was calculated using the Cockcroft‐Gault formula for adults and the revised Schwartz formula for paediatrics (0.55*height [cm]/serum creatinine [mg/dL]). Model code included additional adjustment for obesity and lean bodyweight, 22 as described in Gibiansky et al. 10
Goodness‐of‐fit plots of the population PK model did not reveal any deficiencies, indicating that the model adequately described oseltamivir and OC PK profiles in IC patients (Supporting Information Figure S1); this observation was confirmed by VPC (Figure S2). Oseltamivir clearance was estimated as 32.5% (95% asymptotic confidence interval [CI], 26.1‐38.8; 95% bootstrap CI, 16.9‐45.3) lower and OC clearance was estimated as 33.7% (95% asymptotic CI, 23.2‐44.1; 95% bootstrap CI, 35.2‐42.0) lower in IC patients than in OwH patients; the reduction in OC clearance corresponded to an increase in steady‐state AUC for OC of 50.8% (95% CI, 30.2‐78.9). Shrinkage of random effects on oseltamivir clearance and OC clearance were less than 3%, justifying the use of post hoc estimates of exposure for exposure‐response analyses.
Predicted population PK parameters for oseltamivir and OC in the 22 IC adult patients from study NV20234 are presented in Table 2 according to dose group. Oseltamivir and OC exposures in adults were ~2‐fold higher in the double‐dose group compared with the conventional‐dose group, confirming linearity of oseltamivir PK.
TABLE 2.
Summaries of individual predicted steady‐state exposure parameters for oseltamivir and oseltamivir carboxylate in immunocompromised adult patients by oseltamivir dose (study NV20234)
| Parameter | Oseltamivir (mean ± SD) | Oseltamivir carboxylate (mean ± SD) | ||
|---|---|---|---|---|
| 75 mg twice daily (n = 9) | 150 mg twice daily (n = 13) | 75 mg twice daily (n = 9) | 150 mg twice daily (n = 13) | |
| C max, ng/mL | 65.5 ± 26.8 | 149 ± 80.7 | 655 ± 276 | 1,420 ± 574 |
| C min, ng/mL | 2.33 ± 0.641 | 6.98 ± 5.1 | 363 ± 167 | 831 ± 358 |
| AUC0‐12, ng.h/mL | 197 ± 49.7 | 501 ± 320 | 6,240 ± 2,710 | 13,800 ± 5,670 |
| T max, h | 1.08 ± 0.484 | 1.08 ± 0.504 | 3.83 ± 1.08 | 3.96 ± 0.841 |
AUC0‐12, area under the concentration‐time curve between 0 and 12 hours; C max, maximum concentration of drug in plasma; C min, minimum concentration of drug in plasma; SD, standard deviation; T max, time to reach maximum concentration of drug in plasma.
Oseltamivir and OC exposures (AUC) were higher in IC adult patients than in OwH patients based on previous clinical data (Figure 1). 14 , 15 , 16 , 17 OC exposure (AUC) was ~2‐fold higher in IC adult patients versus OwH patients; ~50% of the exposure difference could be attributed to lower estimated CLCR in IC patients (median CLCR: 83.4 mL/min) and ~50% to additional lower OC clearance due to factors other than reduced renal clearance. An increased exposure of OC in IC patients was also observed for patients of study NV25118, in which dose‐normalized exposure values for OC were ~20% higher in IC patients (n = 10) than in OwH patients (n = 84). There were no transplant recipients, and most of the patients in study NV25118 had normal renal function (median CLCR 126 mL/min; Table 1).
FIGURE 1.
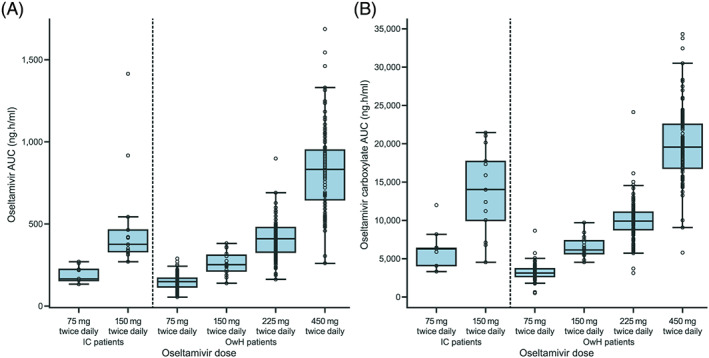
(A) Oseltamivir and (B) oseltamivir carboxylate exposure (0‐12 hours) at steady state in immunocompromised adult patients (study N20234, n = 22) and previous clinical data from otherwise healthy patients (n = 306 11 , 12 , 13 , 14 ). Median values are designated by black lines in the center of the boxes; boxes indicate the IQR and whiskers represent 1.5 × IQR. AUC, area under the curve; IC, immunocompromised; IQR, interquartile range; OwH, otherwise healthy
3.2. Exposure‐response analysis
Of the 26 IC patients with PK data in study NV20234, 24 (adults, n = 20; children, n = 4) had evaluable PD data; the exposure‐response analysis included data from the 20 adult patients. Baseline demographic data are displayed in Table 1. Predicted steady‐state exposure measures (C min and AUC0‐12) for OC were highly correlated (R = 0.986), therefore C min was used for exposure‐response analyses. No notable exposure (C min,OC)‐response relationships were found for any of the PD variables examined: time‐to‐event Kaplan‐Meier analyses (for cessation of viral shedding, see Figure 2A) or Cox proportional‐hazard model analyses; regression analyses (log scale) of viral load/titre measures, including AUC (Figure 2B), or peak viral load based on RT‐PCR, or longitudinal analyses of viral load/titre (data not shown). There were only two patients who underwent PK assessments who also had treatment‐emergent resistance (one patient had both phenotypic and genotypic resistance) and these patients had lower than median OC exposure. An exploratory analysis of the PK‐PD relationship in all adult patients (n = 139; data were imputed from the PK model for patients without available PK data) did not reveal any other exposure‐response relationships.
FIGURE 2.

(A) Kaplan‐Meier plot for time to cessation of viral shedding (RT‐PCR) by exposure category defined by oseltamivir carboxylate C min and (B) oseltamivir carboxylate exposure versus response for viral load (RT‐PCR). C min, minimum plasma concentration; OC, oseltamivir carboxylate; RT‐PCR, reverse transcriptase‐polymerase chain reaction
3.3. Disease model
Observed data from 156 IC adult patients (NV20234, n = 150; NV25118, n = 6) were used to develop the disease model (male 50%, median age 47 years [range, 18‐90], median weight 74.2 kg [range, 39.5‐140]; Table 1). A total of 978 viral load observations measured by RT‐PCR were included in the analysis, of which 526 (54%) were reported as below the limit of quantification (≤2.6 log10 vp/mL for influenza A; ≤3.0 log10 vp/mL for influenza B).
The model adequately described the viral load observed time course in IC adult patients for both treatment‐naïve and post‐treatment data, and the predictive performance was confirmed by VPC (Supporting Information Figure S3). The resulting drug‐disease parameters from the model were reasonable. Between‐subject variability was elevated for both disease and drug parameters, especially for target cell infection rate (148%), rate of free virus production in the absence of drug inhibition (pNT, 130%) and AUC50 (289%). Relative standard error of model parameters was generally below 20%, with the exception of target cell infection rate (43%), AUC50 (47%) and between‐subject variability of clearance (22%; Table 3). No clinically meaningful covariate effects were observed for transplant status, corticosteroid use, viral strain type, vaccination status or lymphocyte count (sample sizes were too small to assess statistical significance).
TABLE 3.
Population parameter estimates for the base model describing viral kinetics and oseltamivir pharmacodynamics in immunocompromised adults
| Parameter | Parameter description | Unit | Estimate (% RSE) | Bootstrap 90% CI (n = 200 replicates) |
|---|---|---|---|---|
| β | Target cell infection rate | (vp/mL)−1 day−1 | 3.54 × 10⁻⁵ (43) | 2.02 × 10⁻⁵‐6.02 × 10⁻⁵ |
| pNT | Viral production rate | (vp/mL) day−1 | 0.069 (19) | 0.0426‐0.117 |
| c | Viral clearance rate | Day−1 | 2.24 (9) | 1.52‐3.18 |
| δ | Infected cell clearance rate | Day−1 | 1.09 (3) | 1.02‐1.33 |
| Drug parameters | ||||
| AUC50 | Drug sensitivity on p inhibition | ng.h/mL | 202 (47) | 17.1‐642 |
| Random effect parameters | ||||
| BSVβ | Between‐subject variability of β | CV | 1.48 (17) | 0.969‐1.93 |
| BSVpNT | Between‐subject variability of pNT | CV | 1.30 (11) | 0.749‐1.67 |
| BSVc | Between‐subject variability of c | CV | 0.643 (22) | 0.484‐0.788 |
| BSVδ | Between‐subject variability of δ | CV | 0.381 (7) | 0.317‐0.499 |
| BSVAUC50 | Between‐subject variability of AUC50 | CV | 2.89 (13) | 1.61‐4.57 |
| σ error | Proportional error (log‐additive) | CV | 0.967 (4) | 0.941‐1.01 |
Abbreviations: AUC50, area under the curve at half‐maximal inhibition; BSV, between subject variability; CI, confidence interval; CV, coefficient of variation; pNT, the rate of free virus production in the absence of drug inhibition; RSE, relative standard error.
Clinical trial simulation (250 replicates) was performed using the model parameters to assess the impact of dose, time of initiation of oseltamivir and treatment duration. The 75‐mg dose produced similar VK to the 150‐mg dosing regimen. A treatment effect for oseltamivir is suggested with a shorter duration of viral shedding of approximately 2.5‐3 days in oseltamivir‐treated versus nontreated IC patients (Figure 3A). Starting treatment 2 days after symptom onset caused a more rapid decline in viral load relative to treatment start after 4, 7 or 10 days (75 mg twice daily; Figure 3B); a treatment duration of 10 days protected against viral regrowth, which occurred with shorter treatment durations of 3 or 5 days (75 mg twice daily; Figure 3C).
FIGURE 3.

Disease modelling simulation results showing the impact of (A) dose, (B) time from onset of symptoms to treatment initiation and (C) duration of treatment on viral load (RT‐PCR). The median AUC estimate for oseltamivir carboxylate was 5,360 ng.H/mL after 75‐mg dosing (and 10, 550 ng.H/mL after 150‐mg dosing for (A). Lines show the median percentile with shaded areas representing the 90% prediction intervals. The horizontal dashed line defines the median lower limit of quantitation (2.8 log10 vp/mL) for influenza A and B viral strains. For (A) and (C), treatment was assumed to start at 2 days after symptom onset and infection was assumed to occur 36 hours before the onset of symptoms. RT‐PCR, reverse transcriptase‐polymerase chain reaction; vp, viral particles
4. DISCUSSION
Study NV20234 is the largest study to date in IC patients with influenza treated with oseltamivir. We aimed to determine whether increasing the oseltamivir dose, over the conventional dosing regimen, would be beneficial to IC patients with influenza.
We used an established population PK model 10 to characterize the disposition of oseltamivir and OC in IC patients with influenza in study NV20234, which formed the vast majority of the dataset, and study NV25118, which was combined with data from NV20234 for disease modelling, but otherwise used in separate supportive analyses. In both studies, IC patients had greater exposure to oseltamivir than OwH patients. In study NV20234, mean and geometric mean OC exposure (C min and AUC0‐12) were approximately twice as high in IC adult patients as in OwH patients. In the final population PK model for NV20234, oseltamivir clearance was estimated to be 0.675 (95% CI, 0.612‐0.739) and OC clearance was estimated to be 0.663 (95% CI, 0.559‐0.768) of the corresponding values in the prior model. This reduction in OC clearance corresponds to the increase of steady‐state AUCOC by 50.8% (95% CI, 30.2‐78.9). Thus, approximately half of the observed difference in exposure can be attributed to additional lower OC clearance estimated for IC patients from this study due to factors other than reduced renal clearance and the other half to lower than normal estimated creatinine clearance in IC patients, several of whom had renal transplants. The former could be associated with the overall burden of comorbidities in IC patients. There are limited published data on the PK profile of oseltamivir in IC patients to compare our results with. 23 , 24 Lam et al concluded that PK parameters were not different between IC and immunocompetent adults, 23 whereas Seo et al stated that the small number of IC patients precluded any conclusions regarding potential differences in PK parameters in IC patients. 24
Regarding the exposure‐response analyses for IC adult patients in NV20234, no notable relationships were identified for any of the efficacy or PD variables examined (eg, TTAS, TTCVS or viral load/titre), although the modest sample size is acknowledged. In the current analyses, both conventional (75 mg twice daily) and double (150 mg twice daily) dosing were considered to be close to the maximum effect of oseltamivir for virologic endpoints (ie, at the plateau of the exposure‐response curve), and the results suggest that doubling the oseltamivir dose had little additional treatment benefit in terms of reduced duration of viral shedding. Thus, it does not appear that increasing the dose of oseltamivir provides a meaningful incremental benefit on virologic endpoints in IC patients.
Two patients (conventional‐dose group) who underwent PK assessments developed treatment‐emergent oseltamivir resistance; both patients had lower than median OC exposure, but still above inhibitory concentrations (IC95 values) for a range of influenza virus strains. However, the very small number of patients with resistance limits data interpretation.
As an exploratory approach to conduct the exposure‐response analyses on a larger dataset, the population PK model was used to estimate OC exposures in all IC adult patients from study NV20234 (n = 139), including those for whom no PK samples were collected. This additional analysis also did not reveal any exposure‐response relationships.
Furthermore, we developed a disease model to characterize the VK of influenza and oseltamivir inhibition effect in IC patients in NV20234 and to investigate different duration of treatment. This analysis showed that double‐dose oseltamivir had a limited additional effect on VK compared with conventional dosing, and early initiation (within 48 h) of oseltamivir after onset of influenza symptoms maximized the effect on VK. This is consistent with previous research demonstrating the benefit of early oseltamivir administration for the treatment of influenza. 25 Early initiation of oseltamivir within 48 hours of symptom onset is recommended in the label 5 , 6 as well as by the European Centre for Disease Prevention and Control, Public Health England, and the Centers for Disease Control and Prevention (CDC). 26 , 27 , 28 Furthermore, disease modelling suggested a treatment effect of 2.5‐3 days' shorter duration of viral shedding for treated versus nontreated patients, which is consistent with previous literature. 29 , 30 , 31 The disease model analysis also showed that a prolonged treatment duration of 10 days (compared with a 3‐day or conventional 5‐day treatment duration) limited the extent of predicted viral rebound, which is in line with guidance from the CDC 28 and the World Health Organization 32 advocating the consideration of longer antiviral treatment regimens in IC patients or cases of severe/complicated influenza, particularly due to prolonged viral shedding in these patients. 33 , 34 Some studies have suggested that an increased duration of viral shedding is seen in paediatric patients compared with adult patients. 35 , 36 Thus, a treatment duration of up to 20 days with oseltamivir in severely IC paediatric patients was evaluated with data from this study (patients aged <18 years) and study NV25719 (ClinicalTrials.gov identifier NCT01715909; patients aged ≤13 years). 37
These population PK/PD and drug‐disease modelling analyses of oseltamivir were performed using the most substantial dataset of IC patients to date, derived from two different studies. In addition, a strength of the disease model is the range of treatment initiation times (up to 96 hours) from onset of symptoms to provide a range of pretreatment time points for PD data. However, some limitations should be noted: data on time of infection were not available, as is typical of community‐acquired influenza (so 36 hours before symptom onset was assumed and evaluated via sensitivity analysis), and the analysis did not include a placebo group, which was omitted for ethical reasons as neuraminidase inhibitor therapy is recommended in treatment guidelines for IC patients. Also, a relatively small number of patients had PK data, but this was to reduce complexity and maximize recruitment for this challenging‐to‐recruit patient population. Finally, we did not include data on symptoms in our analysis, as the relationship between virologic endpoints and symptoms is not well characterized. Further research would be required to address these limitations.
In conclusion, the different quantitative pharmacologic methods applied showed a limited benefit when increasing the dose of oseltamivir from 75 to 150 mg twice daily in IC adult patients, and indicated that early treatment initiation maximizes the impact on VK while prolonged treatment duration limits viral rebound. Taken together with the clinical findings from study NV20234, these pharmacologic analyses support the use of conventional‐dose oseltamivir 75 mg twice daily for 10 days in the treatment of IC adult patients.
COMPETING INTERESTS
S.S., A.L., E.Z. and C.N.‐M. are employees of F. Hoffmann‐La Roche Ltd. K.P., R.B. and P.F.S. are employees of Certara and received consultancy fees from Roche for these analyses. L.G. is the owner of QuantPharm LLC and received consultancy fees from Roche for these analyses. S.D. is a former employee of F. Hoffmann‐La Roche Ltd. P.R. is a former employee of F. Hoffman‐La Roche Ltd. and a current employee of Pfizer and hold stocks at F. Hoffman‐La Roche.
CONTRIBUTORS
S.S., L.G., R.B., P.F.S, E.Z. and P.R. contributed to the design, analysis and interpretation of the study. A.L. and K.P. contributed to the analysis and interpretation of data. S.D. contributed to the acquisition of data. C.N.‐M. contributed to the interpretation of data.
Supporting information
SUPPORTING INFORMATION FIGURE S1 Goodness‐of‐fit plots of the population pharmacokinetic model for (A) oseltamivir and (B) oseltamivir carboxylate
SUPPORTING INFORMATION FIGURE S2 Visual predictive check for the population pharmacokinetic model describing oseltamivir and oseltamivir carboxylate exposure in immunocompromised adults treated with conventional‐dose (A) and double‐dose (B) oseltamivir
SUPPORTING INFORMATION FIGURE S3 Visual predictive checks for the disease model describing influenza viral load versus time after oseltamivir dose administration
ACKNOWLEDGEMENTS
Third‐party medical writing assistance, under the direction of the authors, was provided by Nicole Antonio, PhD, and Ben Castle, of Gardiner‐Caldwell Communications, and was funded by F. Hoffmann‐La Roche Ltd. This study was funded by F. Hoffmann‐La Roche Ltd.
Sturm S, Lemenuel‐Diot A, Patel K, et al. Pharmacologic effects of oseltamivir in immunocompromised adult patients as assessed by population PK/PD analysis and drug‐disease modelling for dosing regimen optimization. Br J Clin Pharmacol. 2021;87:1359–1368. 10.1111/bcp.14523
DATA AVAILABILITY STATEMENT
Qualified researchers may request access to individual patient level data through the clinical study data request platform (https://vivli.org/). Further details on Roche's criteria for eligible studies are available here (https://vivli.org/members/ourmembers/). For further details on Roche's Global Policy on the Sharing of Clinical Information and how to request access to related clinical study documents, see here (https://www.roche.com/research_and_development/who_we_are_how_we_work/clinical_trials/our_commitment_to_data_sharing.htm).
REFERENCES
- 1. Ison MG, Hayden FG. Viral infections in immunocompromised patients: what's new with respiratory viruses? Curr Opin Infect Dis. 2002;15(4):355‐367. [DOI] [PubMed] [Google Scholar]
- 2. Kumar D, Michaels MG, Morris MI, et al. Outcomes from pandemic influenza a H1N1 infection in recipients of solid‐organ transplants: a multicentre cohort study. Lancet Infect Dis. 2010;10:521‐526. [DOI] [PMC free article] [PubMed] [Google Scholar]
- 3. Ison MG. Influenza, including the novel H1N1, in organ transplant patients. Curr Opin Infect Dis. 2010;23(4):365‐373. [DOI] [PubMed] [Google Scholar]
- 4. van der Vries E, Stittelaar KJ, van Amerongen G, et al. Prolonged influenza virus shedding and emergence of antiviral resistance in immunocompromised patients and ferrets. PLoS Pathog. 2013;9(5):e1003343. [DOI] [PMC free article] [PubMed] [Google Scholar]
- 5. Tamiflu (oseltamivir) summary of product characteristics. https://www.ema.europa.eu/en/documents/product-information/tamiflu-epar-product-information_en.pdf. Accessed January 24, 2020.
- 6. Tamiflu (oseltamivir phosphate) U.S. prescribing information. https://www.gene.com/download/pdf/tamiflu_prescribing.pdf. Accessed January 24, 2020.
- 7. Mitha E, Krivan G, Jacobs F, et al. Safety, resistance, and efficacy results from a phase IIIb study of conventional‐ and double‐dose oseltamivir regimens for treatment of influenza in immunocompromised patients. Infect Dis Ther. 2019;8(4):613‐626. [DOI] [PMC free article] [PubMed] [Google Scholar]
- 8. Tamiflu (oseltamivir phosphate) package insert. http://www.fda.gov/downloads/Drugs/DrugSafety/DrugShortages/UCM183850.pdf. Accessed January 24, 2020.
- 9. Kamal MA, Van Wart SA, Rayner CR, et al. Population pharmacokinetics of oseltamivir: pediatrics through geriatrics. Antimicrob Agents Chemother. 2013;57(8):3470‐3477. [DOI] [PMC free article] [PubMed] [Google Scholar]
- 10. Gibiansky L, Giraudon M, Rayner CR, et al. Population pharmacokinetic analysis of oseltamivir and oseltamivir carboxylate following intravenous and oral administration to patients with and without renal impairment. J Pharmacokinet Pharmacodyn. 2015;42(3):225‐236. [DOI] [PubMed] [Google Scholar]
- 11. Rayner CR, Chanu P, Gieschke R, Boak LM, Jonsson EN. Population pharmacokinetics of oseltamivir when coadministered with probenecid. J Clin Pharmacol. 2008;48(8):935‐947. [DOI] [PubMed] [Google Scholar]
- 12. Kamal MA, Gieschke R, Lemenuel‐Diot A, Beauchemin CA, Smith PF, Rayner CR. A drug‐disease model describing the effect of oseltamivir neuraminidase inhibition on influenza virus progression. Antimicrob Agents Chemother. 2015;59(9):5388‐5395. [DOI] [PMC free article] [PubMed] [Google Scholar]
- 13. Rayner CR, Bulik CC, Kamal MA, et al. Pharmacokinetic‐pharmacodynamic determinants of oseltamivir efficacy using data from phase 2 inoculation studies. Antimicrob Agents Chemother. 2013;57(8):3478‐3487. [DOI] [PMC free article] [PubMed] [Google Scholar]
- 14. Nicholson KG, Aoki FY, Osterhaus AD, et al. Efficacy and safety of oseltamivir in treatment of acute influenza: a randomised controlled trial. Lancet. 2000;355(9218):1845‐1850. [DOI] [PubMed] [Google Scholar]
- 15. Treanor JJ, Hayden FG, Vrooman PS, et al. Efficacy and safety of the oral neuraminidase inhibitor oseltamivir in treating acute influenza: a randomized controlled trial. JAMA. 2000;283:1016‐1024. [DOI] [PubMed] [Google Scholar]
- 16. Dutkowski R, Smith JR, Davies BE. Safety and pharmacokinetics of oseltamivir at standard and high dosages. Int J Antimicrob Agents. 2010;35(5):461‐467. [DOI] [PubMed] [Google Scholar]
- 17. He G, Massarella J, Ward P. Clinical pharmacokinetics of the prodrug oseltamivir and its active metabolite Ro 64‐0802. Clin Pharmacokinet. 1999;37(6):471‐484. [DOI] [PubMed] [Google Scholar]
- 18. Beal S, Sheiner LB, Boeckmann A, Bauer RJ. NONMEM User's Guides. (1989‐2019), Icon Development Solutions, Ellicott City, MD, USA. 2019. https://nonmem.iconplc.com/nonmem730/Latest_User_Documents/guides/. Accessed June 30, 2020.
- 19. Yano Y, Beal SL, Sheiner LB. Evaluating pharmacokinetic/pharmacodynamic models using the posterior predictive check. J Pharmacokinet Pharmacodyn. 2001;28(2):171‐192. [DOI] [PubMed] [Google Scholar]
- 20. Menache MG, Hanna LM, Gross EA, et al. Upper respiratory tract surface areas and volumes of laboratory animals and humans: considerations for dosimetry models. J Toxicol Environ Health. 1997;50(5):475‐506. [DOI] [PubMed] [Google Scholar]
- 21. Canini L, Conway JM, Perelson AS, Carrat F. Impact of different oseltamivir regimens on treating influenza a virus infection and resistance emergence: insights from a modelling study. PLoS Comput Biol. 2014;10(4):e1003568. [DOI] [PMC free article] [PubMed] [Google Scholar]
- 22. Janmahasatian S, Duffull SB, Ash S, Ward LC, Byrne NM, Green B. Quantification of lean bodyweight. Clin Pharmacokinet. 2005;44(10):1051‐1065. [DOI] [PubMed] [Google Scholar]
- 23. Lam H, Jeffery J, Sitar DS, Aoki FY. Oseltamivir, an influenza neuraminidase inhibitor drug, does not affect the steady‐state pharmacokinetic characteristics of cyclosporine, mycophenolate, or tacrolimus in adult renal transplant patients. Ther Drug Monit. 2011;33(6):699‐704. [DOI] [PubMed] [Google Scholar]
- 24. Seo S, Englund JA, Nguyen JT, et al. Combination therapy with amantadine, oseltamivir and ribavirin for influenza a infection: safety and pharmacokinetics. Antivir Ther. 2013;18(3):377‐386. [DOI] [PMC free article] [PubMed] [Google Scholar]
- 25. Aoki FY, Macleod MD, Paggiaro P, et al. Early administration of oral oseltamivir increases the benefits of influenza treatment. J Antimicrob Chemother. 2003;51:123‐129. [DOI] [PubMed] [Google Scholar]
- 26. European Centre for Disease Prevention and Control . Expert Opinion on neuraminidase inhibitors for prevention and treatment of influenza: Review of recent systematic reviews and meta‐analyses. https://www.ecdc.europa.eu/sites/default/files/media/en/publications/Publications/neuraminidase-inhibitors-flu-consultation.pdf. Accessed January 24, 2020.
- 27. Public Health England . Influenza: treatment and prophylaxis using anti‐viral agents. https://www.gov.uk/government/publications/influenza-treatment-and-prophylaxis-using-anti-viral-agents. Accessed January 24, 2020.
- 28. Centers for Disease Control and Prevention . Influenza antiviral medications: summary for clinicians. https://www.cdc.gov/flu/professionals/antivirals/summary-clinicians.htm. Accessed January 24, 2020.
- 29. Feiterna‐Sperling C, Edelmann A, Nickel R, et al. Pandemic influenza a (H1N1) outbreak among 15 school‐aged HIV‐1‐infected children. Clin Infect Dis. 2010;51(11):e90‐e94. [DOI] [PubMed] [Google Scholar]
- 30. Nichols WG, Guthrie KA, Corey L, Boeckh M. Influenza infections after hematopoietic stem cell transplantation: risk factors, mortality, and the effect of antiviral therapy. Clin Infect Dis. 2004;39(9):1300‐1306. [DOI] [PubMed] [Google Scholar]
- 31. Piralla A, Gozalo‐Marguello M, Fiorina L, et al. Different drug‐resistant influenza a(H3N2) variants in two immunocompromised patients treated with oseltamivir during the 2011‐2012 influenza season in Italy. J Clin Virol. 2013;58(1):132‐137. [DOI] [PubMed] [Google Scholar]
- 32. World Health Organization . WHO guidelines for pharmacological management of pandemic influenza A(H1N1) 2009 and other influenza viruses. February 2010. http://www.who.int/csr/resources/publications/swineflu/h1n1_guidelines_pharmaceutical_mngt.pdf. Accessed January 24, 2020. [PubMed]
- 33. Choi WS, Baek JH, Seo YB, et al. Severe influenza treatment guideline. Korean J Intern Med. 2014;29(1):132‐147. [DOI] [PMC free article] [PubMed] [Google Scholar]
- 34. Casper C, Englund J, Boeckh M. How I treat influenza in patients with hematologic malignancies. Blood. 2010;115(7):1331‐1342. [DOI] [PMC free article] [PubMed] [Google Scholar]
- 35. Cowling BJ, Chan KH, Fang VJ, et al. Comparative epidemiology of pandemic and seasonal influenza a in households. N Engl J Med. 2010;362(23):2175‐2184. [DOI] [PMC free article] [PubMed] [Google Scholar]
- 36. Xiao H, Lu SH, Ou Q, Chen YY, Huang SP. Hospitalized patients with novel influenza a (H1N1) virus infection: Shanghai, June ‐ July 2009. Chin Med J (Engl). 2010;123(4):401‐405. [PubMed] [Google Scholar]
- 37. Bautista F, Engelhard D, Rizzari C, et al. Pharmacokinetics and pharmacodynamics of conventional‐dose vs triple‐dose oseltamivir in severely immunocompromised children with influenza. Open Forum Infect Dis. 2019;6(10):ofz430. [DOI] [PMC free article] [PubMed] [Google Scholar]
Associated Data
This section collects any data citations, data availability statements, or supplementary materials included in this article.
Supplementary Materials
SUPPORTING INFORMATION FIGURE S1 Goodness‐of‐fit plots of the population pharmacokinetic model for (A) oseltamivir and (B) oseltamivir carboxylate
SUPPORTING INFORMATION FIGURE S2 Visual predictive check for the population pharmacokinetic model describing oseltamivir and oseltamivir carboxylate exposure in immunocompromised adults treated with conventional‐dose (A) and double‐dose (B) oseltamivir
SUPPORTING INFORMATION FIGURE S3 Visual predictive checks for the disease model describing influenza viral load versus time after oseltamivir dose administration
Data Availability Statement
Qualified researchers may request access to individual patient level data through the clinical study data request platform (https://vivli.org/). Further details on Roche's criteria for eligible studies are available here (https://vivli.org/members/ourmembers/). For further details on Roche's Global Policy on the Sharing of Clinical Information and how to request access to related clinical study documents, see here (https://www.roche.com/research_and_development/who_we_are_how_we_work/clinical_trials/our_commitment_to_data_sharing.htm).