

Abstract
Aim
To describe the point prevalence of cerebral palsy (CP) and distribution of gross and fine motor function in individuals registered in a CP‐North surveillance programme.
Method
Aggregate data of individuals with CP aged 6 to 19 years, sex, CP subtype, and gross and fine motor function levels were collected from each programme. Overall and age‐specific point prevalence of CP was calculated for each programme using 95% confidence intervals. Logistic regression was used to estimate prevalence and CP subtypes with age as the covariate variable. Pearson χ 2 tests were used to compare the distributions of CP subtypes, Gross Motor Function Classification System (GMFCS) levels, and Manual Ability Classification System (MACS) levels by age and between programmes.
Results
Among 3 759 138 individuals residing in Scandinavia and Scotland, 8278 had a diagnosis of CP (57–59% were males). The overall point prevalence of CP ranged from 2.13 to 2.32 per 1000 residents. Age‐specific prevalence in each programme varied with the exception of Denmark. While the proportions of bilateral spastic CP were similar between programmes, there were variations in all other CP subtypes and in GMFCS and MACS levels.
Interpretation
While the results of this study may reflect real differences in CP populations between countries, they may not be clinically relevant. The variations may be attributable to differences in the year when each programme was first established, different data collection methods, and country‐specific governmental policies.
Short abstract
This article is commented on by Platt on page 634 of this issue.
Abbreviations
- CPIPS
Cerebral Palsy Integrated Pathway Scotland
- CPOP
Norwegian or Danish Cerebral Palsy Follow‐Up Program
- CPRN
Cerebral Palsy Registry of Norway
- CPUP
Swedish Cerebral Palsy Follow‐Up Program
- GMFCS
Gross Motor Function Classification System
- MACS
Manual Ability Classification System
What this paper adds.
The overall point prevalence of cerebral palsy (CP) in Scandinavia and Scotland ranged from 2.13 to 2.32 per 1000 residents.
Age‐specific point prevalence of CP varied in each country except for Denmark.
Overall distributions of bilateral spastic CP were similar, whereas other CP subtypes varied.
Overall and age‐specific distributions in gross and fine motor function levels varied.
Cerebral palsy (CP) is the most common cause of permanent motor disabilities in children. In 2013, Oskoui et al. reported that the global birth prevalence of CP in children born from 1985 to 2004 was 2.11 per 1000 live births. 1 Some studies have reported a decline in prevalence. 2 , 3 , 4 CP is classified into subtypes based on the dominant motor disturbance and on which part of the body is affected. In addition, the degree of gross and fine motor function is also classified. Associated impairments such as epilepsy, impairments in cognition, speech and language, vision, hearing, and feeding/nutrition are also common and often classified. 3 Although CP cannot be cured, there are treatments and interventions that target the optimization of function and prevention of secondary impairments throughout the lifespan to enable participation in the performance of activities of daily life. 5 , 6
The Swedish Cerebral Palsy Follow‐Up Program (CPUP) was established in 1994 as a surveillance programme to prevent or reduce hip dislocation and contractures in children with CP in Southern Sweden through standardized prospective examinations. The CPUP collects data on motor function, joint range of motion, use of assistive devices, physical and leisure activities, treatments, and radiographic measurements. These data are collected via physical and occupational therapy assessments once or twice per year, or every second year, depending on the individual’s level of gross motor function and age. 5 In 2005, the CPUP was designated as a national quality registry and added a neuropediatric assessment at one point in time. Several other CP surveillance programmes based on CPUP assessments have been introduced in the Nordic countries and Scotland; Norwegian Cerebral Palsy Follow‐Up Program (CPOP, established in 2006), Danish Cerebral Palsy Follow‐Up Program (CPOP, established in 2010), Icelandic Cerebral Palsy Follow‐Up Program (established in 2012), and the Cerebral Palsy Integrated Pathway Scotland (CPIPS, established in 2013). 7 , 8 The Norwegian CPOP works closely with the Cerebral Palsy Registry of Norway (CPRN), a national medical quality registry established in 2001. The CPRN collects clinical information such as CP subtype, motor function, associated impairments, treatments, and cerebral magnetic resonance imaging at three points in time: at diagnosis, aged 5 years, and aged between 15 and 17 years. 9 Each CP surveillance programme/registry is fully integrated in the respective country’s universal health care services; therefore, enrollment levels are high, ranging from 86% to 95%. 9 , 10 , 11 , 12
‘CP‐North: living life with CP in the Nordic countries?’ is a research programme where medical, social, health economics, and public health outcomes associated with living with CP for both individuals and their caregivers are investigated. 7 The aforementioned CP surveillance programmes, CPRN, and a cohort in Finland are currently participating in CP‐North. Data from each CP surveillance programme/registry/cohort are currently being merged with data from their respective national health and sociodemographic registries. For each individual with CP, data on their parents and five matched controls from the general population (individuals and their parents) are also included. The study outcomes will help guide each country’s practices and policies related to individuals with early‐onset chronic disabilities. 7
To lay the foundation for further CP‐North studies, the aim of this study was to identify and compare the point prevalence and distribution of gross and fine motor function levels in individuals registered in the participating CP‐North surveillance programmes/registry.
METHOD
Study population and design
Aggregate data were collected from researchers from each CP surveillance programme/registry (hereafter called ‘programme’) regarding the number of individuals with CP aged 6 to 19 years (born 2000–2013) and registered on 31st December 2019, sex, CP subtype, and gross and fine motor function levels.
CP subtypes were classified according to the Surveillance of Cerebral Palsy in Europe guidelines and as confirmed at age 5 years. 13 Gross motor function was classified according to the Gross Motor Function Classification System (GMFCS) or the expanded and revised version, while fine motor function was classified according to the Manual Ability Classification System (MACS). 14 , 15 The most recent GMFCS and MACS assessments were used, except for children registered in the CPRN, which were assessed at age 5 years. The number of residents in each country as of 31st December 2019 was collected from the respective bureaus of statistics. 16 , 17 , 18 , 19
The Icelandic Cerebral Palsy Follow‐Up Program and Finnish cohort were excluded from this study due to non‐population‐based data. The Norwegian CPOP was also excluded due to national data collection starting from birth year 2006, whereas complete data were available from the CPRN. Only partial data for children aged 6 to 11 years (born 2008–2013) were included from the Danish CPOP. Data from the Danish CP registry were not included due to the exclusion of children born abroad and children with a postneonatal cause of CP.
Statistical analyses
Overall and age‐specific point prevalence of CP were calculated for each programme with 95% confidence intervals. The numerator(s) were the number of individuals with CP aged 6 to 19 years registered in the programme on 31st December 2019. The denominator(s) were the number of residents with and without CP of the same age and on the same date in the respective country. Overall point prevalence was calculated by dividing the total sum of the numerator by the total sum of the denominator for each programme. Age‐specific point prevalence was calculated in 1‐year age increments by dividing each age cohort numerator by the corresponding denominator for each programme. Logistic regression with age as the covariate variable was used to estimate the prevalence of CP and its subtypes. Non‐linear trends were accounted for by using fractional polynomials with age as the covariate variable. 20 To compare the overall distributions of CP subtypes, GMFCS levels, and MACS levels between each programme, we used the Pearson χ 2 test and standardized Pearson residuals. Residuals exceeding 3 in absolute value were considered statistically significant. 21 The linear‐by‐linear association test was used to study the proportions of GMFCS and MACS levels by age. 21 Missing data were handled using available case analysis, that is, in each analysis we included cases with data on the relevant variables; p<0.05 was considered statistically significant. Logistic regression analyses were performed and figures created with Stata 15 (StataCorp LLC, College Station, TX, USA); other analyses were performed with SPSS v25 (IBM Corp., Armonk, NY, USA). The distributions of each variable per programme and age are presented in Tables [Link], [Link], [Link], [Link] (online supporting information); standardized Pearson residuals are presented in Table S5 (online supporting information).
Ethics statement
Data were collected from each programme in aggregated form; therefore, it is not possible to link them to a specific individual. Nonetheless, each programme obtained ethical approval for the CP‐North research programme in accordance with local laws and regulations as follows: CPUP, Regional Ethics Board, Lund 2018/491; CPRN, Regional Committees for Medical and Health Research Ethics, 2017/2457/REK south‐east; CPOP, a waiver was obtained; CPIPS, the South East Scotland Research Ethics Service confirmed that an ethical review was not needed.
RESULTS
This study included 3 759 138 individuals residing in Scandinavia and Scotland as of 31st December 2019. Among these, 8278 were registered as having been diagnosed with CP in a programme (Table 1). The distributions of males were similar, ranging from 57.4% to 58.9% (p=0.714) (Table 1).
Table 1.
Prevalence of cerebral palsy (CP) per 1000 residents and distributions of sex, CP subtype, Gross Motor Function Classification System (GMFCS) levels, and Manual Ability Classification System (MACS) levels per CP surveillance programme/registry on 31st December 2019
| Aged 6–19y (born 2000–2013) | Aged 6–11y (born 2008–2013) | |||
|---|---|---|---|---|
| CPUP | CPRN | CPIPS | CPOP | |
| Residents (n) | 1 664 733 | 897 590 | 814 304 | 382 511 |
| Individuals with CP (n) | 3646 | 1910 | 1835 | 887 |
| Prevalence (95% CI) | 2.19 (2.12–2.26) | 2.13 (2.03–2.23) | 2.25 (2.15–2.36) | 2.32 (2.17–2.48) |
| Sex, n (%) | ||||
| Male | 2077 (57.4) | 1125 (58.9) | 1048 (57.4) | 510 (57.6) |
| Female | 1543 (42.6) | 785 (41.1) | 779 (42.6) | 375 (42.4) |
| Valid cases | 3620 (100) | 1910 (100) | 1827 (100) | 885 (100) |
| Missing | 26 (0.7) | 0 (0.0) | 8 (0.4) | 2 (0.2) |
| Total | 3646 | 1910 | 1835 | 887 |
| CP subtype, n (%) | ||||
| Spastic unilateral | 943 (35.9) | 809 (43.4) a | 581 (32.1) b | 467 (78.6) c |
| Spastic bilateral | 1125 (42.9) | 829 (44.5) | 818 (45.1) | |
| Dyskinetic | 337 (12.8) a | 125 (6.7) b | 160 (8.8) | 24 (4.0) |
| Ataxic | 120 (4.6) a | 74 (4.0) | 34 (1.9) b | 15 (2.5) |
| Other/unspecified | 100 (3.8) b | 28 (1.5) b | 219 (12.1) a | 88 (14.8) |
| Valid cases | 2625 (100) | 1865 (100) | 1812 (100) | 594 (100) |
| Missing | 1021 (28.0) | 45 (2.4) | 23 (1.3) | 293 (33.0) |
| Total | 3646 | 1910 | 1835 | 887 |
| GMFCS level, n (%) | ||||
| I | 1583 (44.6) | 956 (52.7) a | 668 (37.0) b | 352 (52.9) |
| II | 571 (16.1) | 295 (16.3) | 379 (21.0) a | 100 (15.0) |
| III | 307 (8.7) | 127 (7.0) | 172 (9.5) | 51 (7.7) |
| IV | 506 (14.3) a | 159 (8.8) b | 230 (12.7) | 65 (9.8) |
| V | 582 (16.4) | 276 (15.2) | 357 (19.8) a | 98 (14.7) |
| Valid cases | 3549 (100) | 1813 (100) | 1806 (100) | 666 (100) |
| Missing | 97 (2.7) | 97 (5.1) | 29 (1.6) | 221 (24.9) |
| Total | 3646 | 1910 | 1835 | 887 |
| MACS level, n (%) | ||||
| I | 1178 (34.2) b | 662 (39.7) a | MACS not recorded for this time period | MACS not recorded for this time period |
| II | 805 (23.3) b | 476 (28.6) a | ||
| III | 487 (14.1) | 197 (11.8) | ||
| IV | 394 (11.4) a | 118 (7.1) b | ||
| V | 584 (16.9) a | 214 (12.8) b | ||
| Valid cases | 3448 (100) | 1667 (100) | ||
| Missing | 198 (5.4) | 243 (12.7) | ||
| Total | 3646 | 1910 | ||
Standardized Pearson residual >3.
Standardized Pearson residual below −3.
The CPOP submitted the spastic CP subtype as one group (did not separate spastic unilateral and bilateral). The percentages for each category are based on total numbers with no missing values (valid cases). CPUP, Swedish Cerebral Palsy Follow‐Up Program; CPRN, Cerebral Palsy Registry of Norway; CPIPS, Cerebral Palsy Integrated Pathway Scotland; CPOP, Danish Cerebral Palsy Follow‐Up Program.
Point prevalence of CP
The overall prevalence of CP for individuals aged 6 to 19 years ranged from 2.13 per 1000 residents in the CPRN and 2.19 in the CPUP to 2.25 in the CPIPS (Table 1). The prevalence of CP in individuals aged 6 to 11 years in the CPOP was 2.32 per 1000 residents (Table 1). The prevalence of CP varied with age in the CPUP, CPRN, and CPIPS (Fig. 1). In the CPUP, age‐specific prevalence was lowest in children aged 6 years (1.77) and highest in adolescents aged 16 (2.58) to 19 years (2.27), which corresponded to a 1.4% variation per age cohort (p=0.001). In the CPRN, prevalence was lowest in children aged 6 years (1.71) and highest in adolescents aged 13 (2.58) to 17 years (2.40), which corresponded to a 1.5% variation per age cohort (p=0.009). Prevalence in the CPIPS varied greatly in children aged 6 years (1.80) compared to children aged 11 years (2.91) and adolescents aged 19 years (1.66) (p=0.009). Conversely, the prevalence of CP in the CPOP was similar in children aged 6 (2.26) to 11 years (2.32) (p=0.470) (Fig. 1).
Figure 1.
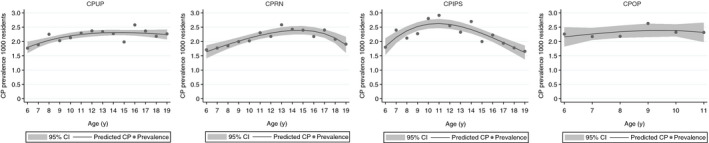
Point prevalence of cerebral palsy (CP) per 1000 residents in the CP surveillance programmes/registry in Sweden (CPUP), Norway (CPRN), Scotland (CPIPS), and Denmark (CPOP) on 31st December 2019. Each point shows the actual prevalence. The solid line represents the predicted CP prevalence using logistic regression with fractional polynomials; the shaded area denotes the 95% confidence interval (CI).
CP subtypes
The distributions of CP subtypes between programmes are shown in Table 1. Overall, there were statistically significant differences between the CPUP, CPRN, and CPIPS programmes (χ2 with 8 degrees of freedom, p<0.001). The proportions recorded within each CP subtype and programme varied significantly except for bilateral spastic CP. There was a higher proportion of individuals with unilateral spastic CP in the CPRN and a lower proportion in the CPIPS. The CPUP had a higher proportion of individuals with dyskinetic and ataxic CP, compared to a lower proportion of individuals with dyskinetic CP in the CPRN and a lower proportion of ataxic CP in the CPIPS. Lastly, the CPIPS had a higher proportion of individuals with other/unspecified CP whereas the CPUP and CPRN had lower proportions. The prevalence of spastic bilateral CP in the CPRN and CPIPS followed the same patterns as the point prevalence (Fig. S1, online supporting information). In the CPRN, age‐specific prevalence of spastic bilateral CP was lowest in children aged 6 years (0.57) and higher in adolescents aged 13 (1.27) to 15 years (1.14), which corresponded to a 2.1% variation per age cohort (p=0.015). The prevalence of bilateral spastic CP in the CPIPS varied greatly (p=0.603). We could not calculate variations in spastic bilateral CP in the CPUP due to missing data. The CPOP was excluded from the CP subtype analyses due to data submission consisting of just one group of individuals with spastic CP.
Gross motor function
There were also significant differences in the overall distributions of GMFCS levels in the CPUP, CPRN, and CPIPS surveillance programmes (χ2 with 8 degrees of freedom, p<0.001) (Table 1). The proportions recorded within each GMFCS level and programme varied significantly, with the exception of GMFCS level III (Table 1). The CPRN had a higher proportion of individuals in GMFCS level I. The CPIPS had a lower proportion of individuals in GMFCS level I and a higher proportion of individuals in GMFCS level II. Although the proportion of individuals in GMFCS level III in the CPRN was lower, it was just under the significance threshold. The CPUP had a higher proportion of individuals in GMFCS level IV whereas the CPRN had a lower proportion. The CPIPS had a higher proportion of individuals in GMFCS level V. The CPOP‐Denmark data are shown in Table 1. Otherwise, within each programme, GMFCS levels were relatively similar between age cohorts, with the exception of GMFCS levels I and V in the CPRN (Fig. 2). In the CPRN, the proportion of individuals in GMFCS level I was higher in children aged 6 years (60.2%) compared to adolescents aged 19 years (42.2%) (p=0.036); the proportion of children in GMFCS level V was lower in children aged 6 years (10.2%) compared to adolescents aged 19 years (20.7%) (p<0.001).
Figure 2.
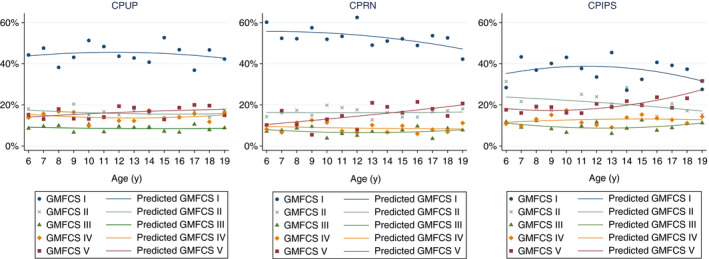
Distributions of Gross Motor Function Classification System (GMFCS) levels in the cerebral palsy (CP) surveillance programmes/registry in Sweden (CPUP), Norway (CPRN), and Scotland (CPIPS) on 31st December 2019. Each point shows the actual distributions. The solid line represents the predicted GMFCS levels obtained using fractional polynomials.
Fine motor function
The overall distributions in MACS levels in the CPUP and CPRN differed significantly (χ2 with 4 degrees of freedom, p<0.001) (Table 1). The proportions of individuals in MACS levels I and II were higher in the CPRN and lower in the CPUP. Conversely, the proportions of individuals in MACS levels IV and V were higher in the CPUP compared to the CPRN. MACS level III did not vary between programmes. Within each programme, MACS levels varied among age cohorts with the exception of MACS levels III and IV (Fig. 3). In the CPRN, the proportion of individuals in MACS level I was significantly higher in children aged 6 years (46.2%) compared to adolescents aged 19 years (23.8%) (p=0.001), while the proportion of individuals in MACS level II was lower in children aged 6 years (32.3%) compared to adolescents aged 19 years (40.6%) (p=0.005). In the CPUP, the proportions of individuals in MACS level I were similar, while the proportion of individuals in MACS level II was higher in children aged 6 years (28.4%) compared to adolescents aged 19 years (24.4%) (p=0.002). Lastly, the proportion of individuals in MACS level V in the CPRN was lower in children aged 6 years (11.8%) compared to adolescents aged 19 years (16.8%) (p=0.058); this proportion was similar in the CPUP. The CPIPS and CPOP were excluded from these analyses because they did not record manual ability during this time period.
Figure 3.

Distributions of Manual Ability Classification System (MACS) levels in the cerebral palsy (CP) surveillance programme/registry in Sweden (CPUP) and Norway (CPRN) on 31st December 2019. Each point shows the actual distributions. The solid line represents the predicted MACS levels obtained using fractional polynomials.
DISCUSSION
In this CP‐North study, we found that the overall point prevalence of CP in individuals aged 6 to 19 years (born 2000–2013) and registered in the CPUP, CPRN, and CPIPS on 31st December 2019 was similar, ranging from 2.13 to 2.25 per 1000 residents. However, within each programme there was age‐specific variation in prevalence. Prevalence among individuals aged 6 to 11 years (born 2008–2013) in the CPOP was similar at around 2.32. While the distribution of bilateral spastic CP was similar between programmes, prevalence was lower in the younger cohorts in the CPRN. Otherwise, there were variations in the distributions of the other CP subtypes and in GMFCS and MACS levels between programmes. The CPIPS recorded a lower proportion of individuals in GMFCS level I and a higher proportion in GMFCS level V than recorded in the CPUP and CPRN. Moreover, in the CPRN, the severity of gross and fine motor function was lower in the younger cohorts, whereas the distribution of these levels was similar between all ages in the CPUP.
A strength of this study is that it covers a large sample of individuals with CP enrolled in well‐established national population‐based programmes that are integrated in their countries’ universal health care services. Each programme reported a high level of enrollment, which reduced selection bias. 9 , 10 , 11 , 12 Additionally, the data collected for this study were based on standardized, international classifications for the diagnosis and classification of motor function for individuals with CP, which have been relatively stable over time and across evaluators. 15 , 22 , 23 However, although variations in our results may reflect real differences in the clinical picture of CP between programmes, they may not be clinically relevant. The results may simply be explained by differences in the year when each programme was first established, different data collection methods, and country‐specific governmental policies.
The lower prevalence and severity of CP in the oldest cohorts in the CPRN and CPIPS was likely due to lower enrollment during the initial years of establishment. A lower proportion of children with less severe CP may have been enrolled initially given that children with more severe CP are diagnosed earlier and therapists are more inclined to enroll them first. In a validation study of all CP diagnosis codes in the CPRN and Norwegian Patient Registry, Hollung et al. 9 reported an increase in ascertainment completeness in the CPRN from 61% in 1996 to 91% in 2007. The increase was attributed to the time it takes data collection to become routine in the clinic. This may explain the lower prevalence in adolescents aged 18 to 19 years in the CPRN, as well as the larger proportions of missing GMFCS and MACS data in the older age cohorts (Tables S3 and S4). Yet, the results of the validation study also indicated that variation in ascertainment completeness in the CPRN did not result in selection bias regarding CP subtypes. Using data from the CPIPS recorded between 2013 and 2018 for children and adolescents aged 2 to 16 years, Bugler et al. 24 initially reported a slightly lower prevalence of 2.02 per 1000 residents and a significantly higher proportion of individuals in GMFCS levels IV and V compared to previous CPUP studies. Such differences were less significant in this study, which may indicate that the CPIPS has since increased ascertainment completeness, including individuals with less severe CP.
Furthermore, data completeness varied among programmes. This may be due to differences in data collection methods (e.g. data types, timing of data collection, responsible multidisciplinary health care professionals). For example, the CPUP, CPIPS, and CPOP programmes had a higher proportion of missing/unspecified CP subtypes than the CPRN. In Norway, paediatricians routinely classify and report clinical data (i.e. CP subtype) to the CPRN at three time points, whereas there has been an ongoing lack of neuropaediatricians reporting to the CPUP. Subsequently, the likelihood of an individual being recorded with a CP subtype in the CPUP has increased with age (Table S2). Nonetheless, while we think that the large proportion of missing CP subtypes in the CPUP were most likely unrelated to severity, we cannot rule out that the registration of individuals with more severe CP are prioritized. Also, while physical and occupational therapists are responsible for the classification and reporting of motor function to the CPRN at three time points, these data are regularly reported to the CPUP, CPIPS, and CPOP depending on the participant’s age and functional level. Therefore, it is difficult to explain if the higher proportions of individuals recorded in GMFCS level IV in the CPUP and GMFCS level V in the CPIPS compared to the CPRN were actually due to more severe motor function in these populations or simply due to variations in the GMFCS classification of individuals with CP by physical therapists. This also holds true when comparing MACS levels between the CPRN and CPUP. Additionally, the CPRN has a higher proportion of missing MACS levels due to occupational therapists having reduced capacity to perform MACS assessments. While previous studies suggested that this does not result in selection bias (per CP subtype), 25 we cannot rule out that individuals with more severe CP are prioritized in the clinic where such assessments are made and reported.
As CP programmes record all individuals regardless of country of birth, immigration may have had an effect on our results. In 2013, Statistics Norway reported that there are major differences in immigration policies between Scandinavian countries. 26 Since 2000, while immigration to Denmark has remained stable, immigration to Sweden and Norway has doubled. Furthermore, the influx of immigrants to Norway were mainly migrant workers, whereas in Sweden they were refugees. 26 Westbom and Hägglund 27 reported a significant increase in individuals with CP who were born abroad and were recorded in the CPUP. They found a higher prevalence and severity of CP among individuals born abroad than those born in Sweden. Conversely, immigration has most likely not had an effect on the CP populations in Norway and Scotland. Although we are describing an age‐specific point prevalence of CP in this study, the pattern of lower prevalence among younger cohorts is similar to a reported decline in birth prevalence and severity of CP in Norway in children born between 1999 and 2010. 3 The decline was attributed to a significant decrease in the prevalence of children with bilateral spastic CP due to advances in obstetric and neonatal care. Therefore, it is unlikely that many children in the younger age cohorts (aged 6–12y in 2019) will be newly diagnosed with CP by the time they reach age 19 years. In Scotland, there was a minor influx of migrant workers and students from 2001 to 2016; thereafter, an outflow of migration mainly due to the uncertainty of the UK leaving the European Union. 28 The higher point prevalence in the CPOP may be due to immigration. While prevalence in the CPOP remained stable at around 2.32 per 1000 residents, the Danish CP registry reported a decline in birth prevalence and severity of CP from 2.1 in children born from 1999 to 2001 to 1.8 in children born from 2005 to 2007. Like Norway, this decrease was mainly due to a decline in children with bilateral spastic CP born at term, which may be attributed to improved perinatal care. 29
Lastly, changes in other risk factors for CP may also influence the prevalence and severity of CP over time, for example, postneonatal causes. However, in Scandinavia and Scotland, the number of individuals with a postneonatal cause of CP is low and stable; therefore, it most likely did not affect our results. 30 , 31
CONCLUSION
In this study, we described the point prevalence of CP and distribution of CP subtypes and levels of motor function among individuals with CP aged 6 to 19 years living in Scandinavia and Scotland. The overall prevalence of CP was similar, ranging from 2.13 to 2.32 per 1000 residents. The prevalence and proportions of each CP subtype and GMFCS and MACS levels varied somewhat between programmes and age cohorts. However, such variations may be affected by programmes having been established in different years, different data collection methods, and country‐specific governmental policies, and may not be clinically relevant. Nonetheless, the results provide a basis to guide each country’s practices and policies for individuals with CP, as well as providing a basis for further CP‐North studies.
Supporting information
Figure S1: Point prevalence of bilateral spastic CP per 1000 residents in the CP surveillance programme/registry in Norway and Scotland.
Table S1: Distribution of individuals with CP, number of residents, and prevalence rates per CP surveillance programme/registry and birth year
Table S2: Distribution of CP subtypes per surveillance programme/registry and birth year
Table S3: Distribution of GMFCS levels per CP surveillance programme/registry and birth year
Table S4: Distribution of MACS levels per CP surveillance programme/registry and birth year
Table S5: Overall distribution and standardized Pearson residuals per CP subtype, GMFCS, and MACS levels per CP surveillance programme/registry
Acknowledgements
We thank the researchers from each participating CP‐North programme for submitting data to this study. We also thank NordForsk for funding this study (grant no. 82866). The findings and conclusions in this report are those of the authors and do not necessarily represent the official position of the funders. The authors have stated they had no interests that might be perceived as posing a conflict or bias.
DATA AVAILABILITY STATEMENT
The data that supports the findings of this study are available in the supplementary material of this article.
REFERENCES
- 1. Oskoui M, Coutinho F, Dykeman J, Jetté N, Pringsheim T. An update on the prevalence of cerebral palsy: a systematic review and meta‐analysis. Dev Med Child Neurol 2013; 55: 509–19. [DOI] [PubMed] [Google Scholar]
- 2. Sellier E, Platt MJ, Andersen GL, Krägeloh‐Mann I, De La Cruz J, Cans C. Decreasing prevalence in cerebral palsy: a multi‐site European population‐based study, 1980 to 2003. Dev Med Child Neurol 2016; 58: 85–92. [DOI] [PubMed] [Google Scholar]
- 3. Hollung SJ, Vik T, Lydersen S, Bakken IJ, Andersen GL. Decreasing prevalence and severity of cerebral palsy in Norway among children born 1999 to 2010 concomitant with improvements in perinatal health. Eur J Paediatr Neurol 2018; 22: 814–21. [DOI] [PubMed] [Google Scholar]
- 4. Galea C, McIntyre S, Smithers‐Sheedy H, et al. Cerebral palsy trends in Australia (1995–2009): a population‐based observational study. Dev Med Child Neurol 2019; 61: 186–93. [DOI] [PubMed] [Google Scholar]
- 5. Alriksson‐Schmidt AI, Arner M, Westbom L, et al. A combined surveillance program and quality register improves management of childhood disability. Disabil Rehabil 2017; 39: 830–6. [DOI] [PubMed] [Google Scholar]
- 6. Novak I, Morgan C, Adde L, et al. Early, accurate diagnosis and early intervention in cerebral palsy: advances in diagnosis and treatment. JAMA Pediatr 2017; 171: 897–907. [DOI] [PMC free article] [PubMed] [Google Scholar]
- 7. Alriksson‐Schmidt AI, Ahonen M, Andersen GL, et al. CP‐North: living life in the Nordic countries? A retrospective register research protocol on individuals with cerebral palsy and their parents living in Sweden, Norway, Denmark, Finland and Iceland. BMJ Open 2019; 9: e024438. [DOI] [PMC free article] [PubMed] [Google Scholar]
- 8. Alriksson‐Schmidt AI, Jeglinsky‐Kankainen IFD, Jahnsen RB, Hollung SJ, Andersen GL, Hägglund GV. Flaunting our assets. Making the most of the Nordic registry goldmine: cerebral palsy as an example. Scand J Public Health 2020; 48: 113–8. [DOI] [PubMed] [Google Scholar]
- 9. Hollung SJ, Vik T, Wiik R, Bakken IJ, Andersen GL. Completeness and correctness of cerebral palsy diagnoses in two health registers: implications for estimating prevalence. Dev Med Child Neurol 2017; 59: 402–6. [DOI] [PubMed] [Google Scholar]
- 10. Hägglund G. CPUP Follow‐Up Program for Cerebral Palsy Yearly Report 2019 [article in Swedish] [Internet]. Lund, Sweden: CPUP. 2019. Available at: https://cpup.se/publikationer/arsrapporter/ (accessed 13 November 2020). [Google Scholar]
- 11. Gaston MS. CPIPS: musculoskeletal and hip surveillance for children with cerebral palsy. Paediatr Child Health 2019; 29: 489–94. [Google Scholar]
- 12. Nationwide clinical quality database for the follow‐up program for cerebral palsy (CPOP) national annual report 2018 [article in Danish] [Internet]. Aarhus, Denmark: CPOP, 2018. Available at: http://www.cpop.dk/wp‐content/uploads/61307_cpop‐databasen‐aarsrapport‐2018‐offentliggjort.pdf (accessed 13 November 2020).. [Google Scholar]
- 13. Surveillance of Cerebral Palsy in Europe (SCPE) . SCPE classification of CP subtypes based on neurological findings [Internet]. Ispra: European Commission – Joint Research Centre. Available at: https://eu‐rd‐platform.jrc.ec.europa.eu/scpe/cerebral‐palsy_en (accessed 13 November 2020). [Google Scholar]
- 14. CanChild . Gross Motor Function Classification System: expanded & revised [Internet]. Hamilton, ON, Canada: CanChild. Available at: https://www.canchild.ca/en/resources/42‐gross‐motor‐function‐classification‐system‐expanded‐revised‐gmfcs‐e‐r (accessed 13 November 2020).. [Google Scholar]
- 15. Eliasson A‐C, Krumlinde‐Sundholm L, Rösblad B, et al. The Manual Ability Classification System (MACS) for children with cerebral palsy: scale development and evidence of validity and reliability. Dev Med Child Neurol 2006; 48: 549–54. [DOI] [PubMed] [Google Scholar]
- 16. Statistics Sweden . Population by age and sex. Year 1860–2019 [Internet]. Stockholm, Sweden: Statistics Sweden. 2020. Available at: http://www.statistikdatabasen.scb.se/pxweb/en/ssd/START__BE__BE0101__BE0101A/BefolkningR1860/ (accessed 13 November 2020). [Google Scholar]
- 17. Statistics Norway . 07459: Population, by sex and one‐year age groups (M) 1986–2020 [Internet]. Oslo: Statistics Norway, 2020. Available at: https://www.ssb.no/en/statbank/table/07459 (accessed 13 November 2020). [Google Scholar]
- 18. Statistics Denmark . BEF5: Population 1. January by sex, age and country of birth [Internet]. Copenhagen, Denmark: Statistics Denmark, 2020. Available at: https://www.statbank.dk/BEF5 (accessed 13 November 2020). [Google Scholar]
- 19. National Records of Scotland. Projected population of Scotland . (2018‐based) [Internet]. Edinburgh: NRS, 2020. Available at: https://www.nrscotland.gov.uk/statistics‐and‐data/statistics/statistics‐by‐theme/population/population‐projections/population‐projections‐scotland/2018‐based (accessed 13 November 2020). [Google Scholar]
- 20. Fagerland MW, Eide GE, Laake P. Linear regression. In: Laake P, Lydersen S, Bragelien Veierød M, editors. Medical statistics in clinical and epidemiological research. Oslo, Norway: Gyldendal Akademinsk, 2012: 159. [Google Scholar]
- 21. Fagerland MW, Lydersen S, Laake P. Statistical analysis of contingency tables (1st edition). Boca Raton, FL: Chapman and Hall/CRC, 2017. [Google Scholar]
- 22. Alriksson‐Schmidt A, Nordmark E, Czuba T, Westbom L. Stability of the Gross Motor Function Classification System in children and adolescents with cerebral palsy: a retrospective cohort registry study. Dev Med Child Neurol 2017; 59: 641–6. [DOI] [PubMed] [Google Scholar]
- 23. Öhrvall A‐M, Krumlinde‐Sundholm L, Eliasson A‐C. The stability of the Manual Ability Classification System over time. Dev Med Child Neurol 2014; 56: 185–9. [DOI] [PubMed] [Google Scholar]
- 24. Bugler KE, Gaston MS, Robb JE. Distribution and motor ability of children with cerebral palsy in Scotland: a registry analysis. Scott Med J 2019; 64: 16–21. [DOI] [PubMed] [Google Scholar]
- 25. Andersen GL, Hollung SJ, Vik T, Jahnsen R, Elkjær S, Klevberg GL. Cerebral Palsy Registry of Norway and Cerebral Palsy Follow‐Up Program Yearly Report 2018 [article in Norwegian] [Internet]. Tønsberg: Vestfold Hospial Trust, 2019. Available at: https://www.siv.no/seksjon/CP‐registeret_/Documents/Arsrapporter/CPRN_CPOParsrapport2018.pdf (accessed 13 November 2020). [Google Scholar]
- 26. Pettersen SV, Østby L. Immigrants in Norway, Sweden and Denmark: Statistics Norway [Internet]. Available at Oslo: Statistics Norway: 2013: (accessed 13 November 2020). Available at: https://www.ssb.no/en/befolkning/artikler‐og‐publikasjoner/_attachment/204333?_ts=1497ab86428. [Google Scholar]
- 27. Westbom L, Hägglund G. Refugee/immigrant children with cerebral palsy in the Swedish health care organization [article in Swedish]. Lakartidningen 2019; 116: FL9L. [PubMed] [Google Scholar]
- 28. Expert Advisory Group on Migration and Population . UK immigration policy after leaving the EU: impacts on Scotland’s economy, population and society [Internet]. Edinburgh: The Scottish Government, 2019. Available at: https://www.gov.scot/publications/uk‐immigration‐policy‐leaving‐eu‐impacts‐scotlands‐economy‐population‐society/pages/3/ (accessed 13 November 2020). [Google Scholar]
- 29. Hoei‐Hansen CE, Laursen B, Langhoff‐Roos J, Rackauskaite G, Uldall P. Decline in severe spastic cerebral palsy at term in Denmark 1999–2007. Eur J Paediatr Neurol 2019; 23: 94–101. [DOI] [PubMed] [Google Scholar]
- 30. Cans C, McManus V, Crowley M, et al. Cerebral palsy of post‐neonatal origin: characteristics and risk factors. Paediatr Perinat Epidemiol 2004; 18: 214–20. [DOI] [PubMed] [Google Scholar]
- 31. Germany L, Ehlinger V, Klapouszczak D, et al. Trends in prevalence and characteristics of post‐neonatal cerebral palsy cases: a European registry‐based study. Res Dev Disabil 2013; 34: 1669–77. [DOI] [PubMed] [Google Scholar]
Associated Data
This section collects any data citations, data availability statements, or supplementary materials included in this article.
Supplementary Materials
Figure S1: Point prevalence of bilateral spastic CP per 1000 residents in the CP surveillance programme/registry in Norway and Scotland.
Table S1: Distribution of individuals with CP, number of residents, and prevalence rates per CP surveillance programme/registry and birth year
Table S2: Distribution of CP subtypes per surveillance programme/registry and birth year
Table S3: Distribution of GMFCS levels per CP surveillance programme/registry and birth year
Table S4: Distribution of MACS levels per CP surveillance programme/registry and birth year
Table S5: Overall distribution and standardized Pearson residuals per CP subtype, GMFCS, and MACS levels per CP surveillance programme/registry
Data Availability Statement
The data that supports the findings of this study are available in the supplementary material of this article.