



Abstract
Background
The study aimed to evaluate the risk factors based on pathological findings comprehensively in oral squamous cell carcinoma (OSCC) using image analysis.
Methods
Scanned images of hematoxylin and eosin‐, pan‐cytokeratin‐, CD3‐, and CD8‐stained slides of OSCC cases from 256 patients were analyzed, and six variables were obtained including the tumor–stroma ratio, tumor budding per tumor bed area, and tumor infiltrating lymphocytes‐associated variables. We determined the “score” of all cases based on the variables, and all cases were classified into low‐, intermediate‐, and high‐risk groups.
Results
A significant difference in prognosis was confirmed between the risk groups (p < 0.001), and even when evaluated within different tumor‐node‐metastasis (TNM) stages, the high‐risk groups were associated with poor survival.
Conclusions
We report our work on a possible descriptive model that can predict prognosis based on pathological and imaging findings regardless of the TNM stage.
Keywords: image analysis, oral squamous cell carcinoma, tumor budding, tumor infiltrating lymphocytes, whole slide image
1. INTRODUCTION
It is estimated that cancer of the oral cavity occurs in more than 300 000 new patients and causes more than 160 000 deaths per year worldwide. 1 Cancers of the oral cavity are classified by the tumor‐node‐metastasis (TNM) stage, which is based on the depth of invasion (DOI), tumor size, number of metastatic lymph nodes, extranodal extension, and several other criteria. 2 Although they are not reflected in TNM stage, pathologic risk factors have been recognized as potential indicators for prognosis.
One of the risk factors extractable from histologic findings is the tumor–stroma ratio, which has been suggested to have prognostic impact in certain cancers. 3 , 4 , 5 , 6 Tumor budding, which was first proposed by Hase et al. 7 and is currently defined as an isolated single tumor cell or nest composed of fewer than five tumor cells, 8 is also one of the concepts determined histopathologically. 9 , 10 , 11 , 12 , 13 , 14 , 15 As the tumor microenvironment has received increasing attention, tumor infiltrating lymphocytes (TILs) have become the center of tumor research and play an important role in the immune response against tumors. 16 , 17 , 18 , 19
These elements—the tumor–stroma ratio, tumor budding, and TILs—have usually been studied individually. Moreover, they have mostly been evaluated roughly by a pathologist's judgment. The purpose of this retrospective study was to extract potential risk factors from pathology slides of patients with oral squamous cell carcinoma (OSCC) and to quantify each factor into a variable using immunohistochemistry, whole slide imaging, and semiautomated tools. The final aim was to evaluate the relationship between these variables and survival and to suggest and validate a survival prediction model that might be differentiated from the existing staging system.
2. MATERIAL AND METHODS
2.1. Patient cohort and sample preparation
Pathologic specimens of 256 OSCC cases, including those of the tongue, gingiva, palate, cheek, retromolar area, and lip, from patients who received surgery at Seoul St. Mary's hospital between January 1, 2000 and December 31, 2017 were included in this retrospective, single‐center study. Formalin‐fixed, paraffin‐embedded (FFPE) tissue of patients with only primary OSCC and complete follow‐up data was used for analysis. For every case, hematoxylin and eosin (H&E)‐stained slides of sections from the whole lesion were reviewed and staged according to the 8th edition of the American Joint Committee on Cancer (AJCC) cancer staging manual. 2 Details regarding the patient cohort and pathologic characteristics are described in Table 1.
TABLE 1.
Characteristics of patients with oral squamous cell carcinoma
| Characteristics | Total = 256 |
|---|---|
| Age | 54.5 ± 15.4 |
| Sex | |
| Female | 96 (37.5%) |
| Male | 160 (62.5%) |
| Location | |
| Tongue | 191 (74.6%) |
| Other (gingiva, palate, cheek, retromolar area, lip) | 63 (25.4%) |
| Size (cm) | 2.7 ± 1.7 |
| Depth of invasion (cm) | 1.0 ± 0.9 |
| Differentiation | |
| Well | 124 (48.4%) |
| Moderately | 118 (46.1%) |
| Poorly | 14 (5.5%) |
| T stage | |
| T1 | 78 (30.5%) |
| T2 | 69 (27.0%) |
| T3 | 80 (31.3%) |
| T4 | 29 (11.3%) |
| N stage | |
| N0 | 160 (62.5%) |
| N1 | 27 (10.5%) |
| N2 | 25 (9.8%) |
| N3 | 44 (17.2%) |
| Stage | |
| I | 76 (29.7%) |
| II | 46 (18.0%) |
| III | 50 (19.5%) |
| IVA | 39 (15.2%) |
| IVB | 45 (17.6%) |
This study was approved by the Institutional Review Board of Seoul St. Mary's Hospital of the Catholic University of Korea (KC19SESI0466).
2.2. Immunohistochemistry and whole slide imaging
After reviewing every slide, one key block containing the deepest point of invasion was selected for each case. The key blocks were sectioned for further immunohistochemical staining with the following antibodies: anti‐cytokeratin AE1/AE3 (DAKO, Agilent, Santa Clara, CA; M3515 monoclonal mouse antibody; dilution 1:400), anti‐CD3 (DAKO, Agilent; A0452 polyclonal rabbit antibody; dilution 1:100), and anti‐CD8 (DAKO, Agilent; FLEX monoclonal mouse antibody, clone C8/144B, ready‐to‐use). Whole slide images of each case consisting of H&E‐, pan‐cytokeratin‐, CD3‐, and CD8‐stained slides were generated by scanning at 40× magnification with Philips IntelliSite Pathology Solution on an UltraFast Scanner (Philips, the Netherlands).
2.3. Assessment of the tumor area and tumor bed area: Tumor–stroma ratio (tumor/stroma)
The “tumor bed” in this study was defined as an area outlined by the tumor invasive margin (IM) of OSCC, composed of the area occupied by tumor cells or tumor cell nests and the stromal area (area outlined by pink outline in schematic image) (Figure 1). While the conventional concept of invasive front referred to the most progressed three to six tumor cell layers or tumor cell groups at the advancing edge, 20 the tumor bed area connecting all the tumor IMs starting from the epithelial surface was adopted in the current study, to incorporate information from whole slide images. Because it was methodologically difficult to primarily obtain only the stromal area, it was measured by subtracting the tumor area from the determined tumor bed area.
FIGURE 1.
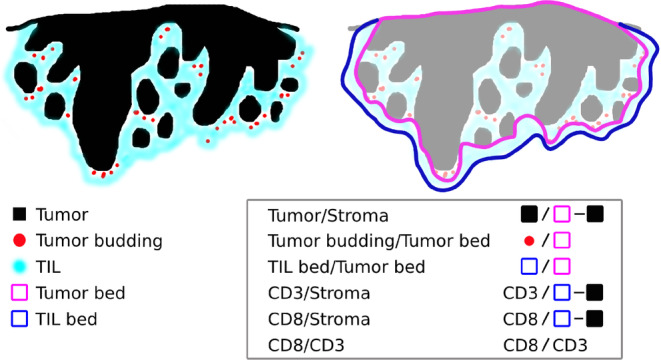
Schematic image of the components of oral squamous cell carcinoma, with the microenvironment and measurements of each variable. TIL, tumor infiltrating lymphocyte [Color figure can be viewed at wileyonlinelibrary.com]
As a first step, the edges of the tumor bed were manually defined from pan‐cytokeratin‐stained slides (Figure 2) by a pathologist (Yeoun Eun Sung) and reviewed by another pathologist (Youn Soo Lee), both of whom were blinded to the clinical data. The total tumor bed area and tumor area inside the tumor bed outline were measured using ImageJ software (National Institutes of Health, Bethesda, MD) (Figure 2): (1) using a calibration scale in each scanned image and “Set Scale” menu, the number of pixels corresponding to a known length was defined; (2) the area outside the previously defined tumor bed outline was cleared, and the remaining tumor bed area was measured in millimeters; (3) because pan‐cytokeratin staining emphasizes tumor cells in a dark brown color against a light blue background, this difference allowed selection of tumor nests by adjusting “Saturation” scale and “Brightness” scale in “Color Threshold”; and (4) the selected tumor area was automatically measured in millimeters and a binary image of each tumor area was obtained. The macro programming codes used are shown in Table S1, Supporting Information. Based on data from the measured tumor bed and tumor area, stromal area was calculated for each case, and the resulting tumor to stroma ratio (tumor/stroma) was obtained.
FIGURE 2.
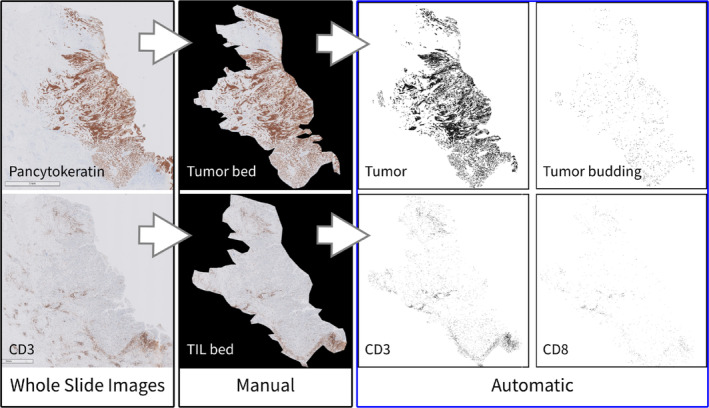
Image analysis process of oral squamous cell carcinoma from a representative case. Based on the whole slide image of the pan‐cytokeratin‐stained slide, the tumor bed was manually designated, followed by automated tumor and tumor budding detection; based on the whole slide image of the CD3‐stained slide, the TIL bed was manually designated, followed by automated processing of CD3+ T cells and CD8+ T cells. TIL, tumor infiltrating lymphocyte [Color figure can be viewed at wileyonlinelibrary.com]
2.4. Assessment of tumor budding: Tumor budding/tumor bed
A previously generated binary image of the tumor area based on pan‐cytokeratin‐stained slides (Figure 2) was used to analyze tumor budding in each case. While numerous prior studies selected one or a few fields containing the largest number of tumor buds, which were evaluated by individual pathologists, 8 , 9 , 10 , 12 , 14 , 21 whole key block slides containing the deepest point of invasion were used in this study.
To determine the cutoff for the range of the tumor budding area in OSCC, 508 tumor cell nests consisting of one to five tumor cells and the area (square micrometer) of each nest were assessed (Figure 3). The size range of the tumor cell groups is shown as a graph in Figure 3(B). An ROC curve was used to determine the optimal cutoff value to distinguish between four and five tumor cell nests (Figure 3(C)); the cutoff value was 700.484 μm2, with a sensitivity of 0.824 and a specificity of 0.966. Therefore, the tumor bud count was determined by detecting tumor buds of which the area measured 100–700 μm2 in the previously generated binary image of the tumor area by using ImageJ (Table S1).
FIGURE 3.
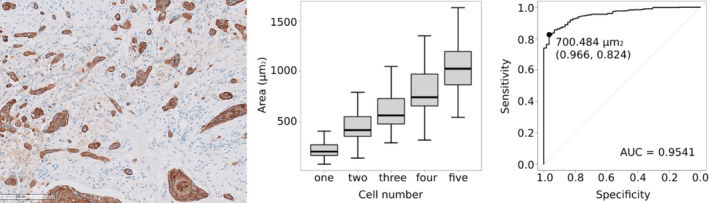
Image and graphs showing tumor budding and measurement of the area. (A) Representative image of tumor budding with variable tumor cell numbers and areas. (B) Graph showing the area range of each group of tumor cell nests consisting of one to five tumor cells. (C) A receiver operating characteristic (ROC) curve was generated to determine the optimal cutoff value to detect tumor budding [Color figure can be viewed at wileyonlinelibrary.com]
After the tumor bed areas were measured as previously described, data on tumor budding from whole slides per tumor bed area (tumor budding/tumor bed [N/mm2]) were collected for all cases.
2.5. Assessment of TIL‐associated factors‐TIL bed area, CD3 area, and CD8 area: TIL bed/tumor bed, CD3/stroma, CD8/stroma, and CD8/CD3
The TIL bed was defined as the area outlined by the outermost TIL aggregates that consisted of at least 20 lymphocytes and excluded pre‐existing lymphoid follicles around the tumor. In most cases, the TIL bed was an area that extended more than the tumor bed by the area occupied by the TIL around the tumor (Figure 1). The edges of the TIL beds in each case were also manually determined from CD3‐stained slides (Figure 2) by a pathologist (Yeoun Eun Sung) and reviewed by another pathologist (Youn Soo Lee), both of whom were blinded to the clinical data. To assess the degree of CD3+ T cell and CD8+ T cell infiltration, we chose to measure the area of CD3+ T cells and CD8+ T cells in whole slide images. The total TIL bed area and the area occupied by CD3+ and CD8+ T cells inside the TIL bed outline were also measured using ImageJ software in the same manner that the tumor area was measured (Figure 2 and Table S1).
Based on the measurements above, the ratio of the TIL bed area to tumor bed area (TIL bed/tumor bed) of every case was calculated. To evaluate CD3+ T cells and CD8+ T cells, the concept of the “stromal area” was used, defined as the tumor area subtracted from the TIL bed area; the ratio of the CD3+ T cell and CD8+ T cell area to the stromal area was obtained for every case (CD3/stroma, CD8/stroma). The area of CD8+ T cells per the area of CD3+ T cells (CD8/CD3) was also measured.
2.6. Classification of all cases according to pathological risk based on the scoring system
Based on the six values [tumor area (mm2)/stromal area (mm2) (tumor/stroma), tumor budding (N)/tumor bed area (mm2) (tumor budding/tumor bed), TIL bed area (mm2)/tumor bed area (mm2) (TIL bed/tumor bed), CD3 area (mm2)/(TIL bed area–tumor area) (mm2)/(CD3/stroma), CD3 area (mm2)/(TIL bed area–tumor area) (mm2) (CD8/stroma), and CD8 area (mm2)/CD3 area (mm2) (CD8/CD3)], we determined the “score,” which was the sum of unfavorable factors in each case, and one point was given to every variable if it was associated with a poor prognosis; thus, the score ranged from 0 to 6. Finally, all cases were classified into three groups according to the score: low‐risk group (score 0–3), intermediate‐risk group (score 4–5), and high‐risk group (score 6) (Table 2).
TABLE 2.
Six variables and risk stratification according to score
| Variables of pathological risk factors | Median [interquartile range] | Favorable (score 0) | Unfavorable (score 1) |
|---|---|---|---|
| Tumor/stroma = tumor area (mm2)/(tumor bed area–tumor area) (mm2) | 0.96 [0.53, 1.84] | High | Low |
| Tumor budding/tumor bed = tumor budding (N)/tumor bed area (mm2) | 4.26 [1.82, 13.08] | Low | High |
| TIL bed/tumor bed = TIL bed area (mm2)/tumor bed area (mm2) | 1.17 [1.09, 1.34] | High | Low |
| CD3/stroma = CD3 area (mm2)/(TIL bed area–tumor area) (mm2) | 12.08 [5.38, 22.22] | High | Low |
| CD8/stroma = CD8 area (mm2)/(TIL bed area–tumor area) (mm2) | 4.08 [1.23, 9.52] | High | Low |
| CD8/CD3 ratio = CD8 area (mm2)/CD3 area (mm2) | 36.93 [24.90, 50.26] | High | Low |
| Risk stratification | Sum of score | ||
| Low | 0–3 | ||
| Intermediate | 4–5 | ||
| High | 6 | ||
Abbreviation: TIL, tumor infiltrating lymphocyte.
2.7. Statistical analysis
The primary endpoint was death for overall survival (OS) and recurrence or metastasis for disease‐free survival (DFS). For OS, a few cases that were clearly found to have died for other reasons were censored, although it was difficult to judge this for all cases. Age‐adjusted analysis was conducted when using the Cox proportional hazards model, to overcome this limitation. For the tumor budding analysis, receiver operating characteristic (ROC) curves were used to determine the optimal cutoff range for tumor budding considering both sensitivity and specificity. After primary data of all six variables were collected (i.e., tumor/stroma, tumor budding/tumor bed, TIL bed/tumor bed, CD3/stroma, CD8/stroma, and CD8/CD3), Kaplan–Meier curves of each variable were plotted for OS and DFS. The variables were also subjected to univariate and multivariate analyses using the Cox proportional hazards model. The risk groups (according to the score of each case) were also analyzed using the Cox proportional hazards model. p values <0.05 were considered significant. All statistical analyses were conducted using R version 3.6.2. 22
3. RESULTS
3.1. Clinical and pathological characteristics
As shown in Table 1, the median age of the included patients was 54.5 years (range: 11–90 years). The median length of follow‐up for patients who were alive at the last follow‐up was 66 months (range: 20–192 months). There were 65 death events and 88 recurrence or metastasis events during the follow‐up period. The median OS time for those who died from OSCC was 11 months (range: 1–166 months), and the median DFS time was 7 months (range: 1–153 months). Kaplan–Meier curves for OS by TNM stage are provided in Figure S1.
3.2. Semiautomated analysis of the tumor–stroma ratio (tumor/stroma), tumor budding per tumor bed area (tumor budding/tumor bed), TIL bed area–tumor bed area ratio (TIL bed/tumor bed), CD3+ T cells per stromal area and CD8+ T cells per stromal area (CD3/stroma, CD8/stroma), and CD8+ T cell–CD3+ T cell ratio (CD8/CD3)
Through the semiautomated analyses described above, the tumor bed area, tumor area, tumor bud count, TIL bed area, CD3 area, and CD8 area in all 256 cases were measured. Based on the measurements, the values of six variables were obtained for all cases.
In the example case shown in Figure 2, the tumor bed area was 33.893 mm2, tumor area was 8.557 mm2, tumor bud count was 1651, TIL bed area was 40.790 mm2, and the CD3 area and CD8 area were 1.262 and 0.268 mm2, respectively; based on these measurements, the tumor–stroma ratio (tumor/stroma) was 0.34, and tumor budding per tumor bed area (tumor budding/tumor bed) was obtained (48.71 N/mm2), the TIL bed area–tumor bed area ratio (TIL bed/tumor bed) was 1.2, the CD3+ T cells per stromal area (CD3/stroma) and CD8+ T cells per stromal area (CD8/stroma) were 3.92% and 0.83%, respectively, and the CD8/CD3 percentage was 21.24%.
Median values with interquartile ranges of six variables in all 256 cases are shown in Table 2. When divided into two groups based on the medians, all the variables were significantly associated with prognosis by Kaplan–Meier curves for OS (Figure S2(A)) and DFS (Figure S2(B)). In the univariate and multivariate analyses, all variables except for the TIL bed area–tumor bed area ratio in the multivariate analysis were significantly associated with prognosis for OS and DFS (Table 3).
TABLE 3.
Univariate and multivariate analysis of overall survival and disease‐free survival
| Variables | No. of patients | Univariate | |||||
|---|---|---|---|---|---|---|---|
| Overall survival | Disease‐free survival | ||||||
| HR | 95% CI | p value | HR | 95% CI | p value | ||
| Age, >60 years | 88/256 | 1.808 | 1.110–2.946 | 0.017 | 1.584 | 1.039–2.417 | 0.033 |
| Sex, male | 160/256 | 1.332 | 0.791–2.241 | 0.281 | 1.159 | 0.748–1.795 | 0.508 |
| Stage | |||||||
| I–II | 122/256 | ||||||
| III | 50/256 | 2.949 | 1.364–6.378 | 0.006 | 1.898 | 0.997–3.615 | 0.051 |
| IV | 84/256 | 6.627 | 3.461–12.690 | <0.001 | 5.054 | 3.053–8.367 | <0.001 |
| Tumor/stroma, low | 128/256 | 4.960 | 2.698–9.119 | <0.001 | 4.584 | 2.780–7.559 | <0.001 |
| Tumor budding/tumor bed, high | 128/256 | 10.870 | 5.000–23.810 | <0.001 | 8.418 | 4.662–15.193 | <0.001 |
| TIL bed/tumor bed, low | 128/256 | 2.208 | 1.326–3.676 | 0.002 | 2.259 | 1.458–3.501 | <0.001 |
| CD3/stroma, low | 128/256 | 4.418 | 2.443–7.990 | <0.001 | 5.712 | 3.359–9.714 | <0.001 |
| CD8/stroma, low | 128/256 | 5.863 | 3.127–10.990 | <0.001 | 7.111 | 4.073–12.420 | <0.001 |
| CD8/CD3, low | 128/256 | 5.396 | 2.935–9.919 | <0.001 | 5.525 | 3.320–9.194 | <0.001 |
| Variables | No. of patients | Multivariate | |||||
|---|---|---|---|---|---|---|---|
| Overall survival | Disease‐free survival | ||||||
| HR | 95% CI | p value | HR | 95% CI | p value | ||
| Tumor/stroma, low | 128/256 | 2.909 | 1.509–5.606 | 0.001 | 2.951 | 1.715–5.077 | <0.001 |
| Tumor budding/tumor bed, high | 128/256 | 8.333 | 3.846–19.608 | <0.001 | 7.342 | 2.964–13.596 | <0.001 |
| TIL bed/tumor bed, low | 128/256 | 1.246 | 0.725–2.141 | 0.426 | 1.494 | 0.938–2.379 | 0.091 |
| CD3/stroma, low | 128/256 | 2.418 | 1.251–4.677 | 0.009 | 3.997 | 2.202–7.256 | <0.001 |
| CD8/stroma, low | 128/256 | 3.304 | 1.620–6.740 | 0.001 | 5.295 | 2.834–9.893 | <0.001 |
| CD8/CD3, low | 128/256 | 3.423 | 1.795–6.529 | <0.001 | 4.119 | 2.402–7.064 | <0.001 |
Note: Bold values denote statistical significance (p values ≤ 0.05). Abbreviations: CI, confidence interval; HR, hazard ratio; TIL, tumor infiltrating lymphocyte.
3.3. Classification of all cases according to pathological risk based on the scoring system
Every case was scored based on six variables (from score 0 to score 6) and classified into three risk groups as previously described. The score of the case shown in Figure 2 was 5; therefore, this case was classified in the intermediate‐risk group (Table 2). Of all 256 cases, the number of cases in the low‐risk group (score 0–3) was 148, that in the intermediate‐risk group (score 4–5) was 63, and that in the high‐risk group (score 6) was 45 (Table 4). In the multivariate Cox proportional hazards regression model based on age and stage, the risk groups were highly significant prognostic factors (Table 4). The HRs of the intermediate‐risk group and high‐risk group evaluated in each stage (I–II, III, and IV) were all significant (p ≤ 0.05), as shown in Table 4.
TABLE 4.
Subgroup analysis of overall survival and disease‐free survival according to stage
| No. of patients | Overall survival | Disease‐free survival | |||||
|---|---|---|---|---|---|---|---|
| HR | 95% CI | p value | HR | 95% CI | p value | ||
| All stages | |||||||
| Low risk | 148/256 | ||||||
| Intermediate risk | 63/256 | 5.621 | 2.723–11.600 | <0.001 | 6.085 | 3.336–11.100 | <0.001 |
| High risk | 45/256 | 17.543 | 8.754–35.160 | <0.001 | 20.318 | 11.221–36.790 | <0.001 |
| Stage I–II | |||||||
| Low risk | 102/122 | ||||||
| Intermediate risk | 16/122 | 4.926 | 1.429–17.440 | 0.014 | 3.831 | 1.428–10.280 | 0.008 |
| High risk | 4/122 | 11.337 | 2.234–57.530 | 0.004 | 42.431 | 11.019–163.390 | <0.001 |
| Stage III | |||||||
| Low risk | 27/50 | ||||||
| Intermediate risk | 14/50 | 6.083 | 1.226–30.190 | 0.027 | 7.711 | 1.599–37.190 | 0.011 |
| High risk | 9/50 | 12.464 | 2.493–62.320 | 0.002 | 14.940 | 3.072–72.670 | <0.001 |
| Stage IV | |||||||
| Low risk | 19/84 | ||||||
| Intermediate risk | 33/84 | 4.443 | 1.001–19.720 | 0.050 | 7.113 | 1.654–30.590 | 0.008 |
| High risk | 32/84 | 12.972 | 3.045–55.260 | <0.001 | 21.448 | 5.059–90.930 | <0.001 |
Note: Bold values denote statistical significance (p values ≤ 0.05). Abbreviations: CI, confidence interval; HR hazard ratio.
4. DISCUSSION
In the present study, possible risk factors based on histopathologic morphology, including the concept of the tumor percentage (tumor–stroma ratio), tumor budding, and TIL, were comprehensively reviewed. We first aimed to design a detailed and novel method to evaluate each risk factor in a way that could incorporate whole slide images and an automated process and devise a comprehensive risk prediction model by integrating each evaluated risk factor into one model.
4.1. Tumor–stroma ratio (tumor/stroma)
In most previous studies, the evaluation of whether the stroma percentage was more than or less than 50% was decided not with a quantitative evaluation but rather by the naked eye at high magnification (100×); for example, the fields with the largest amount of stroma were selected, and the fields were defined as stroma rich (≥50%) or stroma poor (<50%). 6 , 23 , 24
In this study, as we attempted to express each risk factor as a quantitative value using whole slide images and a semiautomated process, the tumor bed area and tumor area, not the stroma, were selected as the objects of measurement. Although the tumor area subtracted from the tumor bed area might not necessarily represent the stromal area, the degree of the stromal area is believed to be reflected by these two measurements that can be determined on pan‐cytokeratin‐stained slides. Through the method introduced in the current study, we tried to minimize possibly subjective steps. In the background of this attempt, there was a hypothesis that not only the presence or absence of a high stromal area but also the entire stromal area could contribute to a poor prognosis. Interestingly, the median (0.96), based on which two groups were distinguished, did not make a significant difference with the pre‐existing cutoff of 50%.
4.2. Tumor budding per tumor bed area (tumor budding/tumor bed)
An agreement was made on an international, evidence‐based standardized scoring system for tumor budding in colorectal cancer 25 ; tumor budding was determined on H&E‐stained slides and assessed in one hotspot (in a field measuring 0.785 mm2) at the invasive front. 25 Numerous studies on OSCC used a similar method; in general, five buds were adopted as the cutoff for high or low tumor budding, 9 , 12 , 13 , 14 but Angadi et al. used 10 buds. 10
Takamatsu et al. 21 recently used a novel computer‐assisted semiautomated method to evaluate tumor budding in colorectal cancer and suggested an optimal cutoff value of 12 buds as opposed to 10 buds (by the manual method). In the current study, we chose to refer to the idea described in the study by Takamatsu et al. on T1 colorectal cancer 21 to determine the range of the tumor budding area: 100–700 μm2 (Figure 3). Through automated detection, tumor bud counts of all 256 cases were obtained, which ranged from 0 to 10 777 buds.
Tumor budding on the whole slide image with tumor bed area in the denominator (tumor budding/tumor bed area) was determined as a parameter for the following reasons: (1) to minimalize the subjective process, including selecting the “hot spot”; (2) to include intratumoral tumor budding 25 , 26 ; and (3) to not exclude the possibility that the whole amount of tumor budding, not only the existence of one hot spot area, might be related to prognosis. The cutoff used in the conventional method, five buds at 200× magnification (in a field measuring 0.785 mm2), is approximately 6.4 N/mm2 when converted into the same unit. In other words, the average tumor bud count of the whole slide image with a cutoff of 4.26 N/mm2 was used instead of the hotspot tumor bud count, with a cutoff of 6.4 N/mm2, in the current study.
4.3. TIL‐associated variables (TIL bed/tumor bed, CD3/stroma, CD8/stroma, and CD8/CD3)
The assessment of TILs is currently gaining importance and has been the focus of numerous researchers. The concept of the Immunoscore was suggested as a potential indicator of prognostic information and therapeutic management 27 , 28 , 29 ; by definition, the Immunoscore contains the quantification of CD3+ and CD8+ cells in two regions: the center of the tumor (CT) and the IM. 27 The International Immuno‐oncology Biomarker Working Group suggested guidelines for the overall assessment of TILs in solid tumors 30 ; it is recommended to report stromal TILs (sTILs) and intratumoral TILs (iTILs) separately; one full section is preferred over biopsies, and a full assessment of the average TILs in the tumor area should be used rather than focusing on hotspots; and TILs should be assessed as continuous variables. 30 Due to the complexity, the evaluation of TILs is inevitably limited in routine practice despite its prognostic power.
As there is no consensus methodology for evaluating TILs in head and neck squamous cell carcinoma (HNSCC), 31 , 32 there is not enough evidence to evaluate sTILs and iTILs individually or to separate CT and IM. Additionally, it has been suggested that TILs are able to migrate within a living tissue microenvironment, and as iTILs tend to parallel sTILs, scoring iTILs does not provide any more information than scoring sTILs. 33 Similarly, distinction of TILs in CT and IM might not be necessary as they can migrate within the TIL bed. As OSCCs tend to show dense TILs in the tumor margin area with marked variation in the “thickness” of the area, defining a 1 mm distance as the diameter of the IM area may have limitations. Therefore, the current study evaluated the amount of area occupied by TILs in the whole TIL bed area without arbitrarily dividing the compartment.
We thought that densely packed TILs in the periphery of tumors should be included in the TIL evaluation and therefore chose the TIL bed to be reflected as background in the TIL assessment. When we collected data on the TIL bed from all 256 cases, the degree of TIL aggregates in the tumor IM showed marked variation. This led us to hypothesize that the TIL bed itself, which is the background of the TIL assessment, partly reflects prognosis. Accordingly, the first variable from the TIL‐associated measurement was the TIL bed area–tumor bed area ratio (TIL bed/tumor bed).
The next variables obtained from TIL measurements were the CD3+ T cells per stromal area (CD3/stroma) and CD8+ T cells per stromal area (CD8/stroma), which were obtained from area measurements of CD3‐stained slides and CD8‐stained slides, respectively, and previously collected TIL bed areas and tumor areas. An additional variable, the CD8+ T cell–CD3+ T cell ratio (CD8/CD3), was also included. The measured area was obtained using an automated process rather than counts of each cell type, as suggested by recommendations from the International Immuno‐oncology Biomarker Working Group. 30
As described previously, CD3/stroma and CD8/stroma were both associated with prognosis, with a higher HR of CD8/stroma for both OS and DFS (Table 3). These results are consistent with those from numerous previous studies that have shown the powerfulness of CD8+ T cells in prognostic assessments. 32 , 34 , 35 , 36 , 37 , 38 In this study, a novel parameter, CD8/CD3, was suggested for two reasons: (1) CD8+ T cells seem to be superior prognostic indicators to other markers, and we wanted to reflect the importance of CD8+ T cells; and (2) among the cases showing CD3‐high/CD8‐high or CD3‐low/CD8‐low, there existed a subgroup of cases showing a high CD8/CD3 ratio, which might be linked to different prognoses.
4.4. Proposal of the scoring and grading system for predicting pathological risk
In the current study, a simple scoring system was proposed in which one point per variable was added if the value of the variable was associated with a poor prognosis, and the grading risk was determined according to the score (Table 2). This type of scoring system was previously verified and used in various types of cancer: the Nottingham histologic grade in breast cancer, the FNCLCC grade in soft tissue sarcoma, the histological grade in mucoepidermoid carcinoma, and the pheochromocytoma of the adrenal gland scaled score (PASS).
To our knowledge, this is the first attempt to generate a prognosis prediction model by quantifying and integrating pathological risk factors. Although the risk factors that can be extracted from microscopic findings have been emphasized by numerous researchers, these aspects of tumors cannot reflect the cancer stage or used to predict prognosis in a clinical setting. One of the reasons for the gap might be that such pathologic risk factors have been studied individually and not integrated into a comprehensive model. Another reason might be due to the difficulty associated with establishing a standard evaluation method for each risk factor. Due to the development of methods that incorporate whole slide images and image findings, the quantification and automated measurement of the aspects of tumors, including the tumor area, TIL area, and tumor budding, have become possible. The current study attempted to actively utilize such developments to propose a novel prediction model.
In recent years, research using deep learning has become active and extensive, and the same is true in the field of cancer research, especially prognosis prediction. 39 In contrast to several well‐investigated cancer types, such as colorectal cancer and breast cancer, there are relatively few studies on deep learning applications in OSCC, and most have focused on the diagnosis and identification of pathologic characteristics rather than prognostic factors. 40 Although artificial intelligence has proved an excellent performance across various cancer types, one of the major limitations challenging its clinical application is the “black box” problem, which refers to difficulty in understanding how the complex artificial intelligence model arrives at its decisions. 41 In this respect, the current study attempted to extract and calculate information that could predict the prognosis from pathological features in a deductive way, which is in contrast to the “black box” problem.
The limitation of this scoring system, which is not an issue with the deep learning method, is that the possibility of risk factors other than those included in the current study could not be considered. As a comparatively simplified grading system, it also could not calculate and reflect the degree of each variable's contribution to risk by uniformly giving the same point to all variables. Additionally, measurements of each area on H&E‐stained slides are difficult in the same semiautomated method, because this method used difference in color on the immunohistochemical staining slides. This could be overcome when applying the deep learning method. Nevertheless, we believe that this approach might be applied in a complementary manner to deep learning in prognosis prediction in the future when artificial intelligence becomes more universally applicable in the clinic.
In conclusion, the current study proposed novel semiautomated methods to evaluate pathological risk factors using whole slide images. Ultimately, we tried to develop a novel scoring system to comprehensively assess the pathological risk factors and evaluate the prognostic prediction power for both OS and DFS. Further studies to validate this scoring system, especially in conjunction with deep learning methods, might be necessary to better predict prognosis in patients with OSCC.
CONFLICT OF INTEREST
The author declares that there is no conflict of interest that could be perceived as prejudicing the impartiality of the research reported.
Supporting information
Appendix S1: Supplementary Information
Sung YE, Kim M‐S, Lee YS. Proposal of a scoring system for predicting pathological risk based on a semiautomated analysis of whole slide images in oral squamous cell carcinoma. Head & Neck. 2021;43:1581–1591. 10.1002/hed.26621
Section Editor: Diana Bell
[Correction added on 05 February 2021, after first online publication: The academic degrees of Dr. Min‐Sik Kim and Dr. Youn Soo Lee has been updated.]
DATA AVAILABILITY STATEMENT
The data that support the findings of this study are available from the corresponding author upon reasonable request.
REFERENCES
- 1. Ferlay J, Colombet M, Soerjomataram I, et al. Estimating the global cancer incidence and mortality in 2018: GLOBOCAN sources and methods. Int J Cancer. 2019;144:1941‐1953. [DOI] [PubMed] [Google Scholar]
- 2. American Joint Committee on Cancer . Cancer Staging Manual. 8th ed. New York: Springer; 2017. [Google Scholar]
- 3. Vangangelt KMH, Tollenaar LSA, van Pelt GW, et al. The prognostic value of tumor–stroma ratio in tumor‐positive axillary lymph nodes of breast cancer patients. Int J Cancer. 2018;143:3194‐3200. [DOI] [PubMed] [Google Scholar]
- 4. Aurello P, Berardi G, Giulitti D, et al. Tumor–stroma ratio is an independent predictor for overall survival and disease free survival in gastric cancer patients. Surgeon. 2017;15:329‐335. [DOI] [PubMed] [Google Scholar]
- 5. Jakubowska K, Kisielewski W, Kanczuga‐Koda L, Koda M, Famulski W. Diagnostic value of inflammatory cell infiltrates, tumor stroma percentage and disease‐free survival in patients with colorectal cancer. Oncol Lett. 2017;14:3869‐3877. [DOI] [PMC free article] [PubMed] [Google Scholar]
- 6. Almangush A, Heikkinen I, Bakhti N, et al. Prognostic impact of tumour–stroma ratio in early‐stage oral tongue cancers. Histopathology. 2018;72:1128‐1135. [DOI] [PubMed] [Google Scholar]
- 7. Hase K, Shatney C, Johnson D, Trollope M, Vierra M. Prognostic value of tumor “budding” in patients with colorectal cancer. Dis Colon Rectum. 1993;36:627‐635. [DOI] [PubMed] [Google Scholar]
- 8. Ueno H, Murphy J, Jass JR, Mochizuki H, Talbot IC. Tumour “budding” as an index to estimate the potential of aggressiveness in rectal cancer. Histopathology. 2002;40:127‐132. [DOI] [PubMed] [Google Scholar]
- 9. Wang C, Huang H, Huang Z, et al. Tumor budding correlates with poor prognosis and epithelial–mesenchymal transition in tongue squamous cell carcinoma. J Oral Pathol Med. 2011;40:545‐551. [DOI] [PMC free article] [PubMed] [Google Scholar]
- 10. Angadi PV, Patil PV, Hallikeri K, Mallapur MD, Hallikerimath S, Kale AD. Tumor budding is an independent prognostic factor for prediction of lymph node metastasis in oral squamous cell carcinoma. Int J Surg Pathol. 2015;23:102‐110. [DOI] [PubMed] [Google Scholar]
- 11. Jensen DH, Dabelsteen E, Specht L, et al. Molecular profiling of tumour budding implicates TGFbeta‐mediated epithelial–mesenchymal transition as a therapeutic target in oral squamous cell carcinoma. J Pathol. 2015;236:505‐516. [DOI] [PubMed] [Google Scholar]
- 12. Almangush A, Bello IO, Keski‐Santti H, et al. Depth of invasion, tumor budding, and worst pattern of invasion: prognostic indicators in early‐stage oral tongue cancer. Head Neck. 2014;36:811‐818. [DOI] [PMC free article] [PubMed] [Google Scholar]
- 13. Attramadal CG, Kumar S, Boysen ME, Dhakal HP, Nesland JM, Bryne M. Tumor budding, EMT and cancer stem cells in T1‐2/N0 oral squamous cell carcinomas. Anticancer Res. 2015;35:6111‐6120. [PubMed] [Google Scholar]
- 14. Xie N, Wang C, Liu X, et al. Tumor budding correlates with occult cervical lymph node metastasis and poor prognosis in clinical early‐stage tongue squamous cell carcinoma. J Oral Pathol Med. 2015;44:266‐272. [DOI] [PubMed] [Google Scholar]
- 15. Pedersen NJ, Jensen DH, Lelkaitis G, et al. Construction of a pathological risk model of occult lymph node metastases for prognostication by semi‐automated image analysis of tumor budding in early‐stage oral squamous cell carcinoma. Oncotarget. 2017;8:18227‐18237. [DOI] [PMC free article] [PubMed] [Google Scholar]
- 16. Gajewski TF, Schreiber H, Fu YX. Innate and adaptive immune cells in the tumor microenvironment. Nat Immunol. 2013;14:1014‐1022. [DOI] [PMC free article] [PubMed] [Google Scholar]
- 17. Coulie PG, Van den Eynde BJ, van der Bruggen P, Boon T. Tumour antigens recognized by T lymphocytes: at the core of cancer immunotherapy. Nat Rev Cancer. 2014;14:135‐146. [DOI] [PubMed] [Google Scholar]
- 18. Pages F, Galon J, Dieu‐Nosjean MC, Tartour E, Sautes‐Fridman C, Fridman WH. Immune infiltration in human tumors: a prognostic factor that should not be ignored. Oncogene. 2010;29:1093‐1102. [DOI] [PubMed] [Google Scholar]
- 19. Fridman WH, Pages F, Sautes‐Fridman C, Galon J. The immune contexture in human tumours: impact on clinical outcome. Nat Rev Cancer. 2012;12:298‐306. [DOI] [PubMed] [Google Scholar]
- 20. Sharma M, Sah P, Sharma SS, Radhakrishnan R. Molecular changes in invasive front of oral cancer. J Oral Maxillofac Pathol. 2013;17:240‐247. [DOI] [PMC free article] [PubMed] [Google Scholar]
- 21. Takamatsu M, Kawachi H, Yamamoto N, et al. Immunohistochemical evaluation of tumor budding for stratifying T1 colorectal cancer: optimal cut‐off value and a novel computer‐assisted semiautomatic method. Mod Pathol. 2019;32:675‐683. [DOI] [PubMed] [Google Scholar]
- 22. R Core Team . R: A Language and Environment for Statistical Computing. Vienna, Austria: R Foundation for Statistical Computing; 2019. [Google Scholar]
- 23. Karpathiou G, Vieville M, Gavid M, et al. Prognostic significance of tumor budding, tumor–stroma ratio, cell nests size, and stroma type in laryngeal and pharyngeal squamous cell carcinomas. Head Neck. 2019;41:1918‐1927. [DOI] [PubMed] [Google Scholar]
- 24. Wu J, Liang C, Chen M, Su W. Association between tumor–stroma ratio and prognosis in solid tumor patients: a systematic review and meta‐analysis. Oncotarget. 2016;7:68954‐68965. [DOI] [PMC free article] [PubMed] [Google Scholar]
- 25. Lugli A, Kirsch R, Ajioka Y, et al. Recommendations for reporting tumor budding in colorectal cancer based on the International Tumor Budding Consensus Conference (ITBCC) 2016. Mod Pathol. 2017;30:1299‐1311. [DOI] [PubMed] [Google Scholar]
- 26. Kale AD, Angadi PV. Tumor budding is a potential histopathological marker in the prognosis of oral squamous cell carcinoma: current status and future prospects. J Oral Maxillofac Pathol. 2019;23:318‐323. [DOI] [PMC free article] [PubMed] [Google Scholar]
- 27. Galon J, Pages F, Marincola FM, et al. Cancer classification using the Immunoscore: a worldwide task force. J Transl Med. 2012;10:205. [DOI] [PMC free article] [PubMed] [Google Scholar]
- 28. Galon J, Mlecnik B, Bindea G, et al. Towards the introduction of the “Immunoscore” in the classification of malignant tumours. J Pathol. 2014;232:199‐209. [DOI] [PMC free article] [PubMed] [Google Scholar]
- 29. Kirilovsky A, Marliot F, El Sissy C, Haicheur N, Galon J, Pages F. Rational bases for the use of the Immunoscore in routine clinical settings as a prognostic and predictive biomarker in cancer patients. Int Immunol. 2016;28:373‐382. [DOI] [PMC free article] [PubMed] [Google Scholar]
- 30. Hendry S, Salgado R, Gevaert T, et al. Assessing tumor‐infiltrating lymphocytes in solid tumors: a practical review for pathologists and proposal for a standardized method from the International Immunooncology Biomarkers Working Group: part 1: assessing the host immune response, TILs in invasive breast carcinoma and ductal carcinoma in situ, metastatic tumor deposits and areas for further research. Adv Anat Pathol. 2017;24:235‐251. [DOI] [PMC free article] [PubMed] [Google Scholar]
- 31. Hendry S, Salgado R, Gevaert T, et al. Assessing tumor‐infiltrating lymphocytes in solid tumors: a practical review for pathologists and proposal for a standardized method from the International Immuno‐oncology Biomarkers Working Group: part 2: TILs in melanoma, gastrointestinal tract carcinomas, non‐small cell lung carcinoma and mesothelioma, endometrial and ovarian carcinomas, squamous cell carcinoma of the head and neck, genitourinary carcinomas, and primary brain tumors. Adv Anat Pathol. 2017;24:311‐335. [DOI] [PMC free article] [PubMed] [Google Scholar]
- 32. De Meulenaere A, Vermassen T, Aspeslagh S, Vandecasteele K, Rottey S, Ferdinande L. TILs in head and neck cancer: ready for clinical implementation and why (not)? Head Neck Pathol. 2017;11:354‐363. [DOI] [PMC free article] [PubMed] [Google Scholar]
- 33. Salgado R, Denkert C, Demaria S, et al. The evaluation of tumor‐infiltrating lymphocytes (TILs) in breast cancer: recommendations by an International TILs Working Group 2014. Ann Oncol. 2015;26:259‐271. [DOI] [PMC free article] [PubMed] [Google Scholar]
- 34. Balermpas P, Rodel F, Rodel C, et al. CD8+ tumour‐infiltrating lymphocytes in relation to HPV status and clinical outcome in patients with head and neck cancer after postoperative chemoradiotherapy: a multicentre study of the German Cancer Consortium Radiation Oncology Group (DKTK‐ROG). Int J Cancer. 2016;138:171‐181. [DOI] [PubMed] [Google Scholar]
- 35. Sun C, Xu J, Song J, et al. The predictive value of centre tumour CD8(+) T cells in patients with hepatocellular carcinoma: comparison with Immunoscore. Oncotarget. 2015;6:35602‐35615. [DOI] [PMC free article] [PubMed] [Google Scholar]
- 36. Donnem T, Hald SM, Paulsen EE, et al. Stromal CD8+ T‐cell density—a promising supplement to TNM staging in non‐small cell lung cancer. Clin Cancer Res. 2015;21:2635‐2643. [DOI] [PubMed] [Google Scholar]
- 37. Uppaluri R, Dunn GP, Lewis JS Jr. Focus on TILs: prognostic significance of tumor infiltrating lymphocytes in head and neck cancers. Cancer Immun. 2008;8:16. [PMC free article] [PubMed] [Google Scholar]
- 38. Snyderman CH, Heo DS, Chen K, Whiteside TL, Johnson JT. T‐cell markers in tumor‐infiltrating lymphocytes of head and neck cancer. Head Neck. 1989;11:331‐336. [DOI] [PubMed] [Google Scholar]
- 39. Zhu W, Xie L, Han J, Guo X. The application of deep learning in cancer prognosis prediction. Cancers (Basel). 2020;12:603. [DOI] [PMC free article] [PubMed] [Google Scholar]
- 40. Sultan AS, Elgharib MA, Tavares T, Jessri M, Basile JR. The use of artificial intelligence, machine learning and deep learning in oncologic histopathology. J Oral Pathol Med. 2020;49:849‐856. [DOI] [PubMed] [Google Scholar]
- 41. Acs B, Rantalainen M, Hartman J. Artificial intelligence as the next step towards precision pathology. J Intern Med. 2020;288:62‐81. [DOI] [PubMed] [Google Scholar]
Associated Data
This section collects any data citations, data availability statements, or supplementary materials included in this article.
Supplementary Materials
Appendix S1: Supplementary Information
Data Availability Statement
The data that support the findings of this study are available from the corresponding author upon reasonable request.