

Abstract
Objectives
To estimate the burden of non‐communicable diseases (NCDs) and mortality among PLHIV in the pre‐, early‐ and late‐HAART (highly active antiretroviral therapy) era.
Methods
We conducted a cohort study using population‐based Danish medical registries including all adult HIV‐infected residents of the Central Denmark Region during 1985–2017. For each HIV patient, we selected 10 comparisons from the background population matched by age, sex and municipality of residence. Based on hospital‐related diagnoses we estimated the prevalence and incidence of specific NCD at diagnosis and at 5 and 10 years.
Results
We identified 1043 PLHIV and 10 430 matched comparisons. PLHIV had lower socioeconomic status and more were born outside western Europe. At HIV diagnosis, 21.9% of PHLIV vs. 18.2% of non‐HIV individuals had at least one NCD, increasing to 42.2% vs. 25.9% after 10 years. PLHIV had higher prevalence and cumulative incidence of alcohol abuse, chronic obstructive pulmonary disease (COPD), ischaemic heart disease, mental disorders, renal and liver disease, but no increased risk of diabetes mellitus. Only PLHIV in the age groups 41–50 and > 51 years had an increased incidence of osteoporosis. From the pre‐ to the late‐HAART era, 10‐year mortality among PLHIV decreased from 45.5% to 9.4% but continued at more than twice that of uninfected comparisons. However, in the late‐HAART era, the mortality of PLHIV who were alive 2 years after HIV diagnosis was approaching that of comparisons.
Conclusions
Even in the late‐HAART era, PLHIV have an excess mortality, which may be attributable to several NCDs being more prevalent among PLHIV. The prevalence rates of ischaemic heart disease, diabetes, osteoporosis and renal disease tend to increase over calendar time. Therefore, improvement of survival and quality of life of PLHIV neets strategies to reduce the risk of developing NCDs, including avoiding toxic antiretroviral therapy and lifestyle changes.
Keywords: chronic obstructive pulmonary disease, diabetes mellitus, HIV, ischaemic heart disease, liver disease, mental disorders, mortality, non‐communicable diseases, osteoporosis, renal disease
Introduction
Antiretroviral therapy (ART) has resulted in HIV infection becoming a chronic medical condition. The life expectancy of people living with HIV (PLHIV) has gradually improved, approaching that of the general population [1, 2]. Consequently, PLHIV are surviving to older age and requiring lifelong care and treatment. The proportion of PLHIV > 50 years old is predicted to increase to 73% in 2030 [3].
Despite a dramatic decrease in HIV/AIDS‐related mortality, even well‐treated PLHIV have a decreased life expectancy compared with individuals without HIV [4, 5]. HIV/AIDS‐related deaths remain high in the first year after HIV diagnosis, primarily among late presenters. However, after the first year of ART, the excess mortality is primarily caused by non‐communicable diseases (NCDs) [6, 7].
Across all age groups, PLHIV have a disproportionate risk of NCDs, mental disorders, and alcohol‐ and substance‐use disorders [1, 8, 9, 10]. This may be caused by a higher prevalence of traditional risk factors for chronic diseases such as tobacco and alcohol use, risk behaviour related to HIV transmission, intrinsic to HIV or ART‐related toxicities [11]. Unhealthy lifestyle has been shown to be more frequent among PLHIV than among the general population [12, 13, 14]. Chronic inflammation has been associated with premature ageing and may predispose to NCDs [15]. The prevalence of NCDs in PLHIV may correspond to that observed in HIV‐uninfected people who are 10 years older [16]. Also, antiretroviral drugs have been implicated in the development of cardiovascular disease (CVD), diabetes, osteoporosis and nephrotoxicity [12].
The aim of this study was to describe the prevalence of NCDs among PLHIV at the time of diagnosis, and the mortality and occurrence of NCDs over calendar time and by age compared with the background population, with a focus on the changes during the pre‐, early‐ and late‐HAART (highly active antiretroviral therapy) era.
Methods
Setting
The estimated HIV prevalence in Denmark is approximately 0.1% in the adult population. The Danish National Health Service provides free tax‐funded medical care to all residents, including access to hospitals, outpatient speciality clinics and HIV medicine [17]. Denmark is divided into five administrative entities, each representative of the Danish population with respect to demographic characteristics and healthcare usage and medication use [17]. This population‐based study was conducted in the Central Denmark Region with a population of approximately 1.3 million during 1985–2017. The estimated HIV prevalence in the Central Denmark Region is 0.6‰ in the adult population. In this region, PLHIV are treated in outpatient HIV clinics at Aarhus University Hospital and Regional Hospital West Jutland. We defined three eras with reference to treatment modalities: pre‐HAART (1985–1996), early HAART (1996–2005), and late HAART (2006–2017).
Data sources
Since 1968 a unique personal identifier has been assigned to all residents at birth or upon immigration by the Civil Registration System (CRS) [18]. This identifier allows unambiguous data linkage at individual level. The CRS also tracks changes in vital status and migration for the entire population with daily updates. We used this personal identifier to link data from the various registries.
The Danish National Patient Registry (DNPR) includes data on all admissions to Danish hospitals since 1977, and emergency room and outpatient clinic visits since 1995. Diagnoses are classified according to the International Classification of Diseases, Eighth Revision (ICD‐8) until 1994, and Tenth Revision (ICD‐10) thereafter [19].
The InfCare HIV database is a clinical decision support tool based on the RealQ® Decision Support platform developed by Health Solutions AB, Stockholm, Sweden. Since 2010 InfCare HIV has been used at the HIV clinics in Central Denmark Region [20].
The Danish HIV Cohort Study (DHCS) is a nationwide, prospective population‐based cohort that includes all HIV‐infected individuals treated at Danish hospitals since 1 January 1995 [1].
Statistics Denmark’s databases on municipal services contain individual‐level information about weekly allocated home care and rehabilitation and training (on a yes/no basis only, without specifying the extent of the training).
The Education Register contains information about the highest level of completed education and the date of completion.
Study populations
We used data from the InfCare HIV database, DHCS and the DNPR to identify all residents of the Central Denmark Region who were 18 years or older with an HIV diagnosis first registered during 1985–2017 and who had at least one contact to one of the two HIV centres in the Central Denmark Region.
For each HIV patient we randomly selected 10 persons from the general population as a comparison cohort matched on birth year, sex and municipality of residence at time of HIV diagnosis. Comparisons could not have a known diagnosis of HIV at date of inclusion.
Non‐communicable diseases at time of HIV diagnosis
We obtained information on alcohol abuse, chronic obstructive pulmonary disease (COPD), diabetes, ischaemic heart disease (IHD), liver disease, osteoporosis, defined as a diagnosis or an osteoporotic fracture or anti‐resorptive treatment, renal disease and mental disorders registered any time before the HIV diagnosis/index date for comparisons through the DNPR (see Appendix 1 for included codes). To summarize burden of comorbidity, we additionally defined comorbidity according to the Charlson Comorbidity Index (CCI) score [21]. We did not include the HIV diagnosis when computing this score. We categorized the CCI score as 0, 1 or ≥ 2. We also simply counted the number of NCDs without giving them a specific weight.
Covariates
From Statistics Denmark we obtained information on the highest obtained education before index date, grouped as primary school, secondary school, higher education and missing. We similarly obtained information on income for the year prior to the index date adjusted for inflation.
From the CRS we obtained information on country of birth and grouped persons as descending from western Europe (yes/no) (see Appendix 1 for the definition of western Europe).
Statistical analysis
We described baseline characteristics for HIV patients and their comparison cohort. Income and age were presented as median and interquartile range (IQR). We followed patients from date of initial HIV diagnosis and comparisons from index date until occurrence of NCD, death, emigration, or 31 December 2017, whichever came first. Additionally, to address the potential effect of late presenters on our estimates we conducted an analysis restricted to PLHIV who were alive 2 years after the date of HIV diagnosis by starting follow‐up 2 years after that date. We estimated and plotted the cumulative incidence of death for the PLHIV and non‐HIV cohorts, respectively, during the first 10 years of follow‐up. We plotted the cumulative incidence of the specific NCD for PLHIV and HIV‐uninfected individuals at baseline and estimated the incidence after 5 and 10 years, respectively, while treating death as a competing risk. We computed the analyses overall and stratified analyses according to age categories (< 31, 31–40, 41–50, > 51 years) and index year period and baseline CCI score.
All statistical analyses were conducted using the statistical software package SAS v.9.4 (SAS Institute, Cary, NC, USA) and the open‐source statistical package R v.3.6.1.
Results
Study populations
We identified 1043 PLHIV and 10 430 HIV‐uninfected comparisons who fulfilled the study population inclusion criteria. In all, 29.5% were diagnosed in the pre‐HAART period, 31.4% in the early‐HAART period, and 39.0% in the late‐HAART period. The median (IQR) age at HIV diagnosis was 36.6 (29.3–45.5) years with 19.8% > 50 years old; 71.6% were men. Only 71.9% of PLHIV were born in western Europe compared with 93.5% of the non‐HIV population. PLHIV had lower incomes and education levels compared with the non‐HIV cohort, and this was also true when only data on individuals born in western Europe were analysed. PLHIV from western Europe had higher income and longer education than patients originating from other parts of the world (Tables 1 and 2).
Table 1.
Baseline characteristics of the study population stratified by age group
| Age group | ||||||||||
|---|---|---|---|---|---|---|---|---|---|---|
| All patients | < 31 years | 31–40 years | 41–50 years | > 51 years | ||||||
| Non‐HIV | HIV | Non‐HIV | HIV | Non‐HIV | HIV | Non‐HIV | HIV | Non‐HIV | HIV | |
| Total (N) | 10 430 | 1043 | 2828 | 281 | 3457 | 350 | 2542 | 248 | 1603 | 164 |
| Index year period | ||||||||||
| 1985–1995 | 3080 (29.5) | 308 (29.5) | 1162 (41.1) | 115 (40.9) | 1044 (30.2) | 108 (30.9) | 609 (24.0) | 57 (23.0) | 265 (16.5) | 28 (17.1) |
| 1996–2005 | 3280 (31.4) | 328 (31.4) | 801 (28.3) | 81 (28.8) | 1204 (34.8) | 118 (33.7) | 727 (28.6) | 72 (29.0) | 548 (34.2) | 57 (34.8) |
| 2006–2017 | 4070 (39.0) | 407 (39.0) | 865 (30.6) | 85 (30.2) | 1209 (35.0) | 124 (35.4) | 1206 (47.4) | 119 (48.0) | 790 (49.3) | 79 (48.2) |
| CD4 level (cells/μL) | ||||||||||
| Very low (< 200) | 0 (0.0) | 186 (17.8) | 0 (0.0) | 27 (9.6) | 0 (0.0) | 60 (17.1) | 0 (0.0) | 60 (24.2) | 0 (0.0) | 39 (23.8) |
| Low (200–500) | 0 (0.0) | 201 (19.3) | 0 (0.0) | 52 (18.5) | 0 (0.0) | 62 (17.7) | 0 (0.0) | 52 (21.0) | 0 (0.0) | 35 (21.3) |
| Normal (+500) | 0 (0.0) | 132 (12.7) | 0 (0.0) | 40 (14.2) | 0 (0.0) | 45 (12.9) | 0 (0.0) | 29 (11.7) | 0 (0.0) | 18 (11.0) |
| Unknown | 10 430 (100.0) | 524 (50.2) | 2828 (100.0) | 162 (57.7) | 3457 (100.0) | 183 (52.3) | 2542 (100.0) | 107 (43.1) | 1603 (100.0) | 72 (43.9) |
| Males | 7470 (71.6) | 747 (71.6) | 1685 (59.6) | 167 (59.4) | 2362 (68.3) | 238 (68.0) | 2075 (81.6) | 204 (82.3) | 1348 (84.1) | 138 (84.1) |
| Born in western Europe | 9748 (93.5) | 750 (71.9) | 2660 (94.1) | 174 (61.9) | 3173 (91.8) | 225 (64.3) | 2376 (93.5) | 197 (79.4) | 1539 (96.0) | 154 (93.9) |
| Age (years) [median (IQR)] | 36.5 (29.5–45.5) | 36.6 (29.3–45.5) | 26.2 (23.3–28.2) | 26.1 (23.4–28.3) | 34.4 (32.2–37.3) | 34.4 (32.1–37.3) | 44.3 (42.1–46.8) | 44.4 (42.0–46.7) | 56.4 (52.2–62.3) | 56.1 (52.0–62.3) |
| Income (DKK 100 000) [median (IQR)] | 3.0 (2.0–4.0) | 2.2 (1.3–3.3) | 2.0 (1.2–2.9) | 1.5 (0.7–2.2) | 3.2 (2.3–4.1) | 2.4 (1.3–3.4) | 3.7 (2.8–4.8) | 2.7 (1.7–4.0) | 3.1 (2.0–4.3) | 2.7 (1.9–4.1) |
| Highest completed education | ||||||||||
| Primary school | 2479 (23.8) | 319 (30.6) | 726 (25.7) | 97 (34.5) | 713 (20.6) | 102 (29.1) | 503 (19.8) | 62 (25.0) | 537 (33.5) | 58 (35.4) |
| Secondary school | 4956 (47.5) | 406 (38.9) | 1506 (53.3) | 108 (38.4) | 1586 (45.9) | 132 (37.7) | 1217 (47.9) | 110 (44.4) | 647 (40.4) | 56 (34.1) |
| Higher education | 2766 (26.5) | 218 (20.9) | 527 (18.6) | 40 (14.2) | 1084 (31.4) | 76 (21.7) | 776 (30.5) | 62 (25.0) | 379 (23.6) | 40 (24.4) |
| Missing | 229 (2.2) | 100 (9.6) | 69 (2.4) | 36 (12.8) | 74 (2.1) | 40 (11.4) | 46 (1.8) | 14 (5.6) | 40 (2.5) | 10 (6.1) |
| Charlson Comorbidity Index score | ||||||||||
| 0 | 9474 (90.8) | 897 (86.0) | 2688 (95.0) | 263 (93.6) | 3249 (94.0) | 316 (90.3) | 2314 (91.0) | 213 (85.9) | 1223 (76.3) | 105 (64.0) |
| 1 | 589 (5.6) | 74 (7.1) | 109 (3.9) | 13 (4.6) | 148 (4.3) | 18 (5.1) | 133 (5.2) | 22 (8.9) | 199 (12.4) | 21 (12.8) |
| +2 | 367 (3.5) | 72 (6.9) | 31 (1.1) | 5 (1.8) | 60 (1.7) | 16 (4.6) | 95 (3.7) | 13 (5.2) | 181 (11.3) | 38 (23.2) |
| Alcohol abuse | 269 (2.6) | 56 (5.4) | 55 (1.9) | 5 (1.8) | 77 (2.2) | 21 (6.0) | 75 (3.0) | 18 (7.3) | 62 (3.9) | 12 (7.3) |
| Chronic obstructive pulmonary disease | 262 (2.5) | 33 (3.2) | 71 (2.5) | 8 (2.8) | 79 (2.3) | 6 (1.7) | 57 (2.2) | 7 (2.8) | 55 (3.4) | 12 (7.3) |
| Diabetes | 212 (2.0) | 20 (1.9) | 21 (0.7) | N/A | 38 (1.1) | N/A | 64 (2.5) | N/A | 89 (5.6) | N/A |
| Ischaemic heart disease | 153 (1.5) | 20 (1.9) | N/A | N/A | N/A | N/A | N/A | N/A | N/A | N/A |
| Liver disease | 64 (0.6) | 35 (3.4) | N/A | N/A | N/A | N/A | N/A | N/A | N/A | N/A |
| Mental disorders | 577 (5.5) | 96 (9.2) | 130 (4.6) | 20 (7.1) | 186 (5.4) | 34 (9.7) | 160 (6.3) | 23 (9.3) | 101 (6.3) | 19 (11.6) |
| Renal disease | 48 (0.5) | 13 (1.2) | 7 (0.2) | N/A | 14 (0.4) | N/A | 15 (0.6) | N/A | 12 (0.7) | N/A |
| Osteoporosis/fracture | 895 (8.6) | 74 (7.1) | 248 (8.8) | 15 (5.3) | 293 (8.5) | 24 (6.9) | 218 (8.6) | 21 (8.5) | 136 (8.5) | 14 (8.5) |
| Angiotensin‐converting enzyme inhibitors | 222 (2.1) | 26 (2.5) | N/A | N/A | N/A | N/A | N/A | N/A | N/A | N/A |
| Antihypertensive treatment | 279 (2.7) | 25 (2.4) | N/A | N/A | N/A | N/A | N/A | N/A | N/A | N/A |
| Angiotensin II antagonists | 607 (5.8) | 60 (5.8) | 21 (0.7) | N/A | 56 (1.6) | N/A | 155 (6.1) | N/A | 375 (23.4) | N/A |
| Oral steroids | 231 (2.2) | 15 (1.4) | 6 (0.2) | N/A | 18 (0.5) | N/A | 64 (2.5) | N/A | 143 (8.9) | N/A |
| Statins | 141 (1.4) | 11 (1.1) | N/A | 0 (0.0) | N/A | 0 (0.0) | N/A | 6 (2.4) | N/A | 5 (3.0) |
| Thrombocyte‐aggregation prophylaxis | 202 (1.9) | 33 (3.2) | 33 (1.2) | 0 (0.0) | 55 (1.6) | 9 (2.6) | 60 (2.4) | 12 (4.8) | 54 (3.4) | 12 (7.3) |
IQR, interquartile range.
Table 2.
Baseline characteristics of the study population stratified by index year period
| Index year period | ||||||||
|---|---|---|---|---|---|---|---|---|
| All patients | 1985–1995 | 1996–2005 | 2006–2017 | |||||
| Non‐HIV | HIV | Non‐HIV | HIV | Non‐HIV | HIV | Non‐HIV | HIV | |
| Total (N) | 10 430 | 1043 | 3080 | 308 | 3280 | 328 | 4070 | 407 |
| Age group (years) | ||||||||
| < 31 | 2828 (27.1) | 281 (26.9) | 1162 (37.7) | 115 (37.3) | 801 (24.4) | 81 (24.7) | 865 (21.3) | 85 (20.9) |
| 31–40 | 3457 (33.1) | 350 (33.6) | 1044 (33.9) | 108 (35.1) | 1204 (36.7) | 118 (36.0) | 1209 (29.7) | 124 (30.5) |
| 41–50 | 2542 (24.4) | 248 (23.8) | 609 (19.8) | 57 (18.5) | 727 (22.2) | 72 (22.0) | 1206 (29.6) | 119 (29.2) |
| > 51 | 1603 (15.4) | 164 (15.7) | 265 (8.6) | 28 (9.1) | 548 (16.7) | 57 (17.4) | 790 (19.4) | 79 (19.4) |
| CD4 level (cells/μL) | N/A | N/A | N/A | |||||
| Very low (< 200) | 0 (0.0) | 186 (17.8) | 0 (0.0) | N/A | 0 (0.0) | N/A | 0 (0.0) | N/A |
| Low (200–500) | 0 (0.0) | 201 (19.3) | 0 (0.0) | N/A | 0 (0.0) | N/A | 0 (0.0) | N/A |
| Normal (+500) | 0 (0.0) | 132 (12.7) | 0 (0.0) | N/A | 0 (0.0) | N/A | 0 (0.0) | N/A |
| Unknown | 10 430 (100.0) | 524 (50.2) | 3080 (100.0) | N/A | 3280 (100.0) | N/A | 4070 (100.0) | N/A |
| Males | 7470 (71.6) | 747 (71.6) | 2350 (76.3) | 235 (76.3) | 2220 (67.7) | 222 (67.7) | 2900 (71.3) | 290 (71.3) |
| Born in western Europe | 9748 (93.5) | 750 (71.9) | 2971 (96.5) | 261 (84.7) | 3083 (94.0) | 216 (65.9) | 3694 (90.8) | 273 (67.1) |
| Age (years) [median (IQR)] | 36.5 (29.5–45.5) | 36.6 (29.3–45.5) | 33.0 (27.3–41.7) | 33.0 (27.3–41.5) | 37.4 (30.1–44.7) | 37.2 (30.2–44.8) | 39.3 (31.2–47.7) | 39.5 (31.2–47.7) |
| Income (DKK 100 000) [median (IQR)] | 3.0 (2.0–4.0) | 2.2 (1.3–3.3) | 2.9 (1.9–3.8) | 2.2 (1.3–3.2) | 3.0 (2.0–3.9) | 2.1 (1.2–3.2) | 3.2 (2.1–4.3) | 2.4 (1.3–3.6) |
| Highest completed education | ||||||||
| Primary school | 2479 (23.8) | 319 (30.6) | 831 (27.0) | 93 (30.2) | 812 (24.8) | 104 (31.7) | 836 (20.5) | 122 (30.0) |
| Secondary school | 4956 (47.5) | 406 (38.9) | 1544 (50.1) | 130 (42.2) | 1558 (47.5) | 135 (41.2) | 1854 (45.6) | 141 (34.6) |
| Higher education | 2766 (26.5) | 218 (20.9) | 637 (20.7) | 51 (16.6) | 847 (25.8) | 72 (22.0) | 1282 (31.5) | 95 (23.3) |
| Missing | 229 (2.2) | 100 (9.6) | 68 (2.2) | 34 (11.0) | 63 (1.9) | 17 (5.2) | 98 (2.4) | 49 (12.0) |
| Charlson Comorbidity Index score | ||||||||
| 0 | 9474 (90.8) | 897 (86.0) | 2956 (96.0) | 273 (88.6) | 3022 (92.1) | 289 (88.1) | 3496 (85.9) | 335 (82.3) |
| 1 | 589 (5.6) | 74 (7.1) | 77 (2.5) | 17 (5.5) | 166 (5.1) | 23 (7.0) | 346 (8.5) | 34 (8.4) |
| +2 | 367 (3.5) | 72 (6.9) | 47 (1.5) | 18 (5.8) | 92 (2.8) | 16 (4.9) | 228 (5.6) | 38 (9.3) |
| Alcohol abuse | 269 (2.6) | 56 (5.4) | 46 (1.5) | 13 (4.2) | 83 (2.5) | 19 (5.8) | 140 (3.4) | 24 (5.9) |
| Chronic obstructive pulmonary disease | 262 (2.5) | 33 (3.2) | 26 (0.8) | 6 (1.9) | 72 (2.2) | 13 (4.0) | 164 (4.0) | 14 (3.4) |
| Diabetes | 212 (2.0) | 20 (1.9) | 22 (0.7) | N/A | 45 (1.4) | N/A | 145 (3.6) | N/A |
| Ischaemic heart disease | 153 (1.5) | 20 (1.9) | 11 (0.4) | N/A | 34 (1.0) | N/A | 108 (2.7) | N/A |
| Liver disease | 64 (0.6) | 35 (3.4) | 11 (0.4) | 13 (4.2) | 15 (0.5) | 9 (2.7) | 38 (0.9) | 13 (3.2) |
| Mental disorders | 577 (5.5) | 96 (9.2) | 111 (3.6) | 26 (8.4) | 171 (5.2) | 29 (8.8) | 295 (7.2) | 41 (10.1) |
| Renal disease | 48 (0.5) | 13 (1.2) | 8 (0.3) | N/A | 18 (0.5) | N/A | 22 (0.5) | N/A |
| Osteoporosis/fracture | 895 (8.6) | 74 (7.1) | 100 (3.2) | 12 (3.9) | 254 (7.7) | 20 (6.1) | 541 (13.3) | 42 (10.3) |
| Angiotensin‐converting enzyme inhibitors | 222 (2.1) | 26 (2.5) | N/A | N/A | N/A | N/A | N/A | N/A |
| Antihypertensive treatment | 279 (2.7) | 25 (2.4) | 0 (0.0) | N/A | 30 (0.9) | N/A | 249 (6.1) | N/A |
| Angiotensin II antagonists | 607 (5.8) | 60 (5.8) | 6 (0.2) | 0 (0.0) | 189 (5.8) | 22 (6.7) | 412 (10.1) | 38 (9.3) |
| Oral steroids | 231 (2.2) | 15 (1.4) | N/A | 0 (0.0) | N/A | 0 (0.0) | N/A | 15 (3.7) |
| Statins | 141 (1.4) | 11 (1.1) | 0 (0.0) | N/A | 30 (0.9) | N/A | 111 (2.7) | N/A |
| Thrombocyte‐aggregation prophylaxis | 202 (1.9) | 33 (3.2) | N/A | N/A | N/A | N/A | N/A | N/A |
IQR, interquartile range.
Non‐communicable diseasesn
At the time of diagnosis, the PLHIV cohort had a generally higher burden of comorbidity than the non‐HIV cohort, with 14% having a CCI score ≥ 1 vs. 9.1% of comparisons (Tables 1 and 2). The burden of comorbidity increased with age at diagnosis, but in all age groups PLHIV had a higher burden of comorbidity, with 6.4% vs. 5.0% having CCI ≥ 1 in the age group < 31 years, 9.7% vs. 6% in the age group 31–40 years, 14.1% vs. 8.9% in the age group 41–50 years, and 36% vs. 23.7% in the age group > 51 years (Table 1).
Compared with the non‐HIV cohort, PLHIV had an increased prevalence of most of the included NCDs at HIV diagnosis, such as alcohol abuse (5.4% vs. 2.6%), COPD (3.2% vs. 2.5%), IHD (1.9% vs. 1.5%), liver disease (3.4% vs. 0.6%), mental disorders (9.5% vs. 5.5%) and renal disease (1.2% vs. 0.5%), whereas there was no increase in the baseline prevalence of diabetes (1.9% vs. 2.0%) and osteoporosis (7.1% vs 8.6%) (Tables 1 and 2).
During follow‐up the percentage of persons with one or more NCD increased considerably more in PLHIV than in the non‐HIV cohort (Fig. 1a,b). After 10 years of follow‐up, 42.2% of PLHIV had one or more registered NCDs compared with 23.9% in the non‐HIV cohort, and in the age group > 51 years, 54.2% of PLHIV vs. 36.5% of non‐HIV had at least one NCD. (Fig. 1a).
Fig. 1.
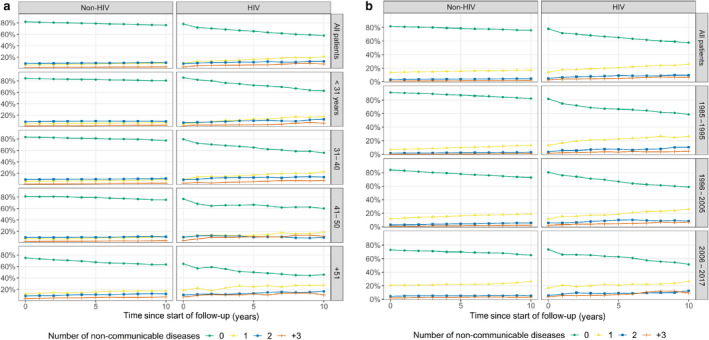
(a) Distribution of number of non‐communicable diseases within 10 years after the date of HIV diagnosis, stratified by age groups. (b) Distribution of number of non‐communicable diseases within 10 years after the date of HIV diagnosis, stratified by index period into pre‐HAART (highly active antiretroviral therapy) (1985–1995), early‐HAART (1996–2005) and late‐HAART (2006–2017) eras.
During follow‐up, alcohol abuse continued to be significantly more common among PLHIV, with a 10‐year cumulative incidence of 8.9% compared with 4.0% in the non‐HIV cohort, and the difference was most pronounced in the oldest age group (12.6% vs. 6.2%) (Fig. 2a).
Fig. 2.
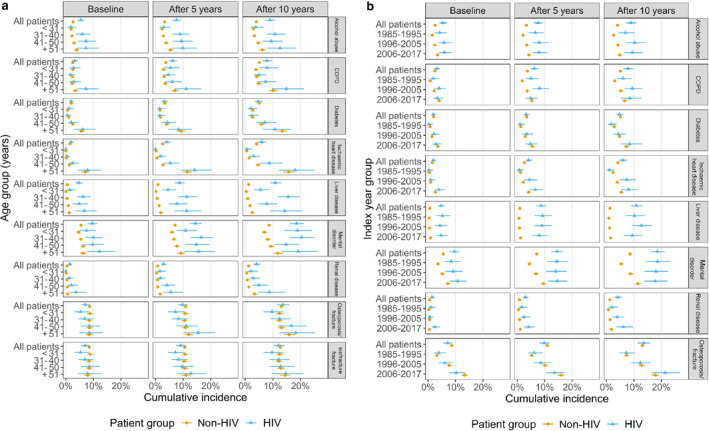
(a) Baseline prevalence and 5‐ and 10‐year cumulative incidence of non‐communicable diseases stratified by age groups. (b) Baseline prevalence and 5‐ and 10‐year cumulative incidence of non‐communicable diseases stratified by index period into pre‐HAART (highly active antiretroviral therapy) (1985–1995), early‐HAART (1996–2005), and late HAART (2006–2017) eras. COPD, chronic obstructive pulmonary disease.
The prevalence of mental disorders during follow‐up increased in PLHIV from 9.6% to 18.6%, which was much higher than in the non‐HIV cohort (increase from 5.5% to 8.6%) (Fig. 2a,b).
People living with HIV also had a slightly higher cumulative incidence of COPD, increasing from 3.2% at baseline to 7.8% after 10 years’ follow‐up compared with 2.5% and 5.1%, respectively, in the non‐HIV cohort. In the age group > 51 years, the cumulative incidences after 10 years were 14.9% and 10.1% in the PLHIV and the non‐HIV cohorts, respectively (Fig. 2a,b). In the late‐HAART era, no increased prevalence of COPD was observed (Fig. 2b).
Whereas the cumulative incidence of liver disease during follow‐up only increased from 0.6% to 1.2% in the non‐HIV cohort, it increased from 4.7% to 10.9% among PLHIV (Fig. 2a,b). This shows that PLHIV had a much higher prevalence and incidence of liver disease than HIV‐uninfected individuals, independent of index year but increasing with age (Fig. 2a,b).
Renal disease was also more prevalent among PLHIV, with a 10‐year cumulative incidence of 4.1% compared with 1.2% in the non‐HIV cohort, and 8.7% and 3.4% in the > 51years age group, respectively. The 10‐year cumulative incidence was higher in the late‐HAART (6.1%) compared with the early‐ (3.9%) and pre‐HAART eras (2.0%) (Fig. 2a,b).
There were no major differences in the cumulative incidences of diabetes and IHD between PLHIV and the non‐HIV cohort. In the > 51‐year age group, the 10‐year cumulative incidence for diabetes was 10.8% vs. 13.4% and for IHD it was 18.1% vs. 15.7% in the HIV and non‐HIV cohorts, respectively. However, the prevalence rates of diabetes and IHD were higher in both groups during the late‐HAART era than during the pre‐HAART era (Fig. 2a,b).
Overall, the cumulative incidence of osteoporosis did not differ between the HIV and the non‐HIV groups. The prevalence of osteoporosis increased with age, and in the age groups 41–50 and > 51 years, PLHIV had higher cumulative incidences of osteoporosis, being 18.3% and 16.7%, respectively, after 10 years of follow‐up compared with 15.9% and 13.1% in the non‐HIV group (Fig. 2a,b). The 10‐year cumulative incidence of osteoporosis was higher in the late‐HAART (21.4%) than in the early‐ (12.3%) and pre‐HAART eras (7.2%) (Fig. 2a,b). Osteoporotic fractures accounted for 99% of all the osteoporosis diagnoses and suggested no difference between calendar periods.
Mortality
Overall, 10‐year mortality was 23.0% for PLHIV vs. 3.5% in the non‐HIV cohort, but it improved considerably over time (Fig. 3a). The 10‐year mortality rates of those in the two cohorts who were alive 2 years after the date of HIV diagnosis were 15.2% for PLHIV vs. 3.9% in the non‐HIV cohort, whereas the mortality of PLHIV who were alive 2 years after the HIV diagnosis date in the late‐HAART era resembled that of the uninfected population in the same era (Fig. 3b). In the pre‐, early‐ and late‐HAART eras, mortality rates in the first year after HIV diagnosis were 20.3%, 5.5% and 1.8%, respectively, and 10‐year mortality rates were 45.5%, 15.7% and 9.4%. In the non‐HIV cohort, the 10‐year mortality rates were 2.8%, 3.6% and 4.0% in the three respective HAART eras.
Fig. 3.
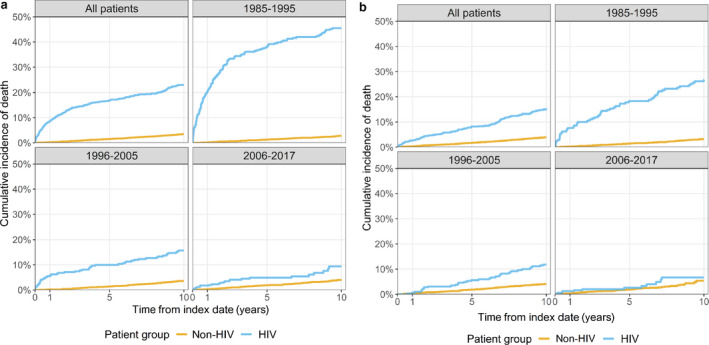
(a) Cumulative all‐cause mortality, stratified by index year period, pre‐HAART (highly active antiretroviral therapy) (1985–1995), early‐HAART (1996–2005) and late‐HAART (2006–2017) eras. (b) Cumulative all‐cause mortality from 2 years after the date of HIV diagnosis/index date, stratified by index year period, pre‐HAART (1985–1995), early‐HAART (1996–2005) and late‐HAART (2006–2017) eras.
Assessing the relationship between the prevalence of comorbidities and mortality, for PLHIV with a CCI score ≥ 2, the 5‐ and 10‐year mortality rates were 30.8% and 40.7%, respectively, compared with 15.9% and 21.3% for those without comorbidity.
Discussion
This population‐based study with long‐term follow‐up confirms that PLHIV have a higher prevalence of NCD at the time of their HIV diagnosis than age‐ and sex‐matched members of the background population, but also a disproportionate risk of NCD during follow‐up, not least in the late‐HAART era when PLHIV mortality had substantially decreased. Thus, despite a dramatic reduction in mortality over calendar time, PLHIV continue to have a higher mortality compared with the background population. However, the mortality of PLHIV who survived the first 2 years after the date of HIV diagnosis in the late‐HAART era was close to that of the general population in the same era. Danish studies have shown that one‐third of PLHIV present with advanced HIV infection [22, 23]. One study found that 34.7% presented with advanced HIV and 51.2% of individuals diagnosed with HIV were late presenters. Among others, the risk of presenting with advanced HIV was associated with age > 50 years, and mortality rates were increased during the first 2 years following presentation with advanced HIV [23]. Thus, the increased mortality among PLHIV may be caused by AIDS‐related deaths among late presenters during the first year after diagnosis and a disproportionate burden of NCDs during follow‐up. Not surprisingly, comorbidities are associated with an increased mortality. Although many PLHIV were probably infected several years before the date of diagnosis, the higher prevalence of NCDs at the time of diagnosis may be explained, at least partly, by lower socioeconomic status and unhealthy lifestyle such as smoking and alcohol abuse among PLHIV.
Exposure to antiretroviral drugs has been associated with hyperglycaemia and ART‐exposed PLHIV have been found to have an increased risk of diabetes [24, 25]. However, we did not find an increased risk of diabetes among PLHIV during the first 10 years after HIV diagnosis, not even in the early‐HAART period where first‐generation protease inhibitors were in use. This is in line with findings from a previous Danish study that the risk of diabetes in PLHIV was only increased in the period 1996–1999 but not 1999–2010 [26]. In accordance with the global trend, the prevalence of diabetes increased from the pre‐ to the late‐HAART era among PLHIV and HIV‐uninfected individuals.
HIV infection has been associated with an almost two‐fold increase in the incidence of IHD, and CVD is one of the most frequent causes of death among HIV‐infected individuals [27, 28]. This may be linked to a high prevalence of risk factors for CVD, such as smoking, hypertension and dyslipidaemia in PLHIV [9, 28]. Smoking is associated with higher risk of myocardial infarction (MI) in PLHIV than in the background population and up to 70% of MI in PLHIV may be attributable to smoking [29]. Initiation of ART has also been associated with an increased incidence of MI [30]. In particular, abacavir‐based regiments are linked to a nearly two‐fold increase in the risk of MI [31]. In addition, immune activation may increase the risk of MI [27]. Still, we only found a slightly higher prevalence of IHD at baseline and during follow‐up. In agreement with this, a recent Australian study including HIV‐infected and non‐HIV‐infected men attending general practice found no difference in the prevalence of CVD (9.4% vs. 9.6%) [8]. In a German HIV cohort, the prevalence of CVD was 12.8% vs. 10.4% in a non‐HIV cohort matched on age, gender and socioeconomic variables, similar to our findings [32].
Respiratory symptoms are common among PLHIV, and COPD may present earlier and be more severe than in the general population [33]. The global prevalence of COPD among PLHIV is 5.6–10.6%, the highest in Europe and among smokers, but it varies considerably among different HIV cohorts [34]. Consistently, we found a higher cumulative incidence of COPD among PLHIV compared with the non‐HIV group, most probably explained by higher prevalence of smoking as studies have shown that the prevalence of smoking among PLHIV is two to three times that of the general population [12]. However, previous findings also suggested that PLHIV have a higher prevalence of COPD even after adjusting for smoking [35]. The pathogenesis of HIV‐related lung disease, independent of smoking, is not fully understood, but altered lung microbiome and chronic inflammation caused by residual HIV have been proposed [35]. Still, tobacco use remains an important modifiable risk factor for COPD.
Chronic kidney disease (CKD) is a common complication of HIV infection, but the spectrum has changed since the beginning of the epidemic. HIV‐associated nephropathy was frequent before the availability of ART [36, 37]. Nowadays, CKD is primarily associated with ART and traditional risk factors such as ageing, hypertension, diabetes, dyslipidaemia and smoking [36, 37]. In accordance with our study, the prevalence of CKD among PLHIV has been found to be 2–10% but varies across populations [36, 37, 38]. Further, HIV‐infected individuals have a two to 20 times higher risk of developing end‐stage renal disease compared with the background population [39]. Our study confirms a two‐ to four‐fold increased incidence of renal disease in PLHIV compared with the non‐HIV group during follow‐up. Rasmussen et al. [40] showed that the age‐standardized risk of CKD increased with calendar years. In accordance with our findings, the cumulative incidence of CKD was higher in the late‐HAART era. This indicates that CKD may be attributable primarily to an increased use of potential nephrotoxic antiretrovirals. Several antiretrovirals such as indinavir, atazanavir and tenofovir disoproxil fumarate (TDF) are associated with impairment of renal function [36, 37, 41].
In the post‐HAART era, liver disease has become a leading cause of morbidity and mortality in PLHIV [5, 6, 29]. Elevated liver transaminases have been reported in 20–93% of PLHIV on ART [40]. PLHIV have higher prevalence of several risk factors for liver damage, such as alcohol abuse, coinfection with hepatitis B and C viruses due to shared risk factors, hepatotoxicity associated with ART, HIV itself, and metabolic dysfunction leading to non‐alcoholic fatty liver disease (NAFLD) [42, 43, 44]. Based on alcohol‐related hospital diagnoses, our study confirms that alcohol abuse is twice as common among PLHIV than among the general population and increasing during follow‐up. In line with our data, studies have found that 8–11% of PLHIV are heavy drinkers [45, 46, 47]. In accordance with previous studies, liver disease was approximately eight times more prevalent in the PLHIV group than in the non‐HIV group. In the DHCS, 10% were infected by intravenous drug use (IDU) and 13% were HCV‐positive [46]. In a previous survey among 574 PLHIV living in the Central Denmark Region, only 3% had chronic hepatitis B and 4% had chronic hepatitis C [48]. Thus, the increased cumulative incidence of liver disease among PLHIV cannot be solely explained by chronic viral hepatitis. Hepatotoxicity is a common side‐effect associated with ART, especially with some of the older drugs, and may be an important contributor to liver disease [42, 43]. However, metabolic liver diseases have become increasingly common among PLHIV and recent studies have identified NAFLD as the most common cause of liver disease in individuals ageing with HIV mono‐infection [42, 47].
People living with HIV have been found to have an increased risk of osteoporosis and fractures compared with HIV‐uninfected individuals of the same age and sex [49, 50]. This may be a result of traditional risk factors or factors intrinsic to HIV. Initiation of ART is associated with bone loss, especially regimens that include TDF [49]. A recent systematic review and meta‐analysis found an approximately 50% increased risk of any fracture [50]. In this study, only PLHIV in the age groups 41–50 and > 51 years had a higher incidence of osteoporosis compared with the background population. Similarly, in a study from the Multicenter AIDS Cohort Study only HIV‐positive men aged 50–59 years had a higher incidence of all fractures [51]. The prevalence of osteoporosis increased with age and over calendar time and was considerably higher in the late‐HAART era than in the pre‐HAART era. This cannot be solely explained by ART toxicity as a similar increase was seen in the non‐HIV group. Current guidelines for PLHIV recommend using a bone density scan (DXA) for screening for osteoporosis in postmenopausal women and men aged > 50 years [49]. This was not implemented in the study period, and therefore osteoporosis may be underdiagnosed in our cohort.
The prevalence of mental disorders in our PLHIV was approximately twice as high as in the non‐HIV group. This may partly be explained by IDU being associated with psychiatric disorders and having an increased risk of HIV infection. However, HIV‐infected persons with no history of IDU or HCV infection have been shown to have a higher utilization of psychotropic drugs [52]. Further, the prevalence of depression is two to seven times higher in the HIV population than in the background population [53]. Thus, it may work both ways. Mental disorders may increase the risk of acquiring HIV, and HIV infection may cause mental disorders. As mental disorders may be associated with poor adherence to ART, it is important that HIV care addresses this problem.
The strengths of our study are the use of a region‐wide, population‐based cohort with long and complete follow‐up and the access to high‐quality Danish population‐based databases, which allowed us to construct an age‐ and sex‐matched comparison cohort to represent occurrence of NCDs in the general population. The study has limitations. Our HIV cohort was not matched on socioeconomic status, ethnicity or marital status. We lacked information on lifestyle factors such as smoking and IDU, antiretroviral exposure and CD4 cell count, so we could not examine how the occurrence of NCDs varied by these factors. Therefore, we also kept our study descriptive and avoided any formal comparison with the general population cohort. Due to the retrospective design of the study, 10‐year follow‐up data were available for only 754 (16.8%) individuals in the late‐HAART era compared with 2996 (88.4%) and 3282 (91%) individuals in the pre‐ and early‐HAART eras, respectively. Another weakness is that we relied on hospital diagnoses when identifying NCDs and alcohol abuse and we missed diagnoses from general practitioners. As PLHIV have regular contact with the healthcare system, this may lead to a higher proportion of diagnoses actually recorded in a hospital setting as the matched population cohort only had information on alcohol abuse and diagnoses if they had been in contact with the healthcare system. Still, Denmark has a uniform and equal healthcare system with free access to hospital treatment for acute diseases. We therefore expect such potential surveillance bias to be minor for severe diseases like IHD. Further, we did not have information on NCDs diagnosed before immigration to Denmark. As a higher proportion of PLHIV were born outside Denmark, we may have less complete information on prevalent NCDs in the group and subsequently overestimate the cumulative incidence of NCDs occurring after HIV diagnosis. We have no information on causes of death, but several studies have shown that excess mortality among well‐treated HIV‐infected individuals is primarily caused by age‐related NCD [5, 6, 29].
In conclusion, PLHIV treated with modern and effective ART continue to have excess mortality. This may be attributable to a disproportionate burden of NCDs. We find that PLHIV have an increased risk of alcohol abuse, COPD, IHD, liver disease, mental disorders and renal disease, but not diabetes. An increased incidence of osteoporosis was only observed in PLHIV in the age groups 41–50 and > 51 years. Not surprisingly, the burden of NCDs increased with increasing age. Our data also indicate that the burden of diabetes, IHD, osteoporosis and renal disease has increased over calendar time, being at its highest in the late‐HAART era.
With an ageing HIV population, improvement of survival and quality of life among PLHIV needs screening for and prevention of age‐related NCDs, including lifestyle changes and use of ART with minimal toxicity.
Author contributions
CSL, MN, FA and JD contributed to the design and the protocol of the study. NAJ implemented the study, supervised by CSL. MN performed the analyses. NAJ, CSL and MN drafted the manuscript. All authors discussed the results and contributed to the final manuscript.
Acknowledgement
The authors would like to thank statistician Thomas Bøjer Rasmussen MSc, Department of Clinical Epidemiology, Aarhus University Hospital, for data analysis and Prof. Niels Obel, Department of Infectious Diseases, Rigshospitalet, Copenhagen University Hospital for providing data from the Danish HIV Cohort Study.
Conflict of interest: The current analysis was partly funded by a research grant from Gilead Sciences Denmark to Aarhus University. The sponsor contributed to the design and the protocol of the study, but the academic authors made the final determination on which analyses to present and how best to interpret them. NAJ and MN report no personal conflicts of interest. CSL has previously received a personal fee from Gilead Sciences before working on this paper. FA has been employed by Gilead Sciences while working on this paper. JD has received personal fees from Gilead Sciences and is currently affiliated with the Department of Clinical Epidemiology, Aarhus University Hospital.
Appendix 1. Codes used for the analyses
| Disease | Included ICD‐8 and ICD‐10 codes1 | Included ATC codes | Included surgery codes |
|---|---|---|---|
| HIV | 07983, Y4049, Y4149, DB20, DB21, DB22, DB23, DB24, DF024, DO987 | NA | NA |
| Alcohol abuse | 291, 303, 57109, 57110, 57710, 979, 980, DF10, DG312, DG21, DG721, DI426, DK292, , DK860, DK70, DR780, DF10, DG312, DG621, DG721, DI426, DK292, DK860, DK70, DR780, DT51, DZ714, DZ721 | NA | NA |
| Chronic obstructive pulmonary disease | 490, 491, 492, 493, 515, 516, 517, 518, DJ40, DJ41, DJ42, DJ43, DJ44, DJ45, DJ46, DJ47, DJ60, DJ61, DJ62, DJ63, DJ64, DJ65, DJ66, DJ67, DJ684, DJ701, DJ703, DJ841, DJ920, DJ961, DJ982, DJ983 | NA | NA |
| Diabetes | 24900, 24906, 24907, 24909, 25000, 25006, 25007, 25009, 24901, 24902, 24903, 24904, 24905, 24908, 25001, 25002, 25003, 25004, 25005, 25008, DE100, DE101, DE109, DE110, DE111, DE119, DE102, DE103, DE104, DE105, DE106, DE107, DE108, DE112, DE113, DE114, DE115, DE116, DE117, DE118 | A10A, A10B | NA |
| Ischaemic heart disease | 410, 411, 412, 413, 414, 415, DI20, DI21, DI22, DI23, DI24, DI25, DC88, DT822A, DT823 | NA | KFNA, KFNB, KFNC, KFND, KFNE, KFNF, KFNG, KFNH, KFNW, KFLF |
| Liver disease | 571, 57301, 57304, 07000, 07002, 07004, 07006, 07008, 57300, 4560, DB18, DK700, DK701, DK702, DK703, DK709, DK71, DK73, DK74, DK760, DB150, DB160, DB162, DB190, DK704, DK72, DK766, DI85 | NA | NA |
| Mental disorders | 29, 30, 30, 31, 32, 33, 34, DF | N05A, N05BA, N05CD, N05CF, N06A | NA |
| Osteoporosis | 723.09 805‐809, 810‐818, 820‐821, DM485, DM80‐M82, DS12 , DS22.0, DS22.1, DT08, DS32, DS42.2, DS42.3, DS42.4, DS42.7, DS42.8, DS52, DS62, DS72 | G03XC, H05A, H05B, M05BA, M05BB, M05BX | NA |
| Renal disease | 403, 404, 580, 581, 582, 583, 584, 59009, 59319, 7531, 792, DI12, DI13, DN00, DN01, DN02, DN03, DN04, DN05, DN07, DN11, DN14, DN17, DN18, DN19, DQ61 | NA | NA |
| 1International Classification of Diseases‐10 (ICD‐10) codes are given as SKS codes, i.e. they have a ‘D’ prefix | |||
| Medication | Included ATC codes |
|---|---|
| Thrombocyte‐aggregation prophylaxis | B01AC06, N02BA01, B01AC30, B01AC07, B01AC22, B01AC04, B01AC24 |
| Statins | C10AA, C10BA, C10BX |
| Antihypertensive treatment | C01, C02, C03A, C03B, C03D, C03E, C07, C08, C09A, C09B, C09C, C09D, C09X |
| Angiotensin‐converting enzyme inhibitors | C09A, C09B |
| Angiotensin II receptor blockers | C09C, C09D |
| Oral corticosteroids | H02AB |
| Charlson Comorbidity Index disease categories | Included ICD‐8 and ICD‐10 codes1 |
|---|---|
| Myocardial infarction | 410, DI21, DI22, DI23 |
| Congestive heart failure | 42709, 42710, 42711, 42719, 42899, 78249, DI50, DI110, DI130, DI132 |
| Peripheral vascular disease | 440, 441, 442, 443, 444, 445, DI70, DI71, DI72, DI73, DI74, DI77 |
| Cerebrovascular disease | 430, 431, 432, 433, 434, 435, 436, 437, 438, DI6, DG45, DG46 |
| Dementia | 29009, 2901, 29309, DF00, DF01, DF02, DF03, DF051, DG30 |
| Chronic pulmonary disease | 490, 491, 492, 493, 515, 516, 517, 518, DJ40, DJ41, DJ42, DJ43, DJ44, DJ45, DJ46, DJ47, DJ60, DJ61, DJ62, DJ63, DJ64, DJ65, DJ66, DJ67, DJ684, DJ701, DJ703, DJ841, DJ920, DJ961, DJ982, DJ983 |
| Connective tissue disease | 712, 716, 734, 446, 13599, DM05, DM06, DM08, DM09, DM30, DM31, DM32, DM33, DM34, DM35, DM36, DD86 |
| Ulcer disease | 53091, 53098, 531, 532, 533, 534, DK221, DK25, DK26, DK27, DK28 |
| Mild liver disease | 571, 57301, 57304, DB18, DK700, DK701, DK702, DK703, DK709, DK71, DK73, DK74, DK760 |
| Diabetes without end‐organ damage | 24900, 24906, 24907, 24909, 25000, 25006, 25007, 25009, DE100, DE101, DE109, DE110, DE111, DE119 |
| Hemiplegia | 344, DG81, DG82 |
| Moderate to severe renal disease | 403, 404, 580, 581, 582, 583, 584, 59009, 59319, 7531, 792, DI12, DI13, DN00, DN01, DN02, DN03, DN04, DN05, DN07, DN11, DN14, DN17, DN18, DN19, DQ61 |
| Diabetes with end‐organ damage | 24901, 24902, 24903, 24904, 24905, 24908, 25001, 25002, 25003, 25004, 25005, 25008, DE102, DE103, DE104, DE105, DE106, DE107, DE108, DE112, DE113, DE114, DE115, DE116, DE117, DE118 |
| Non‐metastatic solid tumour | 14, 15, 16, 17, 18, 190, 191, 192, 193, 194, DC0, DC1, DC2, DC3, DC4, DC5, DC6, DC70, DC71, DC72, DC73, DC74, DC75 |
| Leukaemia | 204, 205, 206, 207, DC91, DC92, DC93, DC94, DC95 |
| Lymphoma | 200, 201, 202, 203, 27559, DC81, DC82, DC83, DC84, DC85, DC88, DC90, DC96 |
| Moderate to severe liver disease | 07000, 07002, 07004, 07006, 07008, 57300, 4560, DB150, DB160, DB162, DB190, DK704, DK72, DK766, DI85 |
| Metastatic solid tumour | 195, 196, 197, 198, 199, DC76, DC77, DC78, DC79, DC80 |
| AIDS | 07983, DB21, DB22, DB23, DB24 |
| 1International Classification of Diseases‐10 (ICD‐10) codes are given as SKS codes, i.e. they have a ‘D’ prefix | |
The definition of western Europe included the following countries
Austria, Belgium, Denmark, Faroe Islands, Finland, France, Germany, Greenland, Iceland, Ireland, Italy, Liechtenstein, Luxembourg, Monaco, Netherlands, Norway, Portugal, Spain, Sweden, Switzerland, United Kingdom.
[The copyright line for this article was changed on 02 April after original online publication].
References
- 1. Lohse N, Obel N. Update of survival for persons with HIV infection in Denmark. Ann Intern Med 2016; 165: 749–750. [DOI] [PubMed] [Google Scholar]
- 2. Gueler A, Moser A, Calmy A et al. Life expectancy in HIV‐positive persons in Switzerland: matched comparison with general population. AIDS 2017; 31: 427–436. [DOI] [PMC free article] [PubMed] [Google Scholar]
- 3. Smit M, Brinkman K, Geerlings S et al. Future challenges for clinical care of an ageing population infected with HIV: a modelling study. Lancet Infect Dis 2015; 15: 810–818. [DOI] [PMC free article] [PubMed] [Google Scholar]
- 4. de Coninck Z, Hussain‐Alkhateeb L, Bratt G et al. Non‐AIDS mortality is higher among successfully treated people living with HIV compared with matched HIV‐negative control persons: a 15‐year follow‐up cohort study in Sweden. AIDS Patient Care STDS 2018; 32: 297–305. [DOI] [PMC free article] [PubMed] [Google Scholar]
- 5. Legarth RA, Ahlstrom MG, Kronborg G et al. Long‐term mortality in HIV‐infected individuals 50 years or older: a nationwide, population‐based cohort study. J Acquir Immune Defic Syndr 2016; 71: 213–218. [DOI] [PubMed] [Google Scholar]
- 6. Eyawo O, Franco‐Villalobos C, Hull MW et al. Changes in mortality rates and causes of death in a population‐based cohort of persons living with and without HIV from 1996 to 2012. BMC Infect Dis 2017; 17: 174. [DOI] [PMC free article] [PubMed] [Google Scholar]
- 7. Trickey A, May MT, Vehreschild J et al. Cause‐specific mortality in HIV‐positive patients who survived ten years after starting antiretroviral therapy. PLoS One 2016; 11: e0160460. [DOI] [PMC free article] [PubMed] [Google Scholar]
- 8. Heron JE, Norman SM, Yoo J et al. The prevalence and risk of non‐infectious comorbidities in HIV‐infected and non‐HIV infected men attending general practice in Australia. PLoS One 2019; 14: e0223224. [DOI] [PMC free article] [PubMed] [Google Scholar]
- 9. Gallant J, Hsue PY, Shreay S, Meyer N. Comorbidities among US patients with prevalent HIV infection‐a trend analysis. J Infect Dis 2017; 216: 1525–1533. [DOI] [PubMed] [Google Scholar]
- 10. Schouten J, Wit FW, Stolte IG et al. Cross‐sectional comparison of the prevalence of age‐associated comorbidities and their risk factors between HIV‐infected and uninfected individuals: the AGEhIV cohort study. Clin Infect Dis 2014; 59: 1787–1797. [DOI] [PubMed] [Google Scholar]
- 11. Escota GV, O'Halloran JA, Powderly WG, Presti RM. Understanding mechanisms to promote successful aging in persons living with HIV. Int J Infect Dis 2018; 66: 56–64. [DOI] [PubMed] [Google Scholar]
- 12. Tron L, Lert F, Spire B, Dray‐Spira R. group AN‐Vs. Tobacco smoking in HIV‐infected versus general population in france: heterogeneity across the various groups of people living with HIV. PLoS One 2014; 9: e107451. [DOI] [PMC free article] [PubMed] [Google Scholar]
- 13. Giles ML, Gartner C, Boyd MA. Smoking and HIV: what are the risks and what harm reduction strategies do we have at our disposal? AIDS Res Ther 2018; 15: 26. [DOI] [PMC free article] [PubMed] [Google Scholar]
- 14. Crum‐Cianflone N, Tejidor R, Medina S, Barahona I, Ganesan A. Obesity among patients with HIV: the latest epidemic. AIDS Patient Care STDS 2008; 22: 925–930. [DOI] [PMC free article] [PubMed] [Google Scholar]
- 15. Deeks SG. Immune dysfunction, inflammation, and accelerated aging in patients on antiretroviral therapy. Top HIV Med 2009; 17: 118–123. [PubMed] [Google Scholar]
- 16. Guaraldi G, Orlando G, Zona S et al. Premature age‐related comorbidities among HIV‐infected persons compared with the general population. Clin Infect Dis 2011; 53: 1120–1126. [DOI] [PubMed] [Google Scholar]
- 17. Schmidt M, Schmidt SAJ, Adelborg K et al. The Danish health care system and epidemiological research: from health care contacts to database records. Clin Epidemiol 2019; 11: 563–591. [DOI] [PMC free article] [PubMed] [Google Scholar]
- 18. Schmidt M, Pedersen L, Sorensen HT. The Danish Civil Registration System as a tool in epidemiology. Eur J Epidemiol 2014; 29: 541–549. [DOI] [PubMed] [Google Scholar]
- 19. Schmidt M, Schmidt SA, Sandegaard JL, Ehrenstein V, Pedersen L, Sorensen HT. The Danish National Patient Registry: a review of content, data quality, and research potential. Clin Epidemiol 2015; 7: 449–490. [DOI] [PMC free article] [PubMed] [Google Scholar]
- 20. Dalgaard LS, Sogaard OS, Jensen‐Fangel S, Larsen CS, Sonnerborg A, Ostergaard L. Use of InfCare HIV to identify and characterize suboptimally treated HIV patients at a Danish HIV clinic: a cross‐sectional cohort study. Scand J Infect Dis. 2012; 44: 108–114. [DOI] [PubMed] [Google Scholar]
- 21. Charlson ME, Pompei P, Ales KL, MacKenzie CR. A new method of classifying prognostic comorbidity in longitudinal studies: development and validation. J Chronic Dis 1987; 40: 373–383. [DOI] [PubMed] [Google Scholar]
- 22. Leutscher PD, Laursen T, Andersen B, Ostergaard L, Laursen A, Larsen CS. HIV late presenters in Denmark: need for increased diagnostic awareness among general practitioners. Dan Med Bull 2011; 58: A4253. [PubMed] [Google Scholar]
- 23. Helleberg M, Engsig FN, Kronborg G et al. Late presenters, repeated testing, and missed opportunities in a Danish nationwide HIV cohort. Scand J Infect Dis 2012; 44: 282–288. [DOI] [PubMed] [Google Scholar]
- 24. Noubissi EC, Katte JC, Sobngwi E. Diabetes and HIV. Curr Diab Rep 2018; 18: 125. [DOI] [PubMed] [Google Scholar]
- 25. Nansseu JR, Bigna JJ, Kaze AD, Noubiap JJ. Incidence and risk factors for prediabetes and diabetes mellitus among HIV‐infected adults on antiretroviral therapy: a systematic review and meta‐analysis. Epidemiology 2018; 29: 431–441. [DOI] [PubMed] [Google Scholar]
- 26. Rasmussen LD, Mathiesen ER, Kronborg G, Pedersen C, Gerstoft J, Obel N. Risk of diabetes mellitus in persons with and without HIV: a Danish nationwide population‐based cohort study. PLoS One 2012; 7: e44575. [DOI] [PMC free article] [PubMed] [Google Scholar]
- 27. Triant VA, Grinspoon SK. Epidemiology of ischemic heart disease in HIV. Curr Opin HIV AIDS 2017; 12: 540–547. [DOI] [PMC free article] [PubMed] [Google Scholar]
- 28. Croxford S, Kitching A, Desai S et al. Mortality and causes of death in people diagnosed with HIV in the era of highly active antiretroviral therapy compared with the general population: an analysis of a national observational cohort. Lancet Public Health 2017; 2: e35–e46. [DOI] [PubMed] [Google Scholar]
- 29. Rasmussen LD, Helleberg M, May MT et al. Myocardial infarction among Danish HIV‐infected individuals: population‐attributable fractions associated with smoking. Clin Infect Dis 2015; 60: 1415–1423. [DOI] [PubMed] [Google Scholar]
- 30. Obel N, Thomsen HF, Kronborg G et al. Ischemic heart disease in HIV‐infected and HIV‐uninfected individuals: a population‐based cohort study. Clin Infect Dis 2007; 44: 1625–1631. [DOI] [PubMed] [Google Scholar]
- 31. Eyawo O, Brockman G, Goldsmith CH et al. Risk of myocardial infarction among people living with HIV: an updated systematic review and meta‐analysis. BMJ Open. 2019; 9: e025874. [DOI] [PMC free article] [PubMed] [Google Scholar]
- 32. Christensen S, Wolf E, Altevers J, Diaz‐Cuervo H. Comorbidities and costs in HIV patients: a retrospective claims database analysis in Germany. PLoS One 2019; 14: e0224279. [DOI] [PMC free article] [PubMed] [Google Scholar]
- 33. Fitzpatrick ME, Kunisaki KM, Morris A. Pulmonary disease in HIV‐infected adults in the era of antiretroviral therapy. AIDS 2018; 32: 277–292. [DOI] [PMC free article] [PubMed] [Google Scholar]
- 34. Bigna JJ, Kenne AM, Asangbeh SL, Sibetcheu AT. Prevalence of chronic obstructive pulmonary disease in the global population with HIV: a systematic review and meta‐analysis. Lancet Glob Health. 2018; 6: e193–e202. [DOI] [PubMed] [Google Scholar]
- 35. Singhvi D, Bon J, Morris A. Obstructive lung disease in HIV‐phenotypes and pathogenesis. Curr HIV/AIDS Rep 2019; 16: 359–369. [DOI] [PubMed] [Google Scholar]
- 36. Cohen SD, Kopp JB, Kimmel PL. Kidney diseases associated with human immunodeficiency virus infection. N Engl J Med 2017; 377: 2363–2374. [DOI] [PubMed] [Google Scholar]
- 37. Alfano G, Cappelli G, Fontana F et al. Kidney disease in HIV infection. J Clin Med 2019; 8: 1254. [DOI] [PMC free article] [PubMed] [Google Scholar]
- 38. Ekrikpo UE, Kengne AP, Bello AK et al. Chronic kidney disease in the global adult HIV‐infected population: a systematic review and meta‐analysis. PLoS One 2018; 13: e0195443. [DOI] [PMC free article] [PubMed] [Google Scholar]
- 39. Rasch MG, Helleberg M, Feldt‐Rasmussen B et al. Increased risk of dialysis and end‐stage renal disease among HIV patients in Denmark compared with the background population. Nephrol Dial Transplant 2014; 29: 1232–1238. [DOI] [PubMed] [Google Scholar]
- 40. Rasmussen LD, May MT, Kronborg G et al. Time trends for risk of severe age‐related diseases in individuals with and without HIV infection in Denmark: a nationwide population‐based cohort study. Lancet HIV 2015; 2: e288–e298. [DOI] [PubMed] [Google Scholar]
- 41. Ryom L, Mocroft A, Kirk O et al. Association between antiretroviral exposure and renal impairment among HIV‐positive persons with normal baseline renal function: the D:A: D study. J Infect Dis 2013; 207: 1359–1369. [DOI] [PMC free article] [PubMed] [Google Scholar]
- 42. Oikonomou KG, Tsai E, Sarpel D, Dieterich DT. Liver Disease in Human Immunodeficiency Virus Infection. Clin Liver Dis 2019; 23: 309–329. [DOI] [PubMed] [Google Scholar]
- 43. Cai J, Osikowicz M, Sebastiani G. Clinical significance of elevated liver transaminases in HIV‐infected patients. AIDS. 2019; 33: 1267–1282. [DOI] [PubMed] [Google Scholar]
- 44. Chander G, Josephs J, Fleishman JA et al. Alcohol use among HIV‐infected persons in care: results of a multi‐site survey. HIV Med 2008; 9: 196–202. [DOI] [PMC free article] [PubMed] [Google Scholar]
- 45. Galvan FH, Bing EG, Fleishman JA et al. The prevalence of alcohol consumption and heavy drinking among people with HIV in the United States: results from the HIV Cost and Services Utilization Study. J Stud Alcohol 2002; 63: 179–186. [DOI] [PubMed] [Google Scholar]
- 46. Lohse N, Hansen AB, Jensen‐Fangel S et al. Demographics of HIV‐1 infection in Denmark: results from the Danish HIV Cohort Study. Scand J Infect Dis. 2005; 37: 338–343. [DOI] [PubMed] [Google Scholar]
- 47. Rockstroh JK. Non‐alcoholic fatty liver disease (NAFLD) and non‐alcoholic steatohepatitis (NASH) in HIV. Curr HIV/AIDS Rep 2017; 14: 47–53. [DOI] [PubMed] [Google Scholar]
- 48. Andersen KL, Larsen CS, Petersen MS, Leutscher PD. Need for improvements in the surveillance and management of chronic viral hepatitis in HIV patients followed in a Danish outpatient clinic. Scand J Infect Dis 2014; 46: 578–584. [DOI] [PubMed] [Google Scholar]
- 49. Premaor MO, Compston JE. People living with HIV and fracture risk. Osteoporos Int 2020; 31: 1633–1644. [DOI] [PubMed] [Google Scholar]
- 50. Starup‐Linde J, Rosendahl SB, Storgaard M, Langdahl B. Management of osteoporosis in patients living with HIV‐a systematic review and meta‐analysis. J Acquir Immune Defic Syndr 2020; 83: 1–8. [DOI] [PubMed] [Google Scholar]
- 51. Gonciulea A, Wang R, Althoff KN et al. An increased rate of fracture occurs a decade earlier in HIV+ compared with HIV‐ men. AIDS 2017; 31: 1435–1443. [DOI] [PMC free article] [PubMed] [Google Scholar]
- 52. Rasmussen LD, Obel D, Kronborg G et al. Utilization of psychotropic drugs prescribed to persons with and without HIV infection: a Danish nationwide population‐based cohort study. HIV Med 2014; 15: 458–469. [DOI] [PubMed] [Google Scholar]
- 53. Rodkjaer L, Laursen T, Balle N, Sodemann M. Depression in patients with HIV is under‐diagnosed: a cross‐sectional study in Denmark. HIV Med 2010; 11: 46–53. [DOI] [PubMed] [Google Scholar]