Abstract
The protozoan parasite Plasmodium falciparum causes the most severe and prevailing form of malaria in sub‐Saharan Africa. Previously, we identified the plasmodial lactate transporter, PfFNT, a member of the microbial formate–nitrite transporter family, as a novel antimalarial drug target. With the pentafluoro‐3‐hydroxy‐pent‐2‐en‐1‐ones, we discovered PfFNT inhibitors that potently kill P. falciparum parasites in vitro. Four additional human‐pathogenic Plasmodium species require attention, that is, P. vivax, most prevalent outside of Africa, and the regional P. malariae, P. ovale and P. knowlesi. Herein, we show that the plasmodial FNT variants are highly similar in terms of protein sequence and functionality. The FNTs from all human‐pathogenic plasmodia and the rodent malaria parasite were efficiently inhibited by pentafluoro‐3‐hydroxy‐pent‐2‐en‐1‐ones. We further established a phenotypic yeast‐based FNT inhibitor screen, and found very low compound cytotoxicity and monocarboxylate transporter 1 off‐target activity on human cells, particularly of the most potent FNT inhibitor BH267.meta, allowing these compounds to proceed towards animal model malaria studies.
Keywords: antimalarials, formate-nitrite transporter, lactate, malaria, phenotypic assay
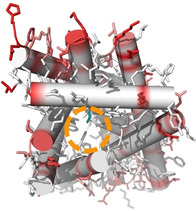
Expanding inhibition: The FNT lactate transporters of four human‐pathogenic Plasmodium species and the rodent malaria parasite have been evaluated as targets of pentafluoro‐3‐hydroxy‐pent‐2‐en‐1‐one PfFNT inhibitors. The proteins deviate only in the periphery, and are similarly susceptible to these potent small‐molecule inhibitors. The compounds exhibit high on‐target potency, minimal cytotoxicity and off‐target effects enabling translation to animal studies.
Introduction
Malaria is one of the major human threats causing morbidity and mortality on a global scale. The protozoan parasite species Plasmodium falciparum is responsible for the main malaria burden in sub‐Saharan Africa giving rise to the most lethal cerebral form of the disease.[ 1 , 2 ] Infections with P. vivax predominate outside of Africa[ 3 , 4 ] and can persist by the formation of hypnozoites that remain in the host's liver to relapse after months or even years of dormancy.[ 5 , 6 , 7 ] The remaining three human‐pathogenic Plasmodium species P. malariae, P. ovale, and P. knowlesi cause morbidity of geographically more localized significance.[ 8 , 9 ] Growing case numbers and increasing resistance of parasite strains keep an unrelieved pressure on research efforts to discover novel drugs and unexploited targets.[ 10 , 11 ] Recently, we identified the sole l‐lactate/H+ transporter from P. falciparum, PfFNT, and validated it as an antimalarial drug target.[ 12 , 13 ] The protein belongs to the strictly microbial protein family of formate‐nitrite transporters (FNT), yet displays adaptations in the amino acid layout of the Φ/K substrate selectivity filter to accommodate larger l‐lactate substrate molecules.[ 14 , 15 ] Besides Plasmodium spp., FNT‐type transporters are present in other protozoal parasites such as Toxoplasma gondii [16] and Entamoeba histolytica, [17] but not in multicellular organisms including humans. Lactate transport in humans is executed by monocarboxylate transporters of the SLC16 A family that are unrelated to the FNTs in terms of origin, protein sequence, and transport mechanism.[ 18 , 19 , 20 ] Rapid release of the glycolytic end products l‐lactate and protons is vital for malaria parasites. Inhibition of l‐lactate export leads to cytoplasmic acidification, breakdown of the energy metabolism, and eventually cell death.[ 21 , 22 ]
Screening of the Malaria Box collection of antimalarial compounds with unknown targets from the Medicines for Malaria Venture (MMV) [23] identified MMV007839 (Figure 1 A) to directly inhibit PfFNT l‐lactate transport and killing cultured P. falciparum parasites at nanomolar concentrations. [13] Treatment with sublethal doses of MMV007839 forced a resistance mutation in the PfFNT‐encoding gene resulting in an exchange of Gly107 to serine on the protein level, PfFNT G107 S. [13] The mutation decreases the affinity of MMV007839 to PfFNT G107 S likely due to a clash of the small molecule's phenyl‐hydroxyl moiety with the introduced serine sidechain in the target protein. A serine hydroxy group, however, bears the potential for exploitation by using the hydrogen‐bond as an interaction site with an inhibitor. Indeed, creating the new class of pyridine‐substituted pentafluoro‐3‐hydroxy‐pent‐2‐en‐1‐ones lacking a hydroxyl at the aromatic ring yet carrying a single nitrogen atom as a hydrogen bond acceptor site (BH297, BH267.meta; Figure 1 A), re‐established nanomolar PfFNT inhibition irrespective of the presence of the G107 S mutation. [24]
Figure 1.
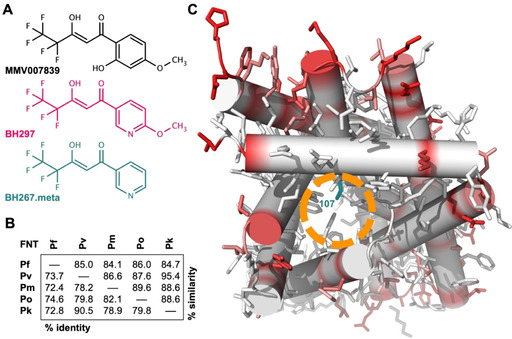
FNT inhibitors and structure comparison of FNTs from human‐pathogenic plasmodia. A) Structures of three inhibitors for plasmodial FNT‐type l‐lactate transporters: MMV007839, BH297, and BH267.meta. B) Protein sequence similarity and identity of the human‐pathogenic plasmodial FNTs (Pf: P. falciparum, Pv: P. vivax, Pm: P. malariae, Po: P. ovale, Pk: P. knowlesi). C) Model of a PfFNT protomer as viewed from the cytoplasmic side indicating positions and the degree of sequence deviations between the human‐pathogenic plasmodial FNTs (white‐red scale). The entry site into the l‐lactate transport path is marked (orange circle) as well as the PfFNT G107 S resistance mutation position (dark cyan).
Herein, we show functional expression in yeast of FNT proteins from all five human‐pathogenic Plasmodium species (PfFNT, PvFNT, PmFNT, PoFNT, PkFNT), and their potent inhibition by the screening hit MMV007839 as well as its pyridine analogues BH297 and BH267.meta. We further developed a yeast‐based phenotypic screening assay that allows for high‐throughput assessment of FNT inhibitor efficacy. Finally, we demonstrate the suitability of the compounds for use in animal models by nanomolar inhibition of PbFNT from P. berghei, the Plasmodium species that infects mice. BH267.meta exhibited particularly low mammalian cell toxicity which is a prerequisite for in vivo use.
Results
Plasmodial FNTs exhibit conserved transport paths and putative inhibitor binding sites
We started out by using a bioinformatics approach for protein sequence comparisons of PfFNT, PvFNT, PmFNT, PoFNT, PkFNT (full alignment shown in Figure S1 in the Supporting Information). The sequence length of the plasmodial FNT proteins varied by only by one amino acid comprising 308 or 309 positions. Total pair‐wise sequence identity ranged from 72.4 %, when comparing PfFNT with PmFNT, to 90.5 % for PvFNT and PkFNT (Figure 1B). Considering additional sequence positions that hold physicochemically related amino acid residues led to similarity scores between 84.1 % (PfFNT / PmFNT) and 95.4 % (PvFNT / PkFNT; Figure 1B). The amino acid positions that make up the most relevant sites in the sequence were even fully conserved, namely the Φ/K substrate selectivity filter and the two FNT‐typical constriction sites in the transport path (Figure S1).
Next, we generated 3D structure models of the plasmodial FNT proteins based on the crystal structure of a bacterial FNT homolog (PDB ID: 3TE0). [25] Figure 1 C depicts the PfFNT model as viewed from the intracellular space into the transport path of one protomer. This lower half of the transport path represents the putative FNT inhibitor binding site (orange circle) and contains the G107 S resistance mutation site (dark cyan). We projected the degree of sequence variation obtained from the sequence alignment (white–red scale) onto the model in order to localize the positions of deviating residues in a structural context. This revealed that amino acid differences among the Plasmodium spp. FNTs are restricted to the periphery (red shading), which anchors the protein in the lipid membrane, whereas the substrate transport path including the inhibitor binding site appears virtually invariant (in white).
Plasmodium spp. FNTs are functional when expressed in yeast
As previously for PfFNT, we chose a Saccharomyes cerevisiae yeast knockout strain lacking endogenous monocarboxylate transporters (jen1Δ/ady2Δ) as a heterologous expression system with minimal background.[ 12 , 13 , 24 ] We assessed transport functionality of PvFNT, PmFNT, PoFNT, and PkFNT by subjecting the cells to a 1 mM inward gradient of 14C‐labeled l‐lactate at an external pH of 6.8. In this setup, all constructs imported l‐lactate (Figure 2A), yet at different rates (Figure 2B). The transport rate depends on the number of FNT proteins present at the plasma membrane, and the observed rate differences are mirrored by the respective expression levels of the various Plasmodium spp. FNTs (see western blot in Figure S2). However, all plasmodial FNTs reached a similar equilibrium transport level of 0.13–0.16 nmol internal l lactate per mg of yeast cells (dry weight). The established l‐lactate equilibrium position is independent from the number of transporters in the plasma membrane and directly represents the ratio of the inward and outward transport kinetics of a specific transporter at the given substrate and proton gradients. [20] Therefore, even equilibrium positions indicate equal transport properties of the plasmodial FNT species variants. This is in line with the previous notion that the amino acid composition of the transport path is virtually identical among the proteins. In all cases, the observed transport activity facilitated inhibitor studies.
Figure 2.
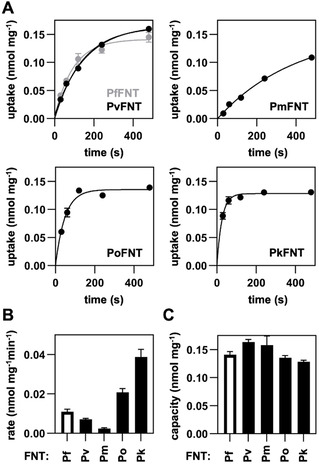
Functionality of yeast‐expressed human‐pathogenic plasmodial FNTs. A) Uptake of 14C‐labeled l‐lactate (1 mM inward gradient at pH 6.8) into FNT‐expressing yeast cells over time. B) Transport rates as determined from exponential fittings from the uptake curves (dependent on the FNT expression level). C) Transport capacity calculated from the plateaus of the transport curves (independent from the FNT expression level). Error bars denote S.E.M. (n=3).
Pentafluoro‐3‐hydroxy‐pent‐2‐en‐1‐ones block FNTs from all human‐pathogenic plasmodia
We assayed the potencies of MMV007839, BH297, and BH267.meta on PvFNT, PmFNT, PoFNT, and PkFNT for comparison to IC50 data that we previously obtained with PfFNT. [24] The original library screening hit MMV007839 (Figure 3, black curves; Table 1) inhibited PmFNT (IC50 of 0.15 μM) and PoFNT (0.16 μM) at about the same level as PfFNT (0.17 μM [24] ). PvFNT turned out to be even more susceptible at an IC50 of 0.09 μM, whereas PkFNT required a slightly higher compound concentration of 0.45 μM for half‐maximal inhibition. We found the pyridine structure analogue BH297 (Figure 3, magenta curves; Table 1) to be somewhat less efficient in inhibiting PvFNT (0.25 μM), PmFNT (0.38 μM), and PoFNT (0.64 μM) than PfFNT (0.11 μM [24] ); again, the highest IC50 value was obtained for PkFNT (0.99 μM). The second pyridine analogue BH267.meta (Figure 3, dark cyan curves; Table 1) was more potent and showed about equal efficacy on PvFNT (0.23 μM), PmFNT (0.21 μM), and PoFNT (0.21 μM); the previously obtained IC50 of BH267.meta with PfFNT was 0.11 μM (Table 1). [24] As with the MMV007839 and BH297 compounds, PkFNT was the least susceptible FNT variant (0.87 μM). Still, all IC50 values remained in the sub‐micromolar range indicating appreciable efficacy on the FNTs from all five human‐pathogenic Plasmodium species.
Figure 3.
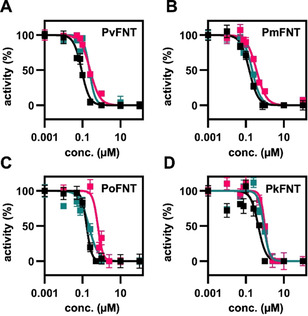
Inhibition of the yeast‐expressed plasmodial FNTs by MMV007839 (black), BH297 (magenta), and BH267.meta (dark cyan). Error bars denote S.E.M. (n=3).
Table 1.
IC50 values of MMV007839, BH297, and BH267.meta on plasmodial FNTs and human MCT1; data for PfFNT from ref. [24].
|
|
IC50 [μM] |
||||||
|---|---|---|---|---|---|---|---|
|
|
PfFNT |
PvFNT |
PmFNT |
PoFNT |
PkFNT |
PbFNT |
hMCT1 |
|
MMV007839 |
0.17±0.01 |
0.09±0.01 |
0.15±0.01 |
0.16±0.01 |
0.45±0.07 |
0.32±0.03 |
92.8±3 |
|
BH297 |
0.11±0.01 |
0.25±0.02 |
0.38±0.02 |
0.64±0.12 |
0.99±0.08 |
0.79±0.05 |
≈100 |
|
BH267.meta |
0.11±0.01 |
0.23±0.01 |
0.21±0.02 |
0.21±0.03 |
0.87±0.06 |
0.75±0.03 |
≈500 |
Readout of lactate‐dependent yeast viability enables phenotypic FNT inhibitor screening
We next asked whether monitoring of the viability of FNT‐expressing yeast can be used to identify FNT inhibitors at higher throughput than with the biophysical radioassay. We have shown before that the jen1Δ/ady2Δ knock‐out yeast strain fails to grow on medium containing l‐lactate as the sole carbon source, whereas expression of a functional FNT rescues the growth phenotype. [12] Here, we monitored yeast viability by adding resazurin to the growth medium as an indicator of the metabolic activity enabling rapid assessment in a plate reader. As a proof of concept, we titrated MMV007389, BH297, and BH267.meta to PfFNT‐expressing yeast cells in a 96‐well plate, and plotted EC50 curves from resazurin light absorption after 72 hours of culture (Figure 4 A–D).
Figure 4.
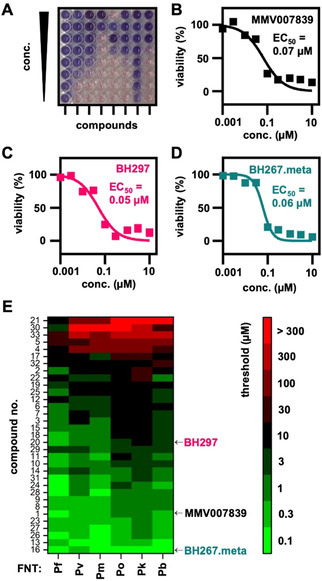
Phenotypic assessment of compound efficiency on plasmodial FNT inhibition in yeast. A) Representative 96‐well‐plate used for the phenotypic screening of FNT inhibitors and their efficiency on the FNTs from the five human‐pathogenic Plasmodium species (Pf: P. falciparum, Pv: P. vivax, Pm: P. malariae, Po: P. ovale, Pk: P. knowlesi). A blue color of the resazurin viability marker indicates decreased yeast viability due to FNT inhibition. Cell viability of PfFNT‐expressing yeast grown on l‐lactate medium in the presence of increasing concentrations of B) MMV007839, C) BH297, and D) BH267.meta was determined by using resazurin. E) Heatmap visualizing compound efficacy on FNT inhibition. The color code indicates the threshold concentration at which a 50 % decrease in yeast viability was reached.
We found EC50 values of 0.07 μM for MMV007839 (black curve), 0.05 μM for BH297 (magenta), and 0.06 μM for BH267.meta (dark cyan). Despite the longer time scale and the different nature of the assay, the data are in line with the IC50 values derived from the biophysical transport measurements (Table 1). The notion that the obtained EC50 values were even somewhat smaller than the corresponding IC50 values indicates that the tested compounds were sufficiently stable in the growth medium for the prolonged duration of the phenotypic assay.
We then used 33 compounds of different potency in PfFNT inhibition from earlier studies (structures shown in Figure S3)[ 13 , 24 ] as a test library to evaluate the suitability of the screening principle. We added the compounds in serial dilutions to FNT‐expressing yeast and determined the threshold concentration at which the cell viability was decreased by at least 50 %. In addition to the five human‐pathogenic malaria species, we included the FNT from P. berghei rodent malaria parasites, PbFNT, in this assay. The data obtained with this setup is depicted in a heat map (Figure 4E).
In confirmation, compounds 1, 16, and 20 corresponding to MMV007839, BH267.meta, and BH297, respectively, showed low threshold inhibition values. BH297, while highly potent against PfFNT, PvFNT, and PmFNT, was less effective against PoFNT, PbFNT and in particular to PkFNT. The heat map clearly visualizes the generally lower susceptibility of PkFNT to inhibition, again mirroring the biophysical data. BH267.meta was the most potent compound in this phenotypic assay. It efficiently inhibited all tested FNT species variants at nanomolar concentrations. The second‐best compound 13 differs from BH267.meta only by a second nitrogen atom in the aromatic ring, that is, a pyrazine (Figure S3).
BH267.meta is particularly suitable for use in a mouse malaria model
To work towards in vivo translation of the FNT inhibitors in animal malaria models, we evaluated the general toxicities of MMV007389, BH297, and BH267.meta in mammalian cell lines. Using human kidney (HEK293; Figure 5 A) and liver (HepG2; Figure 5B) cell lines, cell viability was assessed by means of ATP levels and reductive metabolism (resazurin assay). In addition, compound effects on cell proliferation were determined by automated image‐based analysis (nuclei count). MMV007839 and BH297 gave EC50 values of around 10 μM in all assays with both tested human cell lines, that is, about 100 times higher than the nanomolar potency on the PfFNT target. BH267.meta appeared particularly safe because even the highest tested concentration of 100 μM impaired viability and proliferation of HEK293 and HepG2 cells only mildly.
Figure 5.
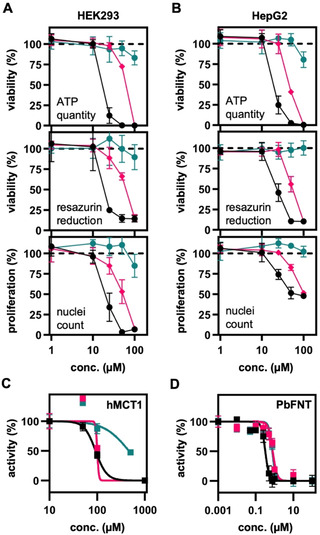
Compound cytotoxicity, off‐target effect, and potency on the rodent malaria parasite PbFNT of MMV007839 (black), BH297 (magenta), and BH267.meta (dark cyan). Cell viability (ATP quantity and resazurin reduction) and proliferation (automated image analysis, nuclei counts) of A) HEK293 and B) HepG2 cell after 24 h of compound treatment. C) Compound off‐target inhibition of the erythrocyte human monocarboxylate transporter 1 (hMCT1), and D) inhibition of PbFNT. Error bars denote S.E.M. (n=3).
We also addressed the risk of MMV007389, BH297, and BH267.meta for an off‐target effect on MCT1, that is, the human l‐lactate transporter in erythrocytes. Therefore, we expressed human MCT1 in jen1Δ/ady2Δ yeast [20] and determined IC50 values using the biophysical radiolabeled substrate transport assay. MCT1 inhibition by the compounds was generally low and handling of the required high inhibitor concentrations affected the accuracy of the assay. For MMV007839 and BH297, we obtained IC50 values around 100 μM, and≈500 μM for BH267.meta (Figure 5 C; Table 1), i. e. a potency that is at least two orders of magnitude lower compared to the inhibition of the PfFNT target.
Finally, we determined the inhibition efficiency of the rodent malaria parasite's PbFNT by MMV007839, BH297, and BH267.meta (Figure 5D; Table 1). At IC50 values of 0.32 μM, 0.79 μM, and 0.75 μM, respectively, all compounds potently inhibited PbFNT. With nanomolar efficacy on PbFNT, a low risk of MCT1 off‐target effects, and very low general cell toxicity, the compounds, particularly BH267.meta, prove to be suitable for in vivo studies using a P. berghei‐infected mouse malaria model.
Discussion
The finding that FNT sequence variations occur only at the periphery of the protein while the central transport path is conserved, indicates that the transport properties and inhibitor binding are directly tied to the FNT protein core. [14] We suggested before that the pentafluoro‐3‐hydroxy‐pent‐2‐en‐one scaffold mimics two consecutive l‐lactate FNT substrate molecules, one in its protonated neutral form (represented by the pentafluoroalkyl moiety) deeply penetrating the transport path, and one in its anionic form (represented by the vinylogous acid moiety) remaining closer to the transporter entry.[ 13 , 24 ] The inhibitors, thus, would represent two states of a passing substrate molecule providing mechanistic insight in support of our proposal that substrate protonation occurs already in the vestibule region and is a requirement for entering the hydrophobic FNT core. [26] The obtained small variations in the sub‐micromolar IC50 values, which we observed mainly with PkFNT, might be due to indirect longer distance effects of amino acid differences. Such substitutions may lead to slight alterations in the protein rigidity or the bend of the transport path that could affect access and interaction with the inhibitor.[ 24 , 27 , 28 ] However, structural modifications in the compound binding region are quite limited because the inhibitor and the l‐lactate substrate share the same path, and substrate transport must not suffer in order for the parasite to thrive. [13]
In this regard, we showed before that the G107 S resistance mutation in the PfFNT transport path decreases MMV007839 affinity by two orders of magnitude, and concomitantly decreased l‐lactate transport by 30 %. [13] Other mutations by small amino acids at this site led to dramatically lower l‐lactate substrate transport rates, that is, 80 % decrease with alanine, 90 % with cysteine, and full impairment of transport with valine. An escape from the inhibitory action of small molecule FNT blockers by further mutational adaptation in this region is therefore unlikely. Thus, with BH267.meta exhibiting similar potency on the wild‐type plasmodial FNT proteins as well as the G107 S resistance mutation, there is a great chance of keeping further FNT resistance developments at bay.
The phenotypic screening approach in yeast delivered FNT inhibition data at higher throughput. The good correlation of the cellular EC50 with the biophysical IC50 values indicates that the l‐lactate transport via FNT indeed confers the rate limiting step for yeast growth and viability rendering the system suitable for the task.[ 30 , 31 ] Accordingly, the assay confirmed the potency of BH267.meta against all tested FNTs. It further revealed the analogous pyrazine analogue 13 as a second promising candidate. Previous biophysical analyses yielded a four times lower efficiency of 13 on wildtype PfFNT (IC50 of 0.46 μM), and the compound was half as potent on the PfFNT G107 S resistance mutant (1.2 μM) compared to BH267.meta. [24] However, in the physiological setting of the phenotypic assay, BH268 scored almost as high as BH267.meta indicating chemical and metabolic stability in addition to its ability to effectively block FNT proteins. As a caveat, the phenotypic assay would pick up false positives if a compound is cytotoxic to the yeast, hence subsequent biophysical confirmation of the FNT inhibition is required as done in this work.[ 32 , 33 ]
Conclusion
This study shows that the FNT‐type l‐lactate transporters of different Plasmodium spp. including all human‐pathogenic species and the rodent‐infecting P. berghei behave similarly in terms of transport functionality and inhibition by small molecules. Such information is valuable for the further development of pentafluoro‐3‐hydroxy‐pent‐2‐en‐ones as novel antimalarial therapeutic modalities. BH267.meta performed particularly well during the assessment of cytotoxicity and off‐target effects on the lactate transporter of human erythrocytes, MCT1, thus suggesting safety margins of at least two orders of magnitude. These features, combined with the sub‐micromolar potency of BH267.meta on PbFNT from the rodent malaria parasite renders the compound a promising first candidate for mouse efficacy studies to demonstrate proof‐of‐concept in vivo.
Experimental Section
FNT structure models
Structure models of the plasmodial FNTs were generated using SWISS‐MODEL [34] based on a bacterial FNT homologous [25] (PDB ID: 3KCU). Alignments were displayed with TeXshade [35] and structural visualization was done with PyMOL Molecular Graphics System, Schrödinger, LLC.
Biophysical FNT transport and inhibition assays
Transport of l‐lactate was measured as previously described. [12] In short, the FNT of interest was expressed in Saccharomyces cerevisiae strain W303‐1 A jen1Δ ady2Δ cells (MATa, can1–100, ade2‐loc, his3–11,15, leu2–3, ‐112, trp1‐1‐1, ura3‐1, jen1::kanMX4, ady2::hphMX4) kindly provided by M. Casal. [36] Yeast cultures were grown at 29 °C in selective SD medium with adenine, histidine, leucine, tryptophan, 2 % (w/v) glucose, without uracil to an OD600 of 1±0.1. The cells were harvested by centrifugation and resuspended in 50 mM HEPES⋅Tris, pH 6.8±0.1 to an OD600 of 50. Uptake was initiated by the addition of 20 μL of l‐lactate solution to 80 μL of yeast suspension, resulting in a concentration of 1 mM spiked with 0.04 μCi [1‐14C]‐l‐lactate (Hartmann Analytic). Substrate transport was abruptly stopped at the indicated timepoints by the addition of 1 mL of ice‐cold water, followed by rapid transfer of the cells onto a vacuum filtration unit covered with a GF/C filter membrane (Whatman), and washing with 7 mL of ice‐cold water. The filter membranes were transferred into 3 mL of scintillation cocktail (Quicksafe A, Zinsser Analytic), and analyzed using a Packard TriCarb 2900 TR liquid scintillation counter (PerkinElmer Inc.).
For the inhibition of transport, 1 μL of inhibitor solution in DMSO was added to 80 μl of yeast suspension. The control cell suspension was equally stocked with 1.25 % of DMSO. The cells were kept at 18 °C for 10–15 min prior to the assay. The time points for the determination of the l‐lactate transport activity was were adapted for the individual FNT isoforms, that is, 30 s (PkFNT, PoFNT, PbFNT), 120 s (PvFNT) and 240 s (PmFNT, hMCT1).
Phenotypic screening assays
FNT species variants were expressed in the S. cerevisiae strain W303‐1 A jen1Δ ady2Δ cells. The cells were grown at 29 °C in 0.17 % (w/v) Difco yeast nitrogen base without amino acids, 0.5 % (w/v) ammonium sulfate, 50 mM MES, 1 % (w/v) sodium l‐lactate) supplemented with adenine, histidine, leucine and tryptophan. Fresh overnight cultures were diluted to an OD600 of 0.01 and resazurin (SigmaAldrich, #R7017) was added to a final concentration of 0.03 mg mL−1. 3 μL each of test compound solutions in DMSO were placed into 96‐well plates. Each plate further contained wells holding 1 % DMSO (v/v) without inhibitor as negative controls (no inhibition) and wells giving a final concentration of 1 mM MMV007839 as positive controls (full inhibition). The assay was started by adding 300 μL of FNT‐expressing yeast suspension with resazurin into each well. The plates were sealed with parafilm to prevent cross‐contamination. The screening plates were incubated for 72 h at 29 °C with shaking at 300 rpm. The absorption of resazurin was measured at 620 nm using a microplate reader (Infinite F200, Tecan Group). For each FNT species variant and each substance, a threshold concentration value was determined at which cell viability was decreased by ≥ 50 %.
Cytotoxicity assays
HEK293T and HepG2 cells were cultured in Dulbecco's modified Eagle medium (DMEM), supplemented with 10 % fetal bovine serum (FBS, Gibco, #10270106) and seeded in 96‐well plates (Sarstedt, TC‐treated, #83.3924) at a density of 20 000 cells per well. Cells were precultured overnight before treatment with the indicated compounds for 24 h. For resazurin assay, medium was removed, 120 μL resazurin (Sigma‐Aldrich, #R7017) solution (66 μM in PBS) added to each well, cells incubated for 1 h at 37 °C and the fluorescence intensities analyzed (λ ex/λ em=544/590 nm). For ATP quantification, the CellTiterGloTM assay was performed according to manufacturer's instructions. Both readouts were performed with a microplate reader (Spark, Tecan Group). For image‐based analysis of cell proliferation, cells were fixed with 4 % paraformaldehyde (in PBS) and incubated with Höchst33342 for 15 min at room temperature. Cells were then imaged on an ImageXpress MicroXL System (Molecular Devices) and cell numbers (DAPI+ nuclei) quantified with the MetaXpress Software, using the “Cell Proliferation High‐Throughput” algorithm (Molecular Devices). All values were normalized to vehicle control (DMSO).
Data evaluation and statistical analysis
All data points were acquired as technical triplicates each from three biological replicates. Background‐subtracted transport curves were fitted single exponentially to obtain the transport rate and the plateau (Graph Pad Prism Software). Error bars denote ± SEM. For IC50 curves, data points were measured in triplicate in the concentration ranges were full or no inhibition occurred, whereas 6–9 technical replicates were done around the IC50 value. All IC50 values were determined from at least three independent experiments. For normalization, the uninhibited transport rate was set to 100 %, and the fully inhibited level to 0 %. The resulting curves were fitted to a Hill equation yielding IC50 values and their respective standard deviation (Graph Pad Prism software). Error bars denote±SEM.
Conflict of interest
The authors declare no conflict of interest.
Supporting information
As a service to our authors and readers, this journal provides supporting information supplied by the authors. Such materials are peer reviewed and may be re‐organized for online delivery, but are not copy‐edited or typeset. Technical support issues arising from supporting information (other than missing files) should be addressed to the authors.
Supplementary
Acknowledgements
We thank M. Casal for providing the W303‐1 A jen1Δ ady2Δ yeast strain, A. Meier for initial work on the phenotypic assay, and A. Fuchs and B. Henke for excellent technical assistance. Open access funding enabled and organized by Projekt DEAL.
P. Walloch, C. Hansen, T. Priegann, D. Schade, E. Beitz, ChemMedChem 2021, 16, 1283.
References
- 1. World Malaria Report 2020: 20 Years of Global Progress and Challenges, World Health Organization, Geneva, 2020.
- 2. Postels D. G., Birbeck G. L., Handb. Clin. Neurol. 2013, 114, 91–102. [DOI] [PubMed] [Google Scholar]
- 3. Cotter C., Sturrock H. J., Hsiang M. S., Liu J., Phillips A. A., Hwang J., Gueye C. S., Fullman N., Gosling R. D., Feachem R. G., Lancet 2013, 382, 900–911. [DOI] [PMC free article] [PubMed] [Google Scholar]
- 4. Anstey N. M., Douglas N. M., Poespoprodjo J. R., Price R. N., Adv. Parasitol. 2012, 80, 151–201. [DOI] [PubMed] [Google Scholar]
- 5. Krotoski W. A., Krotoski D. M., Garnham P. C., Bray R. S., Killick-Kendrick R., Draper C. C., Targett G. A., Guy M. W., Br. Med. J. 1980, 280, 153–154. [DOI] [PMC free article] [PubMed] [Google Scholar]
- 6. White N. J., Malar. J. 2011, 10, 297. [DOI] [PMC free article] [PubMed] [Google Scholar]
- 7. Gural N., Mancio-Silva L., Miller A. B., Galstian A., Butty V. L., Levine S. S., Patrapuvich R., Desai S. P., Mikolajczak S. A., Kappe S. H. I., Fleming H. E., March S., Sattabongkot J., Bhatia S. N., Cell Host Microbe 2018, 23, 395–406. [DOI] [PMC free article] [PubMed] [Google Scholar]
- 8. Hwang J., Cullen K. A., Kachur S. P., Arguin P. M., Baird J. K., Open Forum Infect. Dis. 2014, 1, ofu034. [DOI] [PMC free article] [PubMed] [Google Scholar]
- 9. Lover A. A., Dantzer E., Hocini S., Estera R., Rerolle F., Smith J. L., Hwang J., Gosling R., Yukich J., Greenhouse B., Jacobson J., Phetsouvanh R., Hongvanthong B., Bennett A., Gates Open Res. 2019, 3, 1730. [DOI] [PMC free article] [PubMed] [Google Scholar]
- 10. Wells T. N. C., van Huijsduijnen R. H., Van Voorhis W. C., Nat. Rev. Drug Discovery 2015, 14, 424–442. [DOI] [PubMed] [Google Scholar]
- 11. Blasco B., Leroy D., Fidock D. A., Nat. Med. 2017, 23, 917–928. [DOI] [PMC free article] [PubMed] [Google Scholar]
- 12. Wu B., Rambow J., Bock S., Holm-Bertelsen J., Wiechert M., Soares A. B., Spielmann T., Beitz E., Nat. Commun. 2015, 6, 6284. [DOI] [PubMed] [Google Scholar]
- 13. Golldack A., Henke B., Bergmann B., Wiechert M., Erler H., Blancke Soares A., Spielmann T., Beitz E., PLoS Pathog. 2017, 13, e1006172. [DOI] [PMC free article] [PubMed] [Google Scholar]
- 14. Wiechert M., Beitz E., EMBO J. 2017, 36, 949–958. [DOI] [PMC free article] [PubMed] [Google Scholar]
- 15. Wiechert M., Erler H., Golldack A., Beitz E., FEBS J. 2017, 284, 2663–2673. [DOI] [PubMed] [Google Scholar]
- 16. Erler H., Ren B., Gupta N., Beitz E., J. Biol. Chem. 2018, 293, 17622–17630. [DOI] [PMC free article] [PubMed] [Google Scholar]
- 17. Helmstetter F., Arnold P., Höger B., Petersen L. M., Beitz E., J. Biol. Chem. 2019, 294, 623–631. [DOI] [PMC free article] [PubMed] [Google Scholar]
- 18. Halestrap A. P., IUBMB Life 2012, 64, 1–9. [DOI] [PubMed] [Google Scholar]
- 19. Poole R. C., Halestrap A. P., Biochem. J. 1994, 303, 755–759. [DOI] [PMC free article] [PubMed] [Google Scholar]
- 20. Bader A., Beitz E., Membranes 2020, 10, 236. [DOI] [PMC free article] [PubMed] [Google Scholar]
- 21. Elliott J. L., Saliba K. J., Kirk K., Biochem. J. 2001, 355, 733–739. [DOI] [PMC free article] [PubMed] [Google Scholar]
- 22. Marchetti R. V., Lehane A. M., Shafik S. H., Winterberg M., Martin R. E., Kirk K., Nat. Commun. 2015, 6, 6721. [DOI] [PubMed] [Google Scholar]
- 23. Spangenberg T., Burrows J. N., Kowalczyk P., McDonald S., Wells T. N. C., Willis P., PLoS One 2013, 8, e62906. [DOI] [PMC free article] [PubMed] [Google Scholar]
- 24. Walloch P., Henke B., Häuer S., Bergmann B., Spielmann T., Beitz E., J. Med. Chem. 2020, 63, 9731–9741. [DOI] [PubMed] [Google Scholar]
- 25. Czyzewski B. K., Wang D. N., Nature 2012, 483, 494–497. [DOI] [PMC free article] [PubMed] [Google Scholar]
- 26. Wiechert M., Beitz E., Channels 2017, 11, 365–367. [DOI] [PMC free article] [PubMed] [Google Scholar]
- 27. Sui H., Han B.-G., Lee J. K., Walian P., Jap B. K., Nature 2001, 414, 872–878. [DOI] [PubMed] [Google Scholar]
- 28. Rothert M., Rönfeldt D., Beitz E., J. Biol. Chem. 2017, 292, 9358–9364. [DOI] [PMC free article] [PubMed] [Google Scholar]
- 29. Wendell D. L., Bisson L. F., J. Bacteriol. 1993, 175, 7689–7696. [DOI] [PMC free article] [PubMed] [Google Scholar]
- 30. Elbing K., Larsson C., Bill R. M., Albers E., Snoep J. L., Boles E., Hohmann S., Gustafsson L., Appl. Environ. Microbiol. 2004, 70, 5323–5330. [DOI] [PMC free article] [PubMed] [Google Scholar]
- 31. Heyland J., Fu J., Blank L. M., Microbiology 2009, 155, 3827–3837. [DOI] [PubMed] [Google Scholar]
- 32. Baell J., Walters M. A., Nature 2014, 513, 481–483. [DOI] [PubMed] [Google Scholar]
- 33. Dahlin J. L., Walters M. A., Future Med. Chem. 2014, 6, 1265–1290. [DOI] [PMC free article] [PubMed] [Google Scholar]
- 34. Biasini M., Bienert S., Waterhouse A., Arnold K., Studer G., Schmidt T., Kiefer F., Gallo Cassarino T., Bertoni M., Bordoli L., Schwede T., Nucleic Acids Res. 2014, 42, W252–258. [DOI] [PMC free article] [PubMed] [Google Scholar]
- 35. Beitz E., Bioinformatics 2000, 16, 135–139 [DOI] [PubMed] [Google Scholar]
- 36. Soares-Silva I., Paiva S., Diallinas G., Casal M., Mol. Membr. Biol. 2007, 24, 464–474. [DOI] [PubMed] [Google Scholar]
Associated Data
This section collects any data citations, data availability statements, or supplementary materials included in this article.
Supplementary Materials
As a service to our authors and readers, this journal provides supporting information supplied by the authors. Such materials are peer reviewed and may be re‐organized for online delivery, but are not copy‐edited or typeset. Technical support issues arising from supporting information (other than missing files) should be addressed to the authors.
Supplementary


