

Abstract
Urban‐driven evolution is widely evident, but whether these changes confer fitness benefits and thus represent adaptive urban evolution is less clear. We performed a multiyear field reciprocal transplant experiment of acorn‐dwelling ants across urban and rural environments. Fitness responses were consistent with local adaptation: we found a survival advantage of the “home” and “local” treatments compared to “away” and “foreign” treatments. Seasonal bias in survival was consistent with evolutionary patterns of gains and losses in thermal tolerance traits across the urbanization gradient. Rural ants in the urban environment were more vulnerable in the summer, putatively due to low heat tolerance, and urban ants in the rural environment were more vulnerable in winter, putatively due to an evolved loss of cold tolerance. The results for fitness via fecundity were also generally consistent with local adaptation, if somewhat more complex. Urban‐origin ants produced more alates in their home versus away environment, and rural‐origin ants had a local advantage in the rural environment. Overall, the magnitude of local adaptation was lower for urban ants in the novel urban environment compared with rural ants adapted to the ancestral rural environment, adding further evidence that species might not keep pace with anthropogenic change.
Keywords: Global change, heat island, natural selection, thermal physiology, urbanization
Cities provide an unplanned, experimental arena for better understanding the process of local adaptation (or their lack thereof) to novel and changing environments (Diamond and Martin 2020a). Although it is now clear that rapid evolutionary responses, taking place within the timescale of human lifespans, routinely occur in natural populations (Hendry and Kinnison 1999; Reznick et al. 2019), we have much to learn regarding how such contemporary adaptation unfolds. For example, does adaptation to novel environments commonly cause maladaptation in the ancestral environment (i.e., fitness trade‐offs or the cost of adaptation, sensu Futuyma and Moreno 1988; Hereford 2009)? Stronger fitness trade‐offs between environments might facilitate population divergence and speciation, but they could also impede adaptation to novel environments (Kawecki and Ebert 2004; Hendry 2009). And how (mal)adapted are populations in novel or changing environments in comparison to related populations inhabiting ancestral conditions? Such research questions are especially relevant in light of the current pace, magnitude, and ubiquity of anthropogenic change (Brady et al. 2019; Diamond and Martin 2020a).
By comparing the relative fitness of a population in its own environment versus an alternative environment (i.e., a home vs. away comparison), and by comparing a native population's fitness in their own environment to that of a foreign population's fitness in that same environment (i.e., a local vs. foreign comparison), reciprocal transplant experiments are a powerful approach for measuring local adaptation and fitness trade‐offs between environments (Kawecki and Ebert 2004; Blanquart et al. 2013). Although this fact is well‐recognized in the emerging field of urban evolutionary biology (Donihue and Lambert 2015; Rivkin et al. 2019), reciprocal transplants between urbanized and nonurbanized habitats are still rare. This is not surprising as many species are not easily amenable to performing transplant experiments in any environment, and measuring fitness is itself a difficult task (Hendry et al. 2018). Moreover, the urban‐focused reciprocal transplants carried out to date provide no evidence (e.g., Capilla‐Lasheras et al. 2017) or mixed evidence (e.g., Gorton et al. 2018) for urban adaptation. Much more commonly, urban adaptation studies have used analyses of selection at the genomic and phenotypic levels. Genomic studies have provided a wealth of evidence for selection at particular loci, encompassing a number of fitness‐relevant traits, in response to urbanization (reviewed in Perrier et al. 2020). Likewise, a number of studies have demonstrated phenotypic selection on a range of different traits in urban environments (Lambrecht et al. 2016; Irwin et al. 2018; Start et al. 2018) or have linked heritable phenotypic divergence to organismal performance (Tüzün et al. 2017a; Winchell et al. 2016, Winchell et al. 2018; Kern and Langerhans 2018, 2019). Some have coupled patterns of phenotypic selection with genetic differentiation between urban and rural populations (Diamond et al. 2018a; Lambrecht et al. 2016). These studies provide support for adaptation to cities; however, again, there have been few field‐based tests that directly measure fitness of urban and rural populations in their own and each other's environment (e.g., Capilla‐Lasheras et al. 2017; Gorton et al. 2018).
In this study, we aimed to better our understanding of urban local adaptation with a multi‐year reciprocal transplant experiment using an acorn‐dwelling species of ant, Temnothorax curvispinosus. Previous multi‐generation common garden experiments with acorn ants have demonstrated evolutionary divergence in thermal tolerance between urban and rural populations in response to urban heat island effects (Diamond et al. 2017, 2018a; Martin et al. 2019). These shifts were suggested to reflect local adaptation on the basis of selection (via fecundity) for greater heat tolerance and fitness trade‐offs between urban and rural populations across urban versus rural‐mimicking temperature treatments in the laboratory (Diamond et al. 2018a). However, laboratory manipulations cannot replicate the potential complexity of biotic and abiotic conditions of natural environments.
The reciprocal transplant experiment allowed us to robustly test for environmental fitness trade‐offs and evidence of local adaptation across seasons and multiple years. We transplanted urban and rural acorn ant colonies across multiple urban and rural sites in Cleveland, Ohio, USA, and monitored colonies for over 2 years to assess colony survival and fecundity. Note that for acorn ants, “rural” sites refer to typical forested sites for this species, whereas “urban” sites refer to forest islands embedded within the urban matrix (see Diamond et al. 2018b); hereafter, we refer to our sites as urban versus rural for simplicity and consistency with other research in this area. If local adaptation is present, we expected transplanted urban ants to have the highest fitness in the urban environment and rural ants to have highest fitness in the rural environment (i.e., local vs. foreign comparison). Further, if local adaptation leads to fitness trade‐offs across environments, we expected that populations will have lower fitness in the away environments than in their home environments. Because we were able to measure colony survival and fecundity over multiple time points, we also examined the evidence for environmental temperature as a selective agent across winter and summer seasons in urban and rural environments.
Materials and Methods
STUDY SYSTEM
We used the small, acorn‐dwelling ant, Temnothorax curvispinosus, to explore the potential for local adaptation to an urban heat island. The entire colony including the queen, workers, and brood (immature ants in the egg, larval, and pupal stages of development) resides within the acorn environment. There can be multiple queens, especially as colonies mature, often driven by daughters of the reproductive caste remaining in the nest rather than dispersing (Stuart 1987). The queen(s), brood, and young workers that are typically tasked with brood care remain entirely within the nest environment. Older workers are typically the only ants that regularly leave to gather food resources and return these items to the nest. Because of the unique nesting structure of acorn ants, they are highly amenable to being transplanted between different sites. Further, the colony remains aboveground in the acorn environment for the entire year, which not only facilitates collection of whole colonies, but also ensures that acorn ants experience near‐surface temperatures. Acorn ants do not have the capability to retreat underground like many ant species (Herbers 1989; Herbers and Johnson 2007; Mitrus 2013), and are thus unable to use this mechanism to avoid stressfully warm temperatures associated with the urban heat island effect or stressfully cool temperatures associated with winter conditions.
The lifespan properties of components of the acorn ant colony also make it highly conducive to long‐term reciprocal transplant studies, which are the most direct method to assess local adaptation. As a colony unit, acorn ants are remarkably long‐lived, owing to the fact that queens can live five or more years (Keller 1998; Negroni et al. 2019). By contrast, worker lifespan is considerably shorter, on the order of one or more months (Modlmeier et al. 2013; Penick et al. 2017). Queens must continually produce new eggs to replace old workers in nest‐tending and foraging tasks, as the queen does not forage herself. The production of new workers is also important for achieving a large enough colony size that investment shifts from generating nonreproductive workers (colony maintenance) to reproductive alates, or winged, sexual, male and female ants.
RECIPROCAL TRANSPLANT EXPERIMENT
The reciprocal transplant experiment was conducted in urban and rural tree‐covered sites of Cleveland, Ohio, USA (see Supporting Information for details of transplant pen construction and of urban and rural sites). We sourced acorn ants from four urban sites and two rural sites (Table S1; Fig. S1). We used percent developed impervious surface area (ISA) from the National Land Cover Database (Yang et al. 2018) as the criterion for designating urban and rural sites. Urban sites were defined as those with ISA values between 40% and 61% and rural sites were defined as those with ISA values of 0%. Mean ISA values for each site were calculated with a 120 m buffer using the focal statistics tool in the spatial analyst toolbox in ArcGIS 10.4. Urban and rural acorn ant microclimates differ by more than 4°C during the main activity season for acorn ants (Diamond et al. 2018a). Colonies were collected from field sites between 22 May and 19 July 2017 (Table S1). We focused colony collections relatively early in the year to avoid inadvertently splitting up polydomous single colonies. Acorn ant colonies typically overwinter in a single acorn and, for mature colonies, typically expand to multiple acorns during the later summer months (Alloway et al. 1982).
All colonies were held in a laboratory growth chamber (Panasonic MIR 154) at a constant 25°C (14:10 L:D) for 3–6 days, which is a commonly experienced, nonstressful temperature range for both urban and rural populations (Penick et al. 2017; Diamond et al. 2018a; Chick et al. 2021). During this period, colonies were provided with unlimited access to water, sugar solution (25% sucrose), and dead mealworms. We counted the number of queens, workers, and brood in each colony. At the end of the laboratory acclimation period, we assessed heat and cold tolerance traits of worker ants from a subset of the colonies that had sufficiently large colony sizes, that is, for which the thermal tolerance trials would not eliminate the current worker pool. The thermal tolerance data allowed us to reconfirm phenotypic divergence in heat and cold tolerances between urban and rural populations (Diamond et al. 2017, 2018a; Martin et al. 2019), and test for seasonal acclimation effects. Owing to logistical constraints, we were able to do this for 12 urban and nine rural colonies, representing 48% of the total number of initial colonies in the experiment. Colonies that underwent thermal tolerance testing had to contain at least 30 workers upon initial collection to allow 10 to be tested for thermal tolerance traits leaving at least 20 workers that were transplanted into the field with the queen and brood. Whether workers were removed for pretransplant thermal tolerance assessment did not have a significant effect on colony survival (χ 2 = 2.15, P = 0.142). We assessed five individual workers for heat tolerance and a different five individuals for cold tolerance per colony. Two workers from a single rural colony were injured during the assessment of heat tolerance, and so these data points were excluded from the experiment, leaving a total of 118 individual estimates of heat tolerance and 120 estimates of cold tolerance. Our measures of heat and cold tolerance were the critical thermal maximum (CTmax) and critical thermal minimum (CTmin). Worker ants were placed individually in 1.5‐mL Eppendorf tubes, which were inserted into aluminum blocks in a benchtop incubator (Boekel Tropicooler). Tolerance assays were performed using a dynamic temperature ramping protocol, raising or lowering the temperature by 1°C min−1 until the loss of muscular coordination (i.e., tubes were removed from the incubator and turned on their side to assess whether ants could maintain coordinated movement). This endpoint represents an ecological death, as the ants would not be able to retreat to a thermal refuge in the wild (Lighton and Turner 2004). Starting temperatures were 34 and 16°C for heat and cold tolerance, respectively. Note that the thermal tolerance assays were destructive, preventing the return of these worker subsets to the colony, but a subset of 10 workers represents only 13% of the mean colony size in our experiment and is thus highly unlikely to undermine colony performance. Because our colony collection dates spanned late May to early July, we examined the potential for seasonal acclimation effects on thermal tolerances of urban and rural acorn ants. We found no evidence for such effects (Table S2) and thus did not further consider the influence of the timing of collection on thermal tolerance.
Acorn ant colonies were transplanted into four urban and two rural sites between 25 May and 31 July 2017 (Table S1; Fig. S1). Although the two rural transplant sites were the same as the rural colony collection sites, two of the four urban transplant sites differed from the colony collection sites. This difference simply reflected the confluence of variation in colony density at different urban sites and our ability to obtain permissions for performing reciprocal transplants in urbanized habitats. Colonies were transplanted to home treatments (urban source to urban habitat and rural source to rural habitat) or away treatments (urban source to rural habitat and rural source to urban habitat). For the treatment groups rural‐origin ants into rural environments and urban‐origin ants into rural environments, each group had 10 colonies initially. For the treatment groups rural‐origin ants into urban environments and urban‐origin ants into urban environments, each group had 12 colonies initially. For the home treatment transplants, colonies were always transplanted into a new site of the same habitat designation rather than the same site of origin. Collection and transplant sites were each known to already harbor acorn ant colonies to ensure appropriate microhabitat conditions within the experiment. A given colony was transplanted intact as a single colony unit including the original queen, workers, and brood that were in the colony upon the initial collection from the field site, that is, we did not split colony members across treatments or sites. Only one colony was placed within each individual transplant pen to allow tracking of colony survival and size on a per‐colony basis. Initial colony size with respect to the total number of queens, workers, and brood was comparable across the urban and rural source habitats prior to transplantation (Table S3).
The experiment began on 25 May 2017 with the first transplantations of colonies to their field treatments and ended on 12 August 2019 with the recovery of the surviving colonies from the transplant pens. Over this period, colonies were censused 11 times (Fig. 1). At these census points, each pen was assayed for whether the colony had survived. Surviving colonies were briefly brought from the field into the laboratory to be assessed for colony size including the number of queens, workers, and brood. Reproductive effort (fecundity) was also assessed by counting the number of alates produced. If alates were found, they were removed from the colony prior to returning the colony to the field. We did this to prevent genetic contamination by dispersants from the “away” transplants. Colonies were held at 25°C (14:10 L:D) for 1–2 days in the laboratory while being counted. Although this temperature is more reflective of growing season temperatures in both urban and rural Cleveland habitats rather than overwintering temperatures (Diamond et al. 2018), acorn ants, with their above‐ground nesting habit, are routinely exposed to large temperature swings during the cooler months in the wild (MacLean et al. 2017). Further, all colonies were exposed to the same laboratory conditions during the counting process regardless of transplant environment or site of origin. As plasticity in thermal tolerance to rearing temperature does not differ between urban and rural acorn ant populations in Cleveland (Diamond et al. 2018a), it is unlikely that the lab censusing conditions differentially affected survival or other traits in the field. Colonies were allowed to regather their nest inside their acorn before being returned to their transplant pen. All colonies were returned to their original pens in which they began the experiment.
Figure 1.

Fitness trade‐offs for the final four census points (census 8 through 11) (top row), and the monthly temperature profile with all census points (census 1 through 11) indicated (bottom row). Fitness trade‐off plots include estimated mean survival ± 1 SE for each combination of source population and environment from a generalized linear model that accounts for temporal autocorrelation. Note that census 8 y‐axis is scaled from 0.825 to 1, whereas censuses 9–11 are all scaled from 0.3 to 0.825 owing to high overwinter mortality following census 8. On the temperature profile plot, arrows indicate the timing of each census (at the monthly resolution); black arrows correspond with the census points highlighted in the top row. Red triangles indicate a warm‐season census (predominantly summer into fall) and blue asterisks indicate a cool‐season census (predominantly winter into spring), which correspond with the designations used in the analysis of seasonal bias in between‐census survival (Fig. 3). These symbols refer to the period between the previous and focal census point, for example, the red triangle at census 3 refers to a warm period between census 2 and 3, whereas the blue asterisk at census 4 refers to a cool period between census 3 and 4. Temperature indices include average monthly temperature (T avg), the extreme monthly minimum and maximum temperatures (T emnt and T emxt), and the average monthly minimum and maximum temperatures (T min and T max). Dates are reported as year‐month.
The multi‐year and multi‐census aspects of our reciprocal transplant experiment allowed us to explore not only the experiment endpoint, that is, fitness differences among transplanted ant colonies across environments, but also the seasonal impacts of climate on ant colony survival and colony size. Because we were interested in broad‐scale patterns of ant responses to seasonal variation in climate, we used local weather station data at the monthly resolution (GSOM – NOAA; station ID: GHCND:USW00014820) that best matched our colony censusing frequency. Our focal temperature variables included the monthly overall average, average maximum, average minimum, extreme maximum, and extreme minimum temperature. All climatological data were extracted using the ncdc function from the {rnoaa} package (Chamberlain 2019).
STATISTICAL ANALYSES
Cumulative survival
To evaluate our main hypotheses for local adaptation, that is, whether “home” colonies would exhibit greater fitness (survival) than “away” colonies, and whether “local” colonies would exhibit greater fitness than “foreign” colonies, we constructed a generalized linear model. As the response, we included cumulative survival to each census point, that is, the proportion of colonies within a given treatment that were alive at a given census relative to the starting number of colonies in that treatment. As predictors, we included source population (urban vs. rural), transplant environment (urban vs. rural), a continuous covariate for the census point, and the two‐ and three‐way interactions between these variables. We used a beta error distribution and included an arima correlation structure to account for temporal nonindependence among successive census points. We used the glmmTMB function from the {glmmTMB} library (Brooks et al. 2017) in R (R Core Team 2019) to construct this model. Although we were able to track individual colony survival, we preferred to model cumulative survival as the proportion of colonies surviving to each census point for each combination of source population and treatment environment. We preferred this model construct for two reasons: (1) improved model convergence and diagnostics compared with binomial colony‐level random effects models (results were qualitatively similar across both model constructs, i.e., a significant source population × treatment environment effect; Tables S4 and S5) and (2) biological relevance of the proportion of colonies surviving to each census point compared with individual colony‐level survival.
To analyze this model, we performed analysis of deviance to determine the statistical significance of the fixed effect predictors including main effects of source population, transplant environment, census point, and their interactions. We then performed post hoc analyses using the emmeans function from the {emmeans} library (Lenth 2019) to determine the statistical significance of the difference between urban and rural environments for each population (i.e., home/away comparisons) as well as the difference between urban and rural populations within each environment type (i.e., local/foreign comparisons) (sensu Hereford 2009). These comparisons allowed us to evaluate census‐specific differences in survival and identify the census points at which populations and environments diverged with respect to cumulative survival. Note that here and elsewhere for all statistical tests and estimates, we report values to three significant figures to maintain consistency across the different scales of responses (e.g., survival vs. fecundity).
Between‐census survival
To evaluate our secondary hypothesis that there would be seasonal bias in mortality based on the nature of the treatment, that is, that urban‐origin ants transplanted to the rural environment would exhibit greater mortality in winter owing to the evolved loss in cold tolerance, and that rural‐origin ants transplanted to the urban environment would exhibit greater mortality in summer owing to the lack of evolved gain in heat tolerance, we used a general linear model. For this analysis, we computed the between‐census survival for each combination of source population and transplant environment, that is, given the starting number of colonies at one census period, we calculated the proportion of colonies surviving to the next census period. This calculation yielded 10 between‐census estimates of survival for each of the four treatment groups. These values are fundamentally distinct from the cumulative survival values and contribute unique information, as they allow us to pinpoint the effects of seasonal changes in temperature on survival by resetting the denominator to the number of colonies alive at the beginning of each census point rather than estimating the overall rate of decline in survival over time as with the cumulative survival values.
To account for potential seasonal differences in mortality (typically winter‐biased for this species in natural populations; Herbers and Johnson 2007; Mitrus 2013), we took the ratio of survival of populations placed in the alternative environment versus populations placed in their own environment as our focal response variable. That is, for each census point, we divided the urban‐origin transplanted into the rural environment between‐census survival by the urban‐origin transplanted into the urban environment between‐census survival. We did the same for the rural‐origin transplanted into the urban environment between‐census survival, dividing by the rural‐origin transplanted into the rural environment between‐census survival at each census point. We then modeled these ratios as a function of season, a two‐level factor including summer and winter seasons, a two‐level factor of treatment (urban to rural/urban to urban, vs. rural to urban/rural to rural), and their interaction. We constructed this model using the glmmTMB function with a Gaussian error distribution as the distribution of the response variable and visual inspection of the model residuals indicated this approach was valid.
For our “season” predictor variable, we lumped census points into two categories: summer to early fall, and winter to early spring. The assignment of census points to summer versus winter categories was verified by the average monthly temperatures between each census interval (temperature data were based on NOAA GSOM): summer census intervals had a mean ± 1 SD of 20.3 ± 2.22°C, and the winter census intervals had a mean ± 1 SD of 8.69 ± 1.68°C. Owing to strong concordance between temperature means and extremes (Fig. 1), we focused the assignment of census points to winter versus summer categories on the basis of average monthly temperature.
Fecundity
Because the most relevant estimate of fitness via fecundity for an acorn ant colony is the total number of alates (reproductive ants) produced, we summed the total number of alates produced per colony over the course of the transplant experiment. Colonies received a value of 0 if they either failed to produce alates or the colony died over the course of the experiment. We modeled the total number of alates produced using a generalized linear model with a quasi‐Poisson error distribution. As predictors, we included source population, transplant environment, and their interaction.
Colony size
Although our focal analyses concerned more comprehensive metrics of fitness including survival and fecundity, we also examined the potential for source population, transplant environment, their interaction, and census effects on colony size, including the number of workers and number of brood. We took a similar modeling approach as to that used in the cumulative survival model, except that we used the Poisson error distribution and included a random intercept for colony identity as we fit these models as repeated measures at the level of the colony rather than the proportion of colonies that survived at each census point. We performed separate models for workers and brood as well as a model of total colony size, summing numbers of workers and brood.
Thermal tolerance
To reconfirm previous findings of phenotypic shifts in thermal tolerance traits between urban and rural source populations of acorn ants, we modeled heat tolerance (CTmax) and cold tolerance (CTmin) as functions of source population. We performed separate models for heat and cold tolerance traits. We used a linear mixed effects model in each case, with a random effect for colony identity to account for nonindependence of thermal tolerance trait values of individual workers from the same colony.
Results
CUMULATIVE AND CENSUS‐SPECIFIC SURVIVAL ACROSS TREATMENTS
The model of cumulative survival revealed a significant interaction between source population, transplant environment, and census point, consistent with local adaptation (χ 2 = 4.24, P = 0.0396; full model results shown in Table S4; Fig. 2). Post hoc analyses allowed us to assess the census points at which evidence for local adaptation became apparent (Fig. 1; Tables S6 and S7). By the midpoint of the experiment at census 6 (July, 2018), several patterns emerged: higher survival of the urban‐origin ants than rural‐origin ants in the urban environment (local/foreign advantage); higher survival of the rural‐origin ants than urban‐origin ants in the rural environment (local/foreign advantage); higher survival of the urban‐origin ants in the urban environment compared with the rural environment (home/away advantage); and higher survival of the rural‐origin ants in the rural environment compared with the urban environment (home/away advantage). All such comparisons were statistically significant at census 6 except the urban‐origin ants in the rural versus urban environment. It was not until census 8 that the higher survival of the urban‐origin ants in the urban versus rural environment was statistically significantly different. These patterns remained intact through the final census point, census 11 (Table S7).
Figure 2.

Survival curves (cumulative) over the entire experiment for each combination of source population and environment. Predicted values from a generalized linear model that accounts for temporal autocorrelation.
SEASONAL BIAS IN MORTALITY
Our model of between‐census survival ratios of ants transplanted to the alternative versus their own environment revealed a significant interaction between urban‐origin versus rural‐origin source populations and summer versus winter seasons (season main effect: χ 2 = 5.29, P < 0.0001; population main effect: χ 2 = 12.8, P = 0.000344; season × population interaction: χ 2 = 39.6, P < 0.0001), which prompted us to use post hoc tests to examine the nature of this interaction effect. We found that, for the rural‐origin population colonies, relative survival in the urban environment versus rural environment was significantly lower in summer compared with winter (contrast of summer – winter: estimate = −0.0327, SE = 0.0142, df = 15, t = −2.30, P = 0.0362; Fig. 3). By contrast, for the urban‐origin population colonies, we found that the relative survival in the rural environment versus urban environment was significantly lower in winter compared with summer (contrast of summer – winter: estimate = 0.0911, SE = 0.0136, df = 15, t = 6.71, P < 0.0001; Fig. 3).
Figure 3.

Bias in the seasonal timing of colony survival. Ratio ± 1 SE of alternative/own treatment between‐census survival as a function of the summer versus winter season. Results are presented separately for rural‐origin and urban‐origin treatments. The dashed gray line indicates equal survival between away and home treatments; below the line indicates a survival advantage of the home treatment, and above the line indicates a survival advantage of the away treatment.
FECUNDITY
In some ways, the results for fecundity paralleled the results for survival. Specifically, post hoc analyses of the global model (which detected a significant effect of source population, χ 2 = 6.33, P = 0.0119; nonsignificant effect of transplant environment, χ 2 = 0.673, P = 0.412; and borderline effect of source population × transplant environment interaction, χ 2 = 2.96, P = 0.0855) revealed that the rural‐origin ants produced more alates than the urban‐origin ants in the rural environment: that is, local/foreign advantage (χ 2 = 12.1, P = 0.000497). In addition, the urban‐origin ants produced more alates (reproductive ants) in the urban environment than they did in rural environment: that is, home/away advantage (χ 2 = 6.00, P = 0.0143) (Fig. 4). These results were driven by the complete lack of alate production of the urban‐origin ants transplanted to the rural environment. By contrast, we found no evidence for a trade‐off with the rural‐origin ants transplanted to the urban environment with respect to alate production. We detected no significant difference between the urban‐origin and rural‐origin ants transplanted to the urban environment (χ 2 = 1.19, P = 0.275); and we detected no significant difference between the rural‐origin ants across the urban and rural environments (χ 2 = 0.580, P = 0.447) (Fig. 4). The results for fecundity were qualitatively similar between models where all colonies were included versus where only the fecundity of the surviving colonies was considered.
Figure 4.
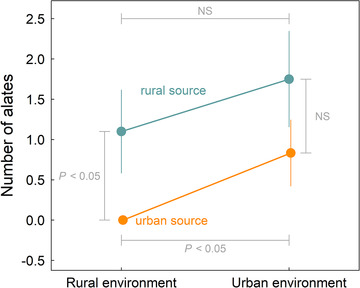
Estimated number of alates (reproductive ants) ± 1 SE produced per colony over the course of the transplant experiment for each combination of source population and environment. Statistical significance of each pairwise contrast of the two source populations within a single environment and of the two environments for a single source population is indicated with brackets and values (NS = nonsignificant at the P < 0.05 level).
COLONY SIZE
Our models of colony size revealed significant variation in the number of brood and workers across census points, with greater colony size in warmer summer months and reduced colony size in cooler winter months (Figs. S1 and S2). However, we detected no significant effects of source population, treatment environment, or their interaction; unsurprisingly, we detected a significant main effect of census point, but these results reflect typical increases and decreases in colony size across different seasons (Table S8) on colony size. Individual models of worker number and brood number yielded qualitatively similar results.
THERMAL TOLERANCE
For the subset of colonies measured pretransplant, we reconfirmed previous patterns of phenotypic shifts in acorn ant thermal tolerance traits across urban and rural source populations. Specifically, our models revealed significantly greater heat tolerance (β ± SE = 0.956 ± 0.143; χ 2 = 80.7, P < 0.0001) and a significant loss in cold tolerance (β ± SE = 1.29 ± 0.144; χ 2 = 44.6, P < 0.0001) in the urban population ants compared with rural population ants.
Discussion
Urbanization is a major disruptor to the typical environments under which most organisms evolved (Diamond and Martin 2020a; Johnson and Munshi‐South 2017). With substantial development of cities over the last century, urbanized environments provide an excellent venue for exploring contemporary adaptive evolution (Rivkin et al. 2019). We performed a multi‐year reciprocal transplant experiment with urban and adjacent rural populations of the acorn‐dwelling ant Temnothorax curvispinosus. Our study revealed evidence of local adaptation via survival: ant colonies had higher survival in their home environments than the away environments and local colonies had higher survival than foreign colonies. Mechanistically, these fitness differences appeared to reflect seasonal bias in the timing of mortality, with recently evolved losses of cold tolerance making urban‐origin colonies more likely to die during the winter season within the rural environment. In addition, the relatively low heat tolerances in the ancestral, rural population made rural‐origin colonies more likely to suffer mortality events during the summer season within the urban environment. Our results provide positive support of local adaptation of acorn ant populations to cities and ancestral rural habitats, and show how the consequences of heat and cold tolerance trait evolution play out differently across seasonal variation in temperature within each environment.
Urban heat island effects are often a key component of urbanization‐driven changes to the environment (Diamond and Martin 2020b; Szulkin et al. 2020). Contemporary evolution of physiological traits to cope with elevated temperatures in cities appears to be fairly repeatable across different taxa (Diamond and Martin, 2020b,c). Although the evolution of higher heat tolerance, for example, would appear to be adaptive, few studies have shown fitness benefits of the urban population in its home environment compared with the away, rural environment or of the local population in comparison with foreign populations. In water fleas, greater fitness of urban populations compared to rural populations reared in the laboratory suggests that the evolutionary divergence of heat tolerance between these populations is adaptive (Brans and De Meester 2018). Similarly, previous work in the acorn ant system shows evidence of fitness trade‐offs in fecundity along with evolutionary divergence in thermal tolerance traits. Phenotypic selection analyses on heat tolerance, for example, via fecundity show positive directional selection for increased heat tolerance in the urban environment (Diamond et al. 2018a). However, these data also come from lab‐reared colonies. Field‐based evidence of local adaptation to cities generally comes from plant studies. Gorton et al. (2018) performed a reciprocal transplant experiment of ragweed plants between multiple urban and rural sites. Although the rural plants generally had higher lifetime reproductive success across rural and urban sites, evidence of stronger phenotypic selection on the foreign population plants in both urban and rural habitats was suggestive of adaptive evolution within each environment. Similarly, Lambrecht et al. (2016) found widespread evidence of selection on many hawksbeard plant traits including physiological tolerance via a one‐way transplant of rural populations into the city. However, this study was not expressly designed to test for local adaptation (rather for patterns of phenotypic selection), as the reciprocal transplant in the other direction (urban into rural) was not performed.
Because acorn ants live within a contained environment and exhibit very low dispersal (Herbers 1990; Stuble et al. 2013), they can also be incorporated into transplant studies in a manner analogous to the plant studies described above. This is the approach we took here. By the midpoint of our multi‐year reciprocal transplant study, fitness trade‐offs via survival started to become apparent (Fig. 2). Importantly, these differences manifested in the directions consistent with local adaptation for both home/away and local/foreign comparisons of fitness: urban colonies exhibited higher survival in the urban environment compared with the rural environment (and vice versa for the rural colonies), and urban colony survival was higher than rural colony survival within the urban environment, whereas rural colony survival was higher than urban colony survival within the rural environment (Fig. 1). These patterns of survival match the directions of trait evolution found in previous studies in this system: urban populations have higher heat tolerance and diminished cold tolerance compared with the rural populations (Diamond et al. 2017, 2018a; Martin et al. 2019). Although we cannot completely exclude a potential role for transgenerational plastic effects in our reciprocal transplant experiment (i.e., that colonies in their home environment would have higher fitness owing to plasticity rather than evolutionary divergence), other work from the acorn ant study system suggests this explanation is unlikely. In a multigenerational laboratory rearing experiment, there was no evidence that transgenerational plasticity was responsible for the pattern of evolutionary divergence between urban and rural acorn ant populations in heat and cold tolerance traits (indeed, these were similar sites and populations from Cleveland as were used in the field reciprocal transplant study described here; see Martin et al. 2019). Further, although we cannot rule out the presence of other unmeasured selective agents besides temperature that might differ between urban and rural environments, the multi‐season and multi‐year nature of our study further suggests that temperature is an important cause of selection.
Uniquely, the reciprocal transplant study allowed us to examine seasonal changes in survival over the course of the experiment, which were not known from previous work in this system within the laboratory setting (Diamond et al. 2018a). We found that the particular evolutionary divergence of thermal tolerance traits in the acorn ant system contributed to seasonal bias in the timing of when mortality occurred. In particular, we found that the urban populations transplanted to the rural environment were especially prone to mortality in winter, which is consistent with the evolved loss of cold tolerance in the urban population. By contrast, rural populations transplanted to the urban environment were especially prone to mortality in the summer, which is consistent with no evolved compensatory gain in heat tolerance of the ancestral, rural population compared with the high heat tolerance of the urban population (Fig. 3). Like most ectothermic species, the plastic response to temperature, while present, also appears to be of insufficient magnitude to fully buffer the rural acorn ant colonies when transplanted into the urban environment (Gunderson and Stillman 2015; Sørensen et al. 2016).
The importance of seasonal timing, particularly for measuring fitness differences and selection, is also reflected in another urban evolution study in white clover. Thompson et al. (2016) detected positive directional selection via biomass (a fitness proxy) for increased cyanogenesis (an antiherbivory mechanism) in both urbanized and rural sites, and no selection via seed set, despite evolved decreases in cyanogenesis in urban populations (Thompson et al. 2016). Low cyanogenesis is likely due to increased costs associated with cyanogenesis in cold environments characteristic of many cities with reduced snow cover that exposes plants to cooler air temperatures than they would experience under the insulating effects of snowpack. Importantly, selection was measured during the summer that captures responses to herbivory and other potential warm‐season agents of selection, whereas the cost of cyanogenesis and selection against cyanogenesis would be expected to act during the winter season. Note that this particular selection experiment was designed to rule out urban‐rural spatial variation in herbivore pressure as a cause for urbanization clines in cyanogenesis rather than to serve as a direct test of seasonal variation in the patterns of selection; however, we nonetheless highlight this study as it reinforces the importance of seasonal variation in selection in an analogous manner to the acorn ant reciprocal transplant results presented here.
Although fitness trade‐offs have been found previously in the acorn ant system via fecundity measured in the laboratory (Diamond et al. 2018a), we only found partial support for fecundity‐based fitness trade‐offs in the field reciprocal transplant study. Although rural ants produced more offspring (reproductive, nonsterile) than urban ants within the rural environment, we found no significant difference between rural and urban ant colonies within the urban environment. As a consequence, the rural source population ant colonies had comparable fecundity across both urban and rural environments, whereas the urban source population ant colonies exhibited a significant increase in fecundity in the urban compared to the rural environment, consistent with local adaptation (Fig. 4). It is important to consider these results in context of the natural history of the acorn ant system. Acorn ant colony fecundity was measured as the number of winged, sexual ants (“alates”) produced per colony over the course of the experiment (Chick et al. 2019). Often, alate production is strongly tied to seasonal variation in temperature. Specifically, colonies typically produce alates in the later summer months, when temperatures are relatively warm (Alloway et al. 1982; Herbers 1990). In the laboratory, warmer rearing temperatures also advance the date of maximum alate production (Chick et al. 2019), providing further evidence of the link between temperature and reproduction. It is possible that the urban ant colonies transplanted to the rural environment never receive the correct temperature‐photoperiod cue to begin the production of alates, as this environment might be too cold to provide such a cue at the expected photoperiod. By contrast, rural colonies transplanted to the urban environment might have received the warm‐season cue to produce alates earlier, resulting in relatively high alate production of rural source population colonies within the urban environment. Because we were able to track alate production across multiple seasons in the reciprocal transplant study and the acorn ants were able to respond to seasonal variation in temperature, this might explain why we did not see the complete trade‐off in the field (i.e., due to phenological shifts) as we did in the laboratory. Other possibilities include laboratory food supplementation, field microclimatic variation, or different rates of adaptation for survival and fecundity (i.e., survival may contribute more to fitness than fecundity for these populations, sensu Moore and Martin 2019). We detected no significant differences in colony size across the treatments, and so colonies having insufficient numbers of workers to leave the “ergonomic” phase of colony growth and enter the “reproductive” phase (Herbers 1990; Hölldobler and Wilson 1990) seems an unlikely explanation for the alate responses.
Considering our results from both the survival and fecundity components of fitness, a picture emerges that overall, rural‐origin ants perform better in the urban environment than the urban‐origin ants perform in the rural environment. Thus, is it important to consider what might explain the greater fitness trade‐off associated with adaptation to the urban environment. In effect, the urban populations are actually becoming more maladapted to their ancestral environment faster than they are adapting to the novel environment. Certainly the rural populations have had more generations to evolve, but this does not explain the considerable loss of adaptation for the urban populations to the ancestral rural environment. Longstanding theory predicts that adaptation to a new environment can cause increasing fitness trade‐offs to the ancestral environment (Futuyma and Moreno 1988; Fry 1996; Kassen 2002; Schick et al. 2015), which could explain the generally greater fitness trade‐offs for urban populations transplanted to their ancestral rural environment. Previous common‐garden laboratory studies using some of these same acorn ant populations have found that while evolving greater tolerance to high temperatures, urban acorn ants in Cleveland have evolved even greater magnitude of losses in their cold tolerance, which could partially explain the fitness trade‐off (Diamond et al. 2018a; Martin et al. 2019). Whether this result is due to relaxed selection on cold tolerance in urban environments, correlated evolution of heat and cold tolerance (e.g., through antagonistic pleiotropy, genetic trait correlations), or another mechanism (e.g., mutation accumulation) is not yet known.
Regardless of the specific mechanisms underlying fitness trade‐offs to urban adaptation, they have important implications for responses to ongoing global change. Indeed, the presence of unequal trade‐offs suggests that the urban acorn ant populations are still somewhat maladapted (not yet on a fitness peak) to the many, rapid stressors imposed by cities, even if they are currently exhibiting adaptive evolutionary responses to urbanization. Thus, although it is encouraging that contemporary urban local adaptation is possible, unfortunately, the results of our study join a broad range of evidence showing that the magnitude and rate of anthropogenic environmental change could exceed the capacity of some species to keep pace (reviewed in Diamond and Martin 2020a; and see Radchuk et al. 2019).
Although researchers generally appreciate the value and importance of measuring fitness differences across environments, particularly to assess the adaptive nature of evolutionary divergence, few tests exist because fitness is notoriously difficult to measure (Hendry et al. 2018). Indeed, the studies that have attempted field reciprocal transplants in urban contexts or simulated them in the laboratory are a unique subset of taxa that can potentially be easily manipulated in the lab or field, including birds (Capilla‐Lasheras et al. 2017), lizards (Hall and Warner 2018), invertebrates (Tüzün et al. 2017b; Diamond et al. 2018a; Brans and De Meester 2018), and plants (Gorton et al. 2018). Further, of the studies that did measure urban fitness differences, only the ragweed study of Gorton et al. (2018), discussed above, measured total fitness under field conditions. In the acorn ant study described here, it was especially important to measure both survival and fitness components given the somewhat contrasting results and trade‐offs among fitness components documented in other systems, including systems across urbanization gradients (Lucas and French 2012). Our study also demonstrated the importance of seasonal differences in fitness trade‐offs as single‐season results could give misleading inferences. Finally, although our study revealed strong evidence of local adaptation to the urban environment, the effect of urban adaptation relative to rural adaptation suggests that acorn ants are still in process of adapting to cities. In particular, it is unclear how future selection will shape acorn ant physiological tolerances with the current evolved loss of cold tolerance in urban populations and persistence of extreme cold temperature events (Diamond and Martin 2020a). Although long‐term reciprocal transplant studies are unlikely to be feasible for a number of urban systems, a focused effort to identify systems amenable to reciprocal transplantation and fine‐scale temporal monitoring could help to uncover the nature and frequency at which adaptive contemporary urban evolution occurs.
AUTHOR CONTRIBUTIONS
RAM and SED planned and designed the study, analyzed the data, and wrote the first draft of the manuscript. LDC helped to design the study, collected all experimental data, and contributed to revisions. MLG helped maintain the experiment, collected experimental data, and contributed to revisions.
DATA ARCHIVING
Data available at Dryad: https://doi.org/10.5061/dryad.kh189324v
CONFLICT OF INTEREST
The authors declare no conflict of interest.
Associate Editor: J. T. Anderson
Handling Editor: A. G. McAdam
Supporting information
Table S1. Collection and transplant site details for each colony.
Table S2. Seasonal acclimation on thermal tolerance.
Table S3. Pre‐transplant colony demographic analysis across treatments.
Table S4. Analysis of deviance testing for the significance of main and interaction effects of source population, transplant environment and census point on the proportion of colonies surviving.
Table S5. Results (analysis of deviance) from two alternative model specifications using individual colony survival as the response variable.
Table S6. Model estimates and standard errors of cumulative survival for each combination of source population, transplant environment, and census point.
Table S7. Post‐hoc comparisons for the cumulative survival model across source population, treatment environment, and census point.
Table S8. Analysis of deviance testing for the significance of main and interaction effects of source population, transplant environment and census point on colony size (worker plus brood number).
Figure S1. Colony collection and transplant sites.
Figure S2. Number of workers per colony at each census point.
Figure S3. Number of brood per colony at each census point.
ACKNOWLEDGMENTS
The Squire Valleevue and Valley Ridge Farm, the Holden Forests and Gardens, and Case Western Reserve University provided access to field sites. An Oglebay Fund grant provided financial support. We thank S. Strickler, C. Zhao, N. Khiraoui, S. Fremont, and C. Burchmore for assistance with field and lab work. We also thank M. Moore for helpful comments on a previous version of this manuscript.
Contributor Information
Ryan A. Martin, Email: ram225@case.edu.
Sarah E. Diamond, Email: sarah.diamond@case.edu.
LITERATURE CITED
- Alloway, T. , Buschinger A., Talbot M., Stuart R., and Thomas C.. 1982. Polygyny and polydomy in three North American species of the ant genus Leptothorax Mayr (Hymenoptera: Formicidae). Psyche 89:249–274. [Google Scholar]
- Blanquart, F. , Kaltz O., Nuismer S. L., and Gandon S.. 2013. A practical guide to measuring local adaptation. Ecol. Lett. 16:1195–1205. [DOI] [PubMed] [Google Scholar]
- Brady, S. P. , Bolnick D. I., Angert A. L., Gonzalez A., Barrett R. D. H., Crispo E., Derry A. M., Eckert C. G., Fraser D. J., Fussmann G. F., et al. 2019. Causes of maladaptation. Evol. Appl. 12:1229–1242. [DOI] [PMC free article] [PubMed] [Google Scholar]
- Brans, K. I. , and De Meester L.. 2018. City life on fast lanes: urbanization induces an evolutionary shift towards a faster life style in the water flea Daphnia . Funct. Ecol. 32:2225–2240. [Google Scholar]
- Brooks, M. E. , Kristensen K., van Benthem K. J., Magnusson A., Berg C. W., Nielsen A., Skaug H. J., Maechler M., and Bolker B. M.. 2017. glmmTMB balances speed and flexibility among packages for zero‐inflated generalized linear mixed modeling. R J. 9:378–400. [Google Scholar]
- Capilla‐Lasheras, P. , Dominoni D. M., Babayan S. A., O'Shaughnessy P. J., Mladenova M., Woodford L., Pollock C. J., Barr T., Baldini F., and Helm B.. 2017. Elevated immune gene expression is associated with poor reproductive success of urban blue tits. Front. Ecol. Evol. 5:64. [Google Scholar]
- Chamberlain, S. 2019. rnoaa: “NOAA” weather data from R. Available via https://CRAN.R-project.org/package=rnoaa.
- Chick, L. D. , Strickler S. A., Perez A., Martin R. A., and Diamond S. E.. 2019. Urban heat islands advance the timing of reproduction in a social insect. J. Therm. Biol. 80:119–125. [DOI] [PubMed] [Google Scholar]
- Chick, L. D. , Waters J. S., and Diamond S. E.. 2021. Pedal to the metal: cities power evolutionary divergence by accelerating metabolic rate and locomotor performance. Evol. Appl. 14:36–52. [DOI] [PMC free article] [PubMed] [Google Scholar]
- Diamond, S. E. , Chick L. D., Perez A., Strickler S. A., and Martin R. A.. 2017. Rapid evolution of ant thermal tolerance across an urban‐rural temperature cline. Biol. J. Linn. Soc. 121:248–257. [Google Scholar]
- Diamond, S. E. , Chick L. D., Perez A., Strickler S. A., and Martin R. A. 2018a. Evolution of thermal tolerance and its fitness consequences: parallel and non‐parallel responses to urban heat islands across three cities. Proc. R. Soc. B 285:20180036. [DOI] [PMC free article] [PubMed] [Google Scholar]
- Diamond, S. E. , Chick L. D., Perez A., Strickler S. A., and Zhao C.. 2018b. Evolution of plasticity in the city: urban acorn ants can better tolerate more rapid increases in environmental temperature. Conserv. Physiol. 6:coy030. [DOI] [PMC free article] [PubMed] [Google Scholar]
- Diamond, S. E. , and Martin R. A.. 2020a. Evolution is a double‐edged sword, not a silver bullet, to confront climate change. Ann. N. Y. Acad. Sci. 1469:38–51. [DOI] [PubMed] [Google Scholar]
- Diamond, S. E. , and Martin R. A. 2020b. Evolutionary consequences of the urban heat island. Pp. 91–110 in Szulkin M., Munshi‐South J., and Charmantier A., eds. Urban evolutionary biology. Oxford Univ. Press, Oxford, NY. [Google Scholar]
- Diamond, S. E. , and Martin R. A. 2020c. Physiological adaptation to cities as a proxy to forecast global‐scale responses to climate change. J. Exp. Biol. 10.1101/2020.08.21.251025. [DOI] [PubMed] [Google Scholar]
- Donihue, C. M. , and Lambert M. R.. 2015. Adaptive evolution in urban ecosystems. Ambio 44:194–203. [DOI] [PMC free article] [PubMed] [Google Scholar]
- Fry, J. D. 1996. The evolution of host specialization: are trade‐offs overrated? Am. Nat. 148:S84–S107. [Google Scholar]
- Futuyma, D. J. , and Moreno G.. 1988. The evolution of ecological specialization. Ann. Rev. Ecol. Syst. 19:207–233. [Google Scholar]
- Gorton, A. J. , Moeller D. A., and Tiffin P.. 2018. Little plant, big city: a test of adaptation to urban environments in common ragweed (Ambrosia artemisiifolia). Proc. Biol. Sci. 285:20180968. [DOI] [PMC free article] [PubMed] [Google Scholar]
- Gunderson, A. R. , and Stillman J. H.. 2015. Plasticity in thermal tolerance has limited potential to buffer ectotherms from global warming. Proc. R. Soc. B 282:20150401. [DOI] [PMC free article] [PubMed] [Google Scholar]
- Hall, J. M. , and Warner D. A.. 2018. Thermal spikes from the urban heat island increase mortality and alter physiology of lizard embryos. J. Exp. Biol. 22:jeb181552. [DOI] [PubMed] [Google Scholar]
- Hendry, A. P. 2009. Ecological speciation! Or the lack thereof? Can. J. Fish. Aquat. Sci. 66:1383–1398. [Google Scholar]
- Hendry, A. P. , and Kinnison M. T.. 1999. Perspective: the pace of modern life: measuring rates of contemporary microevolution. Evolution 53:1637–1653. [DOI] [PubMed] [Google Scholar]
- Hendry, A. P. , Schoen D. J., Wolak M. E., and Reid J. M.. 2018. The contemporary evolution of fitness. Ann. Rev. Ecol. Evol. Syst. 49:457–476. [Google Scholar]
- Herbers, J. M. 1989. Community structure in north temperate ants ‐ temporal and spatial variation. Oecologia 81:201–211. [DOI] [PubMed] [Google Scholar]
- Herbers, J. M. 1990. Reproductive investment and allocation ratios for the ant Leptothorax longispinosus: sorting out the variation. Am. Nat. 136:178–208. [Google Scholar]
- Herbers, J. M. , and Johnson C.. 2007. Social structure and winter survival in acorn ants. Oikos 116:829–835. [Google Scholar]
- Hereford, J. 2009. A quantitative survey of local adaptation and fitness trade‐offs. Am. Nat. 173:579–588. [DOI] [PubMed] [Google Scholar]
- Hölldobler, B. , and Wilson E. O.. 1990. The ants. Springer‐Verlag, Berlin, Germany. [Google Scholar]
- Irwin, R. E. , Warren P. S., and Adler L. S.. 2018. Phenotypic selection on floral traits in an urban landscape. Proc. R. Soc. B Biol. Sci. 285:20181239. [DOI] [PMC free article] [PubMed] [Google Scholar]
- Johnson, M. T. J. , and Munshi‐South J.. 2017. Evolution of life in urban environments. Science 358:eaam8327. [DOI] [PubMed] [Google Scholar]
- Kassen, R. 2002. The experimental evolution of specialists, generalists, and the maintenance of diversity. J. Evol. Biol. 15:173–190. [Google Scholar]
- Kawecki, T. J. , and Ebert D.. 2004. Conceptual issues in local adaptation. Ecol. Lett. 7:1225–1241. [Google Scholar]
- Keller, L. 1998. Queen lifespan and colony characteristics in ants and termites. Insectes Soc. 45:235–246. [Google Scholar]
- Kern, E. M. A. , and Langerhans R. B.. 2018. Urbanization drives contemporary evolution in stream fish. Glob. Chang. Biol. 24:3791–3803. [DOI] [PubMed] [Google Scholar]
- Kern, E. M. A. , and Langerhans R. B. 2019. Urbanization alters swimming performance of a stream fish. Front. Ecol. Evol. 6:229. [Google Scholar]
- Lambrecht, S. C. , Mahieu S., and Cheptou P.‐O.. 2016. Natural selection on plant physiological traits in an urban environment. Acta Oecol. 77:67–74. [Google Scholar]
- Lenth, R. 2019. emmeans: estimated marginal means, aka least‐squares means. Available via https://CRAN.R-project.org/package=emmeans.
- Lighton, J. R. , and Turner R. J.. 2004. Thermolimit respirometry: an objective assessment of critical thermal maxima in two sympatric desert harvester ants, Pogonomyrmex rugosus and P. californicus . J. Exp. Biol. 207:1903–1913. [DOI] [PubMed] [Google Scholar]
- Lucas, L. D. , and French S. S.. 2012. Stress‐induced tradeoffs in a free‐living lizard across a variable landscape: consequences for individuals and populations. PLoS ONE 7:e49895. [DOI] [PMC free article] [PubMed] [Google Scholar]
- MacLean, H. J. , Penick C. A., Dunn R. R., and Diamond S. E.. 2017. Experimental winter warming modifies thermal performance and primes acorn ants for warm weather. J. Insect Physiol. 100:77–81. [DOI] [PubMed] [Google Scholar]
- Martin, R. A. , Chick L. D., Yilmaz A. R., and Diamond S. E.. 2019. Evolution, not transgenerational plasticity, explains the divergence of acorn ant thermal tolerance across an urban‐rural temperature cline. Evol. Appl. 12:1678–1687. [DOI] [PMC free article] [PubMed] [Google Scholar]
- Mitrus, S. 2013. Cost to the cavity‐nest ant Temnothorax crassispinus (Hymenoptera: Formicidae) of overwintering aboveground. Eur. J. Entomol. 110:177–179. [Google Scholar]
- Modlmeier, A. P. , Foitzik S., and Scharf I.. 2013. Starvation endurance in the ant Temnothorax nylanderi depends on group size, body size and access to larvae. Physiol. Entomol. 38:89–94. [Google Scholar]
- Moore, M. P. , and Martin R. A.. 2019. On the evolution of carry‐over effects. J. Anim. Ecol. 88:1832–1844. [DOI] [PubMed] [Google Scholar]
- Negroni, M. A. , Foitzik S., and Feldmeyer B.. 2019. Long‐lived Temnothorax ant queens switch from investment in immunity to antioxidant production with age. Sci. Rep. 9:7270. [DOI] [PMC free article] [PubMed] [Google Scholar]
- Penick, C. A. , Diamond S. E., Sanders N. J., and Dunn R. R.. 2017. Beyond thermal limits: comprehensive metrics of performance identify key axes of thermal adaptation in ants. Funct. Ecol. 31:1091–1100. [Google Scholar]
- Perrier, C. , Caizergues A., and Charmantier A.. 2020. Adaptation genomics in urban environments. Pp. 74–90 in Szulkin M., Munshi‐South J., and Charmantier A., eds. Urban evolutionary biology. Oxford Univ. Press, Oxford, NY. [Google Scholar]
- R Core Team . 2019. R: a language and environment for statistical computing. R Foundation for Statistical Computing, Vienna. Available via http://www.R-project.org/. [Google Scholar]
- Radchuk, V. , Reed T., Teplitsky C., van de Pol M., Charmantier A., Hassall C., Adamík P., Adriaensen F., Ahola M. P., Arcese P., et al. 2019. Adaptive responses of animals to climate change are most likely insufficient. Nat. Commun. 10:1–14. [DOI] [PMC free article] [PubMed] [Google Scholar]
- Reznick, D. N. , Losos J., and Travis J.. 2019. From low to high gear: there has been a paradigm shift in our understanding of evolution. Ecol. Lett. 22:233–244. [DOI] [PubMed] [Google Scholar]
- Rivkin, L. R. , Santangelo J. S., Alberti M., Aronson M. F. J., de Keyzer C. W., Diamond S. E., Fortin M.‐J., Frazee L. J., Gorton A. J., Hendry A. P., et al. 2019. A roadmap for urban evolutionary ecology. Evol. Appl. 12:384–398. [DOI] [PMC free article] [PubMed] [Google Scholar]
- Schick, A. , Bailey S. F., and Kassen R.. 2015. Evolution of fitness trade‐offs in locally adapted populations of Pseudomonas fluorescens . Am. Nat. 186:S48–S59. [DOI] [PubMed] [Google Scholar]
- Sørensen, J. G. , Kristensen T. N., and Overgaard J.. 2016. Evolutionary and ecological patterns of thermal acclimation capacity in Drosophila: is it important for keeping up with climate change? Curr. Opin. Insect Sci. 17:98–104. [DOI] [PubMed] [Google Scholar]
- Start, D. , Bonner C., Weis A. E., and Gilbert B.. 2018. Consumer‐resource interactions along urbanization gradients drive natural selection. Evolution 72:1863–1873. [DOI] [PubMed] [Google Scholar]
- Stuart, R. J. 1987. Transient nestmate recognition cues contribute to a multicolonial population structure in the ant, Leptothorax curvispinosus . Behav. Ecol. Sociobiol. 21:229–235. [Google Scholar]
- Stuble, K. L. , Pelini S. L., Diamond S. E., Fowler D. A., Dunn R. R., and Sanders N. J.. 2013. Foraging by forest ants under experimental climatic warming: a test at two sites. Ecol. Evol. 3:482–491. [DOI] [PMC free article] [PubMed] [Google Scholar]
- Szulkin, M. , Garroway C. J., Corsini M., Kotarba A. Z., and Dominoni D.. 2020. How to quantify urbanization when testing for urban evolution? Pp. 13–33 in Szulkin M., Munshi‐South J., and Charmantier A., eds. Urban evolutionary biology. Oxford Univ. Press, Oxford, NY. [Google Scholar]
- Thompson, K. A. , Renaudin M., and Johnson M. T. J.. 2016. Urbanization drives the evolution of parallel clines in plant populations. Proc. R. Soc. B 283:20162180. [DOI] [PMC free article] [PubMed] [Google Scholar]
- Tüzün, N. , Op de Beeck L., and Stoks R.. 2017a. Sexual selection reinforces a higher flight endurance in urban damselflies. Evol. Appl. 10:694–703. [DOI] [PMC free article] [PubMed] [Google Scholar]
- Tüzün, N. , Op de Beeck L., Brans K. I., Janssens L., and Stoks R.. 2017b. Microgeographic differentiation in thermal performance curves between rural and urban populations of an aquatic insect. Evol. Appl. 10:1067–1075. [DOI] [PMC free article] [PubMed] [Google Scholar]
- Winchell, K. M. , Reynolds R. G., Prado‐Irwin S. R., Puente‐Rolón A. R., and Revell L. J.. 2016. Phenotypic shifts in urban areas in the tropical lizard Anolis cristatellus . Evolution 70:1009–1022. [DOI] [PubMed] [Google Scholar]
- Winchell, K. M. , Maayan I., Fredette J. R., and Revell L. J.. 2018. Linking locomotor performance to morphological shifts in urban lizards. Proc. R. Soc. B Biol. Sci. 285:20180229. [DOI] [PMC free article] [PubMed] [Google Scholar]
- Yang, L. , Jin S., Danielson P., Homer C., Gass L., Bender S. M., Case A., Costello C., Dewitz J., Fry J., et al. 2018. A new generation of the United States National Land Cover Database: requirements, research priorities, design, and implementation strategies. ISPRS J. Photogramm. Remote Sens. 146:108–123. [Google Scholar]
Associated Data
This section collects any data citations, data availability statements, or supplementary materials included in this article.
Supplementary Materials
Table S1. Collection and transplant site details for each colony.
Table S2. Seasonal acclimation on thermal tolerance.
Table S3. Pre‐transplant colony demographic analysis across treatments.
Table S4. Analysis of deviance testing for the significance of main and interaction effects of source population, transplant environment and census point on the proportion of colonies surviving.
Table S5. Results (analysis of deviance) from two alternative model specifications using individual colony survival as the response variable.
Table S6. Model estimates and standard errors of cumulative survival for each combination of source population, transplant environment, and census point.
Table S7. Post‐hoc comparisons for the cumulative survival model across source population, treatment environment, and census point.
Table S8. Analysis of deviance testing for the significance of main and interaction effects of source population, transplant environment and census point on colony size (worker plus brood number).
Figure S1. Colony collection and transplant sites.
Figure S2. Number of workers per colony at each census point.
Figure S3. Number of brood per colony at each census point.
Data Availability Statement
Data available at Dryad: https://doi.org/10.5061/dryad.kh189324v