

Abstract
The bone marrow microenvironment plays an essential role in multiple myeloma (MM) progression. We aimed to explore the alterations of levels of long noncoding RNAs and messenger RNAs (mRNAs), derived from exosomes in peripheral blood, in resistance to bortezomib (Btz) of MM patients. Peripheral blood samples were collected from five Btz‐resistant and five Btz‐sensitive MM patients. Exosomes in patients' peripheral blood were enriched, and the profiles of long noncoding RNAs (lncRNAs) and mRNAs in exosomes were determined using deep sequencing. Bioinformatics analysis was performed to explore biological function. MTS was employed to determine the viability of Roswell Park Memorial Institute (RPMI) 8226 and LP‐1 cells incubated with exosomes derived from Btz‐resistant patients. Quantitative polymerase chain reaction (qPCR) was used to evaluate the levels of exosomal FFAR1, SP9, HIST1H2BG, and ITIH2. Incubation with Btz‐resistant patient‐derived exosomes significantly increased the viability of Btz‐treated RPMI 8226 and LP‐1 cells in a dose‐dependent manner. We identified 482 lncRNAs and 2099 mRNAs deregulated in exosomes of the Btz‐resistance group; and 78 mRNAs were enriched in DR‐related pathways, including mammalian target of rapamycin, platinum drug resistance, and the cAMP and phosphoinositide 3‐kinase–Akt signaling pathways. qPCR results verified the increases in FFAR1 and SP9 and decreases in HIST1H2BG and ITIH2 in Btz‐resistant patient‐derived exosomes. Moreover, exosomal FFAR1 and SP9 exhibited potential as independent prognostic indicators of survival of MM patients. Our study reveals significant dysregulation of exosomal RNA components in the Btz‐resistant group of MM patients as well as several mRNAs that may be used as biomarkers of prognosis of MM patients that are resistant to Btz.
Keywords: bortezomib resistance, exosomes, lncRNA, mRNA, multiple myeloma
Abbreviations
- BM
bone marrow
- BMME
bone marrow microenvironment
- BMSCs
BM stromal cells
- Btz
bortezomib
- ceRNAs
endogenous RNAs
- DFS
disease‐free survival
- DR
drug resistance
- lncRNAs
long noncoding RNAs
- MAPK
MAP kinases
- miRNAs
microRNAs
- MM
multiple myeloma
- OS
overall survival
- PCa
prostate cancer
1. INTRODUCTION
Multiple myeloma (MM) is the second most common hematologic malignancy, which is characterized by the abnormal growth and infiltration of clonal immunoglobulin‐producing plasma cells within the bone marrow (BM; Rajkumar, 2018). The interaction between myeloma cells and the bone marrow microenvironment (BMME) plays a pivotal role in MM initiation and progression, angiogenesis, bone disease, antitumor immunity, and drug resistance (DR; Faict et al., 2018; Tsukamoto et al., 2018; Wang et al., 2016a; Zarfati et al., 2019). An increasing number of studies indicates that MM cells affect BM cells to shape the microenvironment via cell‐cell contact and secretion of soluble factors, such as interleukin‐6, insulin‐like growth factor‐1, and vascular endothelial growth factor, which promote MM‐cell survival and DR (Manier et al., 2012; Wang et al., 2016b).
Exosomes, nanovesicles derived from endosomal tissues, are 30–150 nm, round, or cup‐shaped. Exosomes mediate proximal and distal cell‐cell communication via transfer of cargo from donor to target cells (Saleem & Abdel‐Mageed, 2015; Wan et al., 2018). The bioactive components of exosomes include lipids, proteins, microRNAs (miRNAs), messenger RNAs (mRNAs), long noncoding RNAs (lncRNAs), and DNA, which significantly influence gene expression, metabolism, and the functions of target cells (van Niel et al., 2018). Tumor‐derived exosomes broadly participate in MM progression, metastasis, composition of the microenvironment, angiogenesis, immunosuppression, and resistance to therapy (Faict et al., 2018; Frassanito et al., 2019; Wang et al., 2016a; 2016b).
Since the improvements of autologous hematopoietic stem cell transplantation therapy and the emergence of novel drugs, including bortezomib (Btz), panobinostat, melphalan, and lenalidomide, the survival rate of MM patients significantly improved in recent years (Heusschen et al., 2018). Owing to therapeutic resistance, MM remains incurable, and most patients will relapse or progress to a refractory stage. The proteasome inhibitor Btz induces apoptosis of MM cells and influences the BMME by inhibiting cytokine circuits, cell adhesion, and angiogenesis (Hideshima et al., 2001; Hideshima et al., 2003). However, the responses to Btz are rarely durable because of the emergence of DR. Recent studies show that the BMME induces DR of MM cells. BMME protects MM cells from apoptosis caused by Btz through cell‐cell contact (Hao et al., 2011), BMME‐derived exosomes antagonize Btz‐induced apoptosis and decreases the viability of MM cells (Wang et al., 2014). Moreover, exosomal miRNAs are potential predictors of DR of MM patients (Zhang et al., 2016). Accordingly, the interest in the roles of BMME, cell crosstalk, and exosomes in DR has dramatically increased.
Exosomes makes it possible for these structures to serve as novel, minimally noninvasive biomarkers for cancer diagnosis, prognosis, and DR. Accordingly, we hypothesized that the alteration in profiles of exosomal RNAs from peripheral blood implicated in DR may possess remarkable potential as predictor of DR in MM patients. In the present study, deep sequencing was performed to analyze exosomal mRNAs and lncRNAs, which were isolated from the peripheral blood of Btz‐sensitive and Btz‐resistant MM patients. Our results reveal significant dysregulation of RNA components of exosomes in the latter group. We show further that several mRNAs may serve as prognostic biomarkers for Btz‐resistant MM.
2. MATERIALS AND METHODS
2.1. Serum
Ten peripheral blood specimens were obtained from MM patients (male/female: 4/6; average age, 54 ± 6.24 years) at the Third Affiliated Hospital of Southern Medical University between January 2017 and December 2017. Before being enrolled in the group, all patients were those who indicated that they did not agree to the transplant. All patients using the Vcd (Btz containing regimen is Btz + cyclophosphamide + dexamethasone) treatment regimen. Among these patients, five Btz‐senstive patients (three females and two males) responded to Btz treatment and achieved complete remission after standard Btz therapy (nine cycles). The five Btz‐resistant patients (three females and two males) showed a poor response to standard Btz treatment (nine cycles) and progressed to the treatment‐refractory stage. For some patients, according to the evaluation of the efficacy, determine the resistance to Btz, we will change the regimen, which includes large dose of melphalan. The diagnostic and eligibility criteria of MM conformed to the NCCN guidelines (version 2. 2017) as follows: serum and urine M protein showed alterations in immunofixation electrophoresis and protein electrophoresis, changes in the number of BM plasma cells, emergence of new plasmacytomas, osteolytic lesions, and hypercalcemia. Approval of this study was granted by the Committees for Ethical Review at Southern Medical University. All clinical samples were obtained with written informed consent from MM patients.
Peripheral blood samples from each MM patient were collected in nonheparinized Vacutainer tubes, the samples were allowed to clot at room temperature for 1 h, and the clots were then removed by centrifuging at 1500g, 4°C, for 15 min. The supernatants were collected and centrifuged at 3000g, 4°C, for 20 min. Subsequently, the supernatants were centrifuged at 16000g, 4°C, for 20 min, and the next set of supernatants was harvested. Eventually, 5 ml of serum was isolated from each peripheral blood sample. To enrich the exosomes, the five Btz‐sensitive and five Btz‐resistant patients' serum samples were each combined into a separate pool. The Btz‐sensitive patients' serum samples are designated the Btz‐sensitive group, and the Btz‐resistant patients' serum samples are designated the Btz‐resistant group.
2.2. Exosome isolation and identification
Serum pools were filtered through 0.22‐μm filters, and then the filtered samples were concentrated via centrifugation at 6000g for 10 min at 4°C using an Amicon Ultra‐15 with an Ultracel 30‐kDa membrane (Millipore, Billerica, MA). The concentrated sera were collected and mixed with the 1/4 volume of serum of polyethylene glycol buffer, and incubated overnight at 4°C. Exosomes were precipitated via centrifugation at 1,000,000g for 70 min at 4°C. The recovered exosomes were resuspended in 200–500 μl of 1X phosphate‐buffered salineand stored at –80°C.
The size distribution of exosomes was evaluated by measuring the rate of Brownian motion using a NanoSight NS500 (Malvern) and NTA 2.3 software. A syringe‐pump system was utilized to introduce 40 µl of each exosome sample. Videos were recorded at 60‐s intervals, 25 frames per second, camera level 13. The measurement was conducted three times. Settings were as follows: detection threshold 5, automatic blur size, automatic minimum expected particle size, and maximum jump distance. And the morphology of exosomes was scanned using a scanning electron microscope.
Western blot analysis was performed to identify the proteins associated with exosomes. The concentration of exosomes is expressed in terms of protein concentration, that is, the bicinchoninic acid (BCA) method is used to detect the extracted exosomes. Briefly, the concentration of exosome proteins was quantified using a Pierce BCA Protein Assay Kit (Thermo Fisher Scientific). The protein samples were then mixed with 4 × Laemmli Sample Buffer (Bio‐Rad), and boiled for 10 min at 95°C. An equal amount of protein of each sample was subjected to 12% sodium dodecyl sulfate‐polyacrylamide gel electrophoresis and electrophoretically transferred to polyvinylidene difluoride membranes. The membranes were blocked with Tris‐buffered saline with Tween 20 (TBST) containing 5% bovine serum albumin for 1 h and then incubated with anti‐Alix (CST, 2171) and anti‐TSG101 (ab125011; Abcam) antibodies overnight at 4°C. Incubation with appropriate secondary antibodies was performed after the TBST wash. Finally, immunoreactive proteins were visualized using the ELC western blot detection system kit (ECL; Forevergen Biosciences Center) and imaged using a ChemiDoc MP Imaging System (Bio‐Rad) with Image Lab v. 5.2.1 software (Bio‐Rad).
2.3. MTS assay of cell proliferation
The Roswell Park Memorial Institute (RPMI) 8226 and LP‐1 human myeloma cells line were purchased from the ATCC. The cells were maintained in RPMI‐1640 medium (C11875500BT; Gibco) containing 10% FBS (LIFE 10099141) in a humidified incubator at 37°C in an atmosphere containing 5% CO2. The cells were added to 96‐well plates in the presence of 2 nM Btz and incubated for 48 h with 0, 5, 10, 20, and 40 µg/well exosomes derived from Btz‐sensitive or Btz‐resistant patients. RPMI 8226 and LP‐1 cells viability were subsequently determined using an MTS assay according to manufacturer's instructions. Briefly, the cells were incubated with MTS reagent (Promega G1112) for 2 h, and the optical density value at 490 nm was measured using a microplate reader (FLASH, Readmax1900). All experiments were performed three times.
2.4. RNA extraction from exosomes and deep sequencing
Exosomal RNAs were isolated using a Total Exosome RNA Isolation Kit (Invitrogen) according to the manufactory's instruction. The RNA concentrations were measured using a NanoDrop 2000 (Thermo Fisher Scientific). An RNA 6000 Pico Kit (Agilent Technologies) was used to determine masses and size distributions of the RNAs. Forevergen Biosciences Center prepared an RNA‐seq library and performed deep nucleotide sequencing.
2.5. Bioinformatics analysis
Analysis of the Kyoto Encyclopedia of Genes and Genomes (KEGG) database was performed as described on the KEGG website (http://www.genome.jp/kegg/) as follows: adjusted p < .05, gene count ≥2. Differently expressed exosomal lncRNAs in in the Btz‐resistant group predicted to interact with miRNAs were identified using the MiRanda algorithm (https://omictools.com/miranda-tool), and the conditions for screening differential genes are the fold change ≥2 and FDR ≤ 0.01. Diagrams of the lncRNA–miRNA–mRNA interaction networks were prepared using Cytoscape software (V 2.8.3, http://www.cytoscape.org/).
2.6. Quantitative real time‐polymerase chain reaction
Exosomal RNAs were reverse‐transcribed using an M‐MLV Reverse Transcriptase kit (M1705; Promega) according to the manufacturer's instructions. The complementary DNA samples were analyzed using quantitative polymerase chain reaction (qPCR) assays with ChamQ SYBR qPCR Master Mix kit (Q341‐03; Vazyme) and a pPCR thermocycler (ABI, StepOne Plus) according to standard procedures. GAPDH was used as an internal control. Primers used in present study were as follows: FFAR1, Forward (F); AGCTCTCCTTCGGCCTCTAT and Reverse (R): GTAGACCAGGCTAGGGGTGA; SP9, F: TCTATACTCGGGGAAGAGCCG and R: GAAGGCGCTCGACTCTGG; ITIH2, F: GCCATTTCGATGGTGTTCCG and R: CGTCATACAGCACCACCAGT; HIST1H2BG, F: ACAGGTTCACCCCGATACTG and R: GTAATGGTCGAGCGCTTGTT) and GAPDH, F: GAGTCAACGGATTTGGTCGT and R: GACAAGCTTCCCGTTCTCAG.
2.7. Statistical analysis
All experiments were performed at least three times. Data are expressed as the mean ± standard error of the mean. The Student t test (two‐tailed) was used to evaluate the significance of differences between groups. p < .05 indicates a significant difference.
3. RESULTS
3.1. Isolation and characterization of exosomes isolated from the sera of btz‐sensitive and btz‐resistant groups
NTA of exosomes in both Btz‐sensitive and Btz‐resistant groups suggested that the size of exosomes mainly ranged from 100 to 150 nm (Figure 1a). Purified exosomes of Btz‐sensitive and Btz‐resistant groups, which expressed the exosomal markers Alix and TSG101 (Figure 1b).
Figure 1.
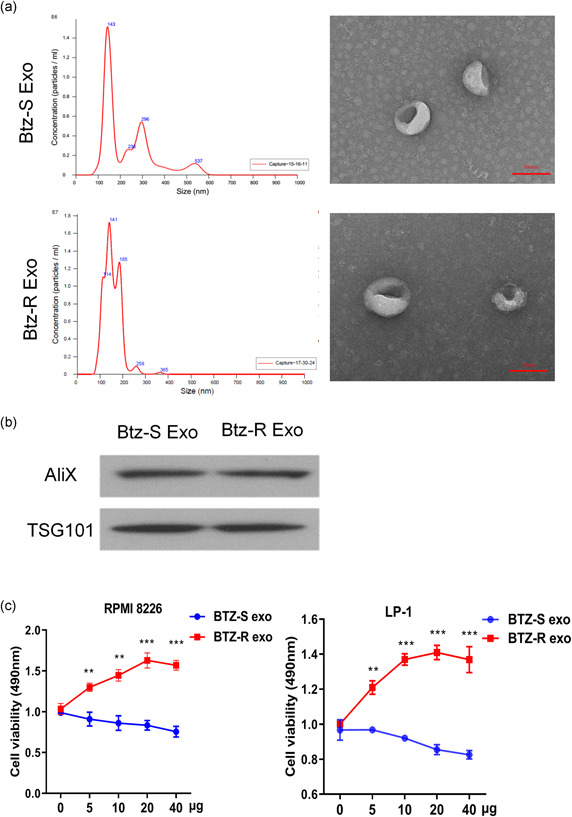
Identification of exosomes and cell viability. (a) Size distributions of exosomes in bortezomib (Btz)‐sensitive and Btz‐resistant groups. (b) Western blot analysis of isolated exosomes probed for the exosome‐marker proteins Tsg101 and Alix. (c) MTS analysis of RPMI 8226 and LP‐1 cells in the Btz‐sensitive and Btz‐resistant groups. RMPI, Roswell Park Memorial Institute. **p < .01; ***p < .001
3.2. Btz‐sensitive and btz‐resistant patient‐derived exosomes induce DR in MM cells
Btz (2 nM) significantly inhibits the viability of RPMI 8226 and LP‐1 human myeloma cells. Thus, RPMI 8226 and LP‐1 cells were treated with 2 nM Btz and then incubated with different concentrations of exosomes prepared from the sera of Btz‐sensitive and Btz‐resistant MM patients. Compared with Btz‐sensitive group, the exosomes of Btz‐resistant MM patients increased the viability of Btz‐treated RPMI 8226 and LP‐1 cells in a concentration‐dependent manner (Figure 1c).
3.3. Differential expression of exosomal lncRNAs and mRNAs in the btz‐resistant and btz‐sensitive groups
Deep sequencing analysis of exosomal mRNAs and lncRNAs isolated from Btz‐sensitive and Btz‐resistant groups identified 482 lncRNAs (Figures 2a,c) and 2099 mRNAs (Figures 2b,d) that were differentially expressed in the exosomes isolated from the Btz‐resistant patients, among which 394 lncRNAs and 1034 mRNAs were expressed at higher levels, and 88 lncRNAs and 785 mRNAs were expressed at lower levels vs the cut‐off value (fold change ≥2, FDR ≤ 0.01; Figure 2). The top 10 each of increased and decreased lncRNAs and mRNAs, respectively, are listed in Tables 1 and 2. And the levels of exosomal mRNAs encoding FFAR1, SP9, HIST1H2BG, and ITIH2 were significantly different in Btz‐resistant MM patients (Table 2).
Figure 2.

Expression profiles of thelong noncoding RNAs (lncRNAs) and messenger RNA (mRNA) of exosomes isolated from the Btz‐resistant group compared with those of the Btz‐sensitive group. Heatmap (a) and volcano plot (c) of differentially expressed lncRNAs. Heatmap (b) and volcano plot (d) of differentially expressed mRNAs. Btz, bortezomib
Table 1.
The top 10 upregulated and 10 downregulated lncRNAs
| geneID | Btz_S‐RPKM | Btz_R‐RPKM | log2 ratio (Btz_R/Btz_S) | Up‐downregulation (Btz_R/Btz_S) | p Value | FDR | Length |
|---|---|---|---|---|---|---|---|
| lnc‐PIGN‐7:1 | 0.127602603 | 7.23702947 | 5.825667978 | Up | 1.89E−10 | 4.73E−08 | 5421 |
| lnc‐PIGBOS1‐1:5 | 0.833414112 | 26.58790895 | 4.995592979 | Up | 4.68E−06 | 0.000484827 | 830 |
| MKX‐AS1:1 | 0.891409424 | 28.43809849 | 4.995592979 | Up | 4.68E−06 | 0.000483907 | 776 |
| lnc‐HRASLS‐2:2 | 3.577932998 | 71.86884966 | 4.328168318 | Up | 1.93E−09 | 4.19E−07 | 580 |
| lnc‐POU2AF1‐1:6 | 0.249858665 | 4.428383687 | 4.147596073 | Up | 5.82E−06 | 0.000571388 | 5537 |
| lnc‐HPCAL1‐3:1 | 3.828784389 | 63.33569126 | 4.048060399 | Up | 1.12E−07 | 1.78E−05 | 542 |
| MMP25‐AS1:16 | 2.23862043 | 31.74104916 | 3.825667978 | Up | 1.60E−06 | 0.000186292 | 927 |
| lnc‐GNG13‐6:3 | 1.231573376 | 16.00709586 | 3.700137096 | Up | 5.94E−06 | 0.000580705 | 1685 |
| lnc‐KCTD4‐1:1 | 3.70406272 | 45.95441053 | 3.6330229 | Up | 4.23E−07 | 5.77E−05 | 747 |
| lnc‐CCR3‐2:1 | 2.479332305 | 28.56267797 | 3.526107696 | Up | 1.52E−06 | 0.000177806 | 1116 |
| lnc‐NEMF‐1:6 | 325.7318267 | 6.11143754 | −5.736029107 | Down | 3.36E−258 | 1.53E−254 | 5617 |
| H19:7 | 260.4729304 | 10.64762552 | −4.612529807 | Down | 7.99E−55 | 1.15E−51 | 1612 |
| LINC02428:19 | 9.342958339 | 0.419216284 | −4.478112771 | Down | 8.64E−08 | 1.42E−05 | 5849 |
| H19:14 | 29.70047798 | 1.698058205 | −4.128528333 | Down | 4.72E−06 | 0.000485846 | 1444 |
| lnc‐ZNF705A‐5:1 | 29.35220847 | 1.734084899 | −4.081222618 | Down | 7.53E−06 | 0.000716728 | 1414 |
| lnc‐HIST4H4‐3:1 | 73.63616944 | 5.273109779 | −3.803688642 | Down | 8.63E−09 | 1.69E−06 | 930 |
| lnc‐ANKRD34B‐4:2 | 96.66147954 | 8.03055474 | −3.589369522 | Down | 1.04E−10 | 2.66E−08 | 916 |
| lnc‐KRT81‐1:1 | 238.3106999 | 22.42679312 | −3.409548484 | Down | 1.65E−17 | 6.65E−15 | 656 |
| lnc‐RAB23‐5:3 | 328.336336 | 32.16691297 | −3.351525024 | Down | 6.05E−58 | 9.15E−55 | 1677 |
| lnc‐DDX6‐1:1 | 30.65736181 | 3.061168598 | −3.324079142 | Down | 4.89E−06 | 0.00049936 | 1602 |
Abbreviations: Btz, bortezomib; FDR, false discovery rate; lncRNA, long noncoding RNA; MM, multiple myeloma; RPKM, reads per Kilobase per Million.
Table 2.
The top 10 upregulated and 10 downregulated mRNAs
| Gene | Btz_S (normalized) | Btz_R (normalized) | Fold change (Btz_R/Btz_S) | Up/down (Btz_R/Btz_S) | p Value | FDR |
|---|---|---|---|---|---|---|
| B2M | 8.556616818 | 69.73157278 | 8.149432687 | Up | 1.80E−22 | 2.05E−20 |
| TMEM240 | 3.489586447 | 27.30708707 | 7.825307523 | Up | 1.91E−10 | 6.25E−09 |
| GPR150 | 4.480308116 | 32.66253829 | 7.290243761 | Up | 1.03E−13 | 5.73E−12 |
| FFAR1 | 4.926882706 | 34.3176281 | 6.965383619 | Up | 2.80E−10 | 8.94E−09 |
| NTN3 | 4.579569726 | 31.50465181 | 6.879391229 | Up | 4.99E−19 | 4.52E−17 |
| UMOD | 8.571175403 | 56.60155451 | 6.603709742 | Up | 1.14E−41 | 2.22E−39 |
| TULP1 | 2.138999406 | 13.7953254 | 6.449429277 | Up | 2.88E−09 | 7.44E−08 |
| SLC12A1 | 3.035078125 | 19.09998786 | 6.293079476 | Up | 1.44E−25 | 1.88E−23 |
| SP9 | 5.357894242 | 33.05796106 | 6.169954008 | Up | 4.01E−14 | 2.37E−12 |
| SHISA8 | 4.623805529 | 28.38950323 | 6.139856672 | Up | 6.89E−12 | 2.86E−10 |
| ERH | 166.2636189 | 5.370245188 | 0.032299581 | Down | 3.04E−72 | 1.02E−69 |
| ITIH2 | 40.78201012 | 1.342501439 | 0.032918962 | Down | 1.62E−45 | 3.44E−43 |
| HIST1H4E | 434.2452482 | 16.59634973 | 0.03821884 | Down | 7.14E−86 | 2.87E−83 |
| HIST1H2BG | 248.1788653 | 9.666441339 | 0.038949494 | Down | 3.18E−58 | 8.73E−56 |
| HIST1H3F | 168.684562 | 7.552496598 | 0.044772897 | Down | 9.80E−41 | 1.82E−38 |
| HIST1H2AH | 340.3543837 | 15.44694037 | 0.045384873 | Down | 5.99E−83 | 2.37E−80 |
| HIST1H2BF | 210.0014188 | 11.82248692 | 0.056297176 | Down | 3.40E−44 | 7.09E−42 |
| HIST1H2AL | 270.9156525 | 15.80846451 | 0.058351979 | Down | 4.08E−61 | 1.19E−58 |
| HIST1H2BO | 281.0026225 | 17.58475653 | 0.062578621 | Down | 9.22E−62 | 2.72E−59 |
| HIST1H2BH | 183.4290852 | 12.88169616 | 0.070227119 | Down | 4.09E−36 | 7.03E−34 |
Abbreviations: Btz, bortezomib; FDR, false discovery rate; mRNA, messenger RNA.
3.4. Bioinformatics analysis
The differentially expressed lncRNAs included 83 (17.2%) intronic lncRNAs, 139 (28.8%) antisense lncRNAs, 4 (0.8%) sense lncRNAs, and 256 (53.1%) intergenic lncRNAs (Figure 3a). Chromosome 1 harbored a higher number of differentially expressed lncRNAs, and the number harbored by chromosome Y was lowest (Figure 3b). Moreover, the differentially expressed lncRNAs and mRNAs varied in length, with 77.4% of lncRNAs ranged between 0 and 4000 bp, and 78.6% of mRNAs ranged between 1000 and 5000 bp (Figure 3c). The raw dates have been deposited in public database BioProject: PRJNA 683937.
Figure 3.

Bioinformatics analysis of differentially expressed exosomal lncRNAs and mRNAs of the Btz‐resistant group. (a) The number and the classification of lncRNAs. (b) The chromosomal distribution of deregulated exosomal lncRNAs in Btz‐resistant group. (c) The numbers and the lengths of differentially expressed exosomal lncRNAs and mRNAs. (d) KEGG analysis of differentially expressed exosomal mRNAs. Btz, bortezomib; lncRNA, long noncoding RNA; mRNA, messenger RNA
To assess the potential biological effects of the top 10 each of increased and decreased mRNAs in the Btz‐resistant group compared with Btz‐sensitive group, we performed KEGG analysis. There were 24 KEGG pathways significantly enriched in sets of mRNAs ranging from 3 to 55 per enriched pathway (Figure 3d). Among them, four were involved in DR, including mammalian target of rapamycin (mTOR), platinum DR, and the cAMP and the phosphoinositide 3‐kinase (PI3K)–Akt signaling pathways; 15 genes were enriched in the mTOR pathway, 3 in the platinum DR pathway, 25 in the cAMP pathway, and 35 in the PI3K–Akt pathway (Figure 3d).
Certain lncRNAs function as competing endogenous RNAs (ceRNAs), which contain multiple miRNAs binding sites, enabling them to bind miRNAs to prevent the latter from regulating their target genes. To assess the potential involvement of lncRNAs in the deregulation of the expression of FFAR1, SP9, ITIH2, and HIST1H2BG, we constructed ceRNA networks comprising lncRNAs–miRNAs–FFAR1/SP9 and lncRNAs–miRNAs–ITIH2/HIST1H2BG. The miRNAs targeted FFAR1, SP9, ITIH2, or HIST1H2BG. Thus, the exosomal lncRNAs, which were more abundant in the Btz‐resistant group and had greater than 3 putative miRNA binding sites, were used to generate the lncRNAs–miRNAs–FFAR1/SP9 ceRNA network (Figure 4a), which comprised 11 miRNA nodes, 11 lncRNA nodes, and 14 edges. Notably, lnc‐EEF2‐3:1, lnc‐CFL1‐1:4, SATB2‐AS1:11, and lnc‐POU2AF1‐1:6 harbor multiple putative binding sites for greater than 3 miRNAs each targeting FFAR1 or SP9. Moreover, these four lncRNAs were predicted to interact with miR‐627‐3p targeting SP9, four lncRNAs were predicted to interact with miR‐642a‐5p targeting SP9, and two lncRNAs were predicted to bind miR‐675‐5p targeting FFAR1. Downregulated exosomal lncRNAs harboring greater than 3 putative miRNA binding sites were selected for the lncRNAs–miRNAs–ITIH2/HIST1H2BG ceRNA network. Thirty‐five miRNAs and 11 lncRNAs were predicted to interact with HIST1H2BG, whereas there was no significant cluster around ITIH2 (Figure 4b). Lnc‐CLASP2‐7:3, lnc‐MTERF2‐1:3, lnc‐NEMF‐1:6, and lnc‐UBE2E3‐6:1 were predicted to interact with 24, 26, 31, and 16 miRNAs targeting HIST1H2BG, respectively. These 4 lncRNAs contained greater than 8 binding sites for members of the miR‐302 family, 6–10 sites for miR‐4775, 3–4 sites for miR‐20a‐5p, 3–5 sites for miR‐373‐3p, and 3–5 sites for miR‐93‐5p. These results suggest potential relationships between FFAR1, SP9, and HIST1H2BG with lncRNAs.
Figure 4.
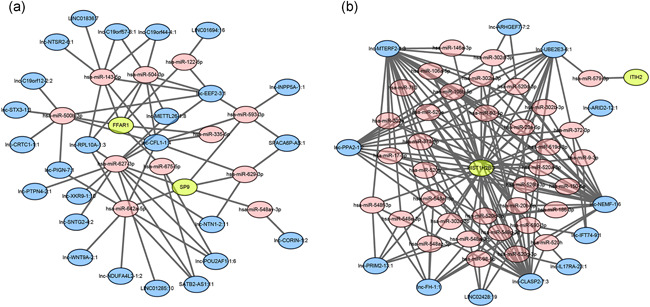
The lncRNAs–microRNAs (miRNAs)–FFAR1/SP9 (a) and lncRNAs–miRNAs–ITIH2/HIST1H2BG (b) ceRNA networks. The ellipses indicate mRNAs (green), lncRNAs (blue), and miRNAs (pink). ceRNA, competing endogenous RNA; lncRNA, long noncoding RNA; mRNA, messenger RNA
3.5. FFAR1, SP9, HIST1H2BG, and ITIH2 mRNAs are deregulated in btz‐resistant patients' exosomes
qPCR analysis detected significant differential expression of the mRNAs as follows (Figure 5): FFAR1 increased 2.3‐fold, SP9 increased 6‐fold, HIST1H2BG decreased 2‐fold, and ITIH2 decreased 5.5‐fold in Btz‐resistant MM patients' exosomes compared with Btz‐sensitive patients' exosomes.
Figure 5.

qPCR analysis of the levels of exosomal FFAR1, SP9, ITIH2, and HIST1H2BG mRNAs in Btz‐resistant and Btz‐sensitive MM patients. Btz, bortezomib; MM, multiple myeloma; qPCR, quantitative polymerase chain reaction
4. DISCUSSION
Early prediction of DR plays a pivotal role in optimizing therapeutic strategies for MM patients. Approximately 20%–30% of MM patients show innate Btz resistance, and almost all patients inevitably relapse or progress to treatment‐refractory MM with DR (Rajkumar, 2018). Here we attempted to identify potential factors related to Btz resistance of MM patients.
Our MTS results indicate that exosomes derived from Btz‐resistant MM patients' sera significantly increased the viability of MM cells in the presence of Btz, suggesting that exosomes influence DR. Our deep sequencing results show a significant difference in the expression profiles of mRNAs and lncRNAs derived from exosomes of Btz‐resistant and Btz‐sensitive MM patients. We identified 482 lncRNAs and 2099 mRNAs differentially expressed in the exosomes isolated from Btz‐resistant patients. The differentially expressed lncRNAs, which were typically (51.5%) less than 2000 bp, and the largest number of lncRNAs were located on chromosome 1. Moreover, the lengths of the differentially expressed mRNAs ranged mainly between 1000 and 3000 bp. These results suggest that RNAs are not nonspecifically incorporated into exosomes, and the RNA components of exosomes reflect the phenotypes of the cancer cells from which they were derived.
We employed KEGG analysis to evaluate the associations between the differentially expressed mRNAs and DR. We found four enriched terms associated with DR, including mTOR, platinum DR, and the cAMP and PI3K–Akt signaling pathways. The mTOR signaling pathway is dysregulated in diverse cancers (Johnson & Tee, 2017), and contributes to resistance to cancer therapeutics (Guri & Hall, 2016), such as to trastuzumab by breast cancer patients (Liu et al., 2017), cisplatin resistance of ovarian cancer cells (Peng et al., 2010), and imatinib‐resistant gastrointestinal stromal tumors (Hsueh et al., 2014). In multiple DR (MDR)‐positive breast cancer cells, the induction and maintenance of the MDR phenotype depends on the activation of the cAMP signal transduction pathway, which directly increases MDR1 transcription (Rohlff & Glazer, 1995).
The PI3K–AKT signal transduction pathway regulates cell growth, and its inappropriate activation is associated with decreased sensitivity to numerous anticancer drugs, such as paclitaxel, doxorubicin, and 5‐fluorouracil (Mayer & Arteaga, 2016). Our present findings show that the levels of exosomal mRNAs associated with DR pathways were significantly altered in Btz‐resistant patients. These mRNAs were delivered between the cells by exosomes, leading to the transmission of DR. Moreover, BMSC‐derived exosomes influence multiple signal transduction pathways that affect the survival of MM cells, which include components, such as JNK and p38 MAP kinases (MAPK), p53, and Akt, which stimulate increases in MM‐cell growth and induce Btz resistance (Wang et al., 2014). Our KEGG analysis shows that 35 mRNAs were enriched in the PI3K–AKT pathway, and 31 mRNAs were enriched in MAPK pathway, consistent with published data.
The mRNA levels of exosomal O6‐methylguanine DNA methyltransferase and alkylpurine‐DNA‐N‐glycosylase may serve as predictors of DR in patients with glioblastoma multiforme. These exosomal mRNA levels correlate well with the levels found in their parental cells, and their levels significantly change during treatment (Shao et al., 2015). FFAR1 is involved in the metabolic regulation of insulin secretion as well as in type 2 diabetes (Li et al., 2018). Further, FFAR1 plays roles in breast and prostate cancer (Wang et al., 2018; Yonezawa et al., 2004). The transcription factor SP9, contributes to limb development. However, the functions of FFAR1 and SP9 in MM are unknown. qPCR results show that the levels of exosomal FFAR1 and SP9 in Btz‐DR patients' sera were elevated. FFAR1‐low expression and SP9‐low expression MM patients experienced significantly longer OS and DFS. Moreover, the levels of exosomal HIST1H2BG and ITIH2 were significantly lower in DR patients compared with those of Btz‐sensitive patients. HIST1H2BG‐low expression and ITIH2‐low expression MM patients experienced shorter OS and DFS. The levels of HIST1H2BG in the urine of patients with prostate cancer (PCa) are lower compared with those of controls and therefore may serve as independent predictors of PCa (Mengual et al., 2016). ITIH2 stabilizes the extracellular matrix and prevents tumor metastasis (Cuvelier et al., 2000). However, the roles of HIST1H2BG and ITIH2 in MM are unknown. The results of the present study suggest that FFAR1, SP9, HIST1H2BG, and ITIH2 play important roles in the progression of MM.
To identify the mechanisms underlying the deregulation of exosomal FFAR1, SP9, HIST1H2BG, and ITIH2, we constructed lncRNAs–miRNAs–mRNAs ceRNA networks. Our results indicate that miR‐627‐3p and miR‐642a‐5p target SP9 and may bind, respectively, to four and three differentially expressed exosomal lncRNAs. In the future, we will study the relationship between the genes we discovered and miRNAs potentially targeting them.
In summary, we identified 582 lncRNAs and 2099 mRNAs that were differentially expressed in the exosomes of the Btz‐resistant group, among which 78 mRNAs were enriched in DR‐related pathways, including mTOR, platinum DR, and the cAMP and PI3K–Akt signaling pathways. FFAR1 and SP9 were upregulated, and HIST1H2BG and ITIH2 were downregulated in Btz‐resistant patients' exosomes. These four mRNAs show potential as independent prognostic indicators of survival in patients with MM. Moreover, the differentially expressed exosomal lncRNAs likely alter miRNA‐mediated regulation, contributing to Btz resistance in MM.
5. CONCLUSION
In conclusion, our study reveals significant differential expression of the noncoding RNA components of exosomes in the Btz‐resistant group of MM patients, and several of these exosomal mRNAs may serve used as prognostic biomarkers of resistance to Btz in MM.
CONFLICT OF INTEREST
The authors declare that there are no conflict of interests.
INFORMED CONSENT
Informed consent was obtained from all individual participants included in the study.
ETHICS STATEMENT
All procedures performed in studies involving human participants were in accordance with the ethical standards of the Committees for Ethical Review at Southern Medical University and with the 1964 Helsinki declaration and its later amendments or comparable ethical standards.
Tang J‐x, Chen Q, Li Q, He Y‐h, Xiao D. Exosomal mRNAs and lncRNAs involved in multiple myeloma resistance to bortezomib. Cell Biol Int. 2021;45:965–975. 10.1002/cbin.11540
DATA AVAILABILITY STATEMENT
The datasets generated during and/or analyzed during the current study are available from the corresponding author on reasonable request.
REFERENCES
- Cuvelier, A. , Muir, J. F. , Martin, J. P. , & Sesboüé, R. (2000). [Proteins of the inter‐alpha trypsin inhibitor (ITI) family. A major role in the biology of the extracellular matrix]. Revue des Maladies Respiratoires, 17(2), 437–446. [PubMed] [Google Scholar]
- Faict, S. , Muller, J. , De Veirman, K. , De Bruyne, E. , Maes, K. , Vrancken, L. , Heusschen, R. , De Raeve, H. , Schots, R. , Vanderkerken, K. , Caers, J. , & Menu, E. (2018). Exosomes play a role in multiple myeloma bone disease and tumor development by targeting osteoclasts and osteoblasts. Blood Cancer Journal, 8(11), 105. 10.1038/s41408-018-0139-7 [DOI] [PMC free article] [PubMed] [Google Scholar]
- Frassanito, M. A. , Desantis, V. , Di Marzo, L. , Craparotta, I. , Beltrame, L. , Marchini, S. , Annese, T. , Visino, F. , Arciuli, M. , Saltarella, I. , Lamanuzzi, A. , Solimando, A. G. , Nico, B. , De Angelis, M. , Racanelli, V. , Mariggiò, M. A. , Chiacchio, R. , Pizzuti, M. , Gallone, A. , … Vacca, A. (2019). Bone marrow fibroblasts overexpress miR‐27b and miR‐214 in step with multiple myeloma progression, dependent on tumour cell‐derived exosomes. Journal of Pathology, 247(2), 241–253. 10.1002/path.5187 [DOI] [PubMed] [Google Scholar]
- Guri, Y. , & Hall, M. N. (2016). mTOR signaling confers resistance to targeted cancer drugs. Trends in Cancer, 2(11), 688–697. 10.1016/j.trecan.2016.10.006 [DOI] [PubMed] [Google Scholar]
- Hao, M. , Zhang, L. , An, G. , Meng, H. , Han, Y. , Xie, Z. , Xu, Y. , Li, C. , Yu, Z. , Chang, H. , & Qiu, L. (2011). Bone marrow stromal cells protect myeloma cells from bortezomib induced apoptosis by suppressing microRNA‐15a expression. Leukemia & Lymphoma, 52(9), 1787–1794. 10.3109/10428194.2011.576791 [DOI] [PubMed] [Google Scholar]
- Heusschen, R. , Muller, J. , Duray, E. , Withofs, N. , Bolomsky, A. , Baron, F. , Beguin, Y. , Menu, E. , Ludwig, H. , & Caers, J. (2018). Molecular mechanisms, current management, and next generation therapy in myeloma bone disease. Leukemia & Lymphoma, 59(1), 14–28. 10.1080/10428194.2017.1323272 [DOI] [PubMed] [Google Scholar]
- Hideshima, T. , Mitsiades, C. , Akiyama, M. , Hayashi, T. , Chauhan, D. , Richardson, P. , Schlossman, R. , Podar, K. , Munshi, N. C. , Mitsiades, N. , & Anderson, K. C. (2003). Molecular mechanisms mediating antimyeloma activity of proteasome inhibitor PS‐341. Blood, 101(4), 1530–1534. 10.1182/blood-2002-08-2543 [DOI] [PubMed] [Google Scholar]
- Hideshima, T. , Richardson, P. , Chauhan, D. , Palombella, V. J. , Elliott, P. J. , Adams, J. , & Anderson, K. C. (2001). The proteasome inhibitor PS‐341 inhibits growth, induces apoptosis, and overcomes drug resistance in human multiple myeloma cells. Cancer Research, 61(7), 3071–3076. [PubMed] [Google Scholar]
- Hsueh, Y. S. , Chang, H. H. , Chiang, N. J. , Yen, C. C. , Li, C. F. , & Chen, L. T. (2014). MTOR inhibition enhances NVP‐AUY922‐induced autophagy‐mediated KIT degradation and cytotoxicity in imatinib‐resistant gastrointestinal stromal tumors. Oncotarget, 5(22), 11723–11736. 10.18632/oncotarget.2607 [DOI] [PMC free article] [PubMed] [Google Scholar]
- Johnson, C. E. , & Tee, A. R. (2017). Exploiting cancer vulnerabilities: mTOR, autophagy, and homeostatic imbalance. Essays in Biochemistry, 61(6), 699–710. 10.1042/ebc20170056 [DOI] [PubMed] [Google Scholar]
- Li, Z. , Xu, X. , Huang, W. , & Qian, H. (2018). Free fatty acid receptor 1 (FFAR1) as an emerging therapeutic target for type 2 diabetes mellitus: Recent progress and prevailing challenges. Medicinal Research Reviews, 38(2), 381–425. 10.1002/med.21441 [DOI] [PubMed] [Google Scholar]
- Liu, W. , Chang, J. , Liu, M. , Yuan, J. , Zhang, J. , Qin, J. , Xia, X. , & Wang, Y. (2017). Quantitative proteomics profiling reveals activation of mTOR pathway in trastuzumab resistance. Oncotarget, 8(28), 45793–45806. 10.18632/oncotarget.17415 [DOI] [PMC free article] [PubMed] [Google Scholar]
- Manier, S. , Sacco, A. , Leleu, X. , Ghobrial, I. M. , & Roccaro, A. M. (2012). Bone marrow microenvironment in multiple myeloma progression. Journal of Biomedicine and Biotechnology, 2012, 157496–5. 10.1155/2012/157496 [DOI] [PMC free article] [PubMed] [Google Scholar]
- Mayer, I. A. , & Arteaga, C. L. (2016). The PI3K/AKT pathway as a target for cancer treatment. Annual Review of Medicine, 67, 11–28. 10.1146/annurev-med-062913-051343 [DOI] [PubMed] [Google Scholar]
- Mengual, L. , Lozano, J. J. , Ingelmo‐Torres, M. , Izquierdo, L. , Musquera, M. , Ribal, M. J. , & Alcaraz, A. (2016). Using gene expression from urine sediment to diagnose prostate cancer: Development of a new multiplex mRNA urine test and validation of current biomarkers. BMC Cancer, 16, 76. 10.1186/s12885-016-2127-2 [DOI] [PMC free article] [PubMed] [Google Scholar]
- Peng, D. J. , Wang, J. , Zhou, J. Y. , & Wu, G. S. (2010). Role of the Akt/mTOR survival pathway in cisplatin resistance in ovarian cancer cells. Biochemical and Biophysical Research Communications, 394(3), 600–605. 10.1016/j.bbrc.2010.03.029 [DOI] [PMC free article] [PubMed] [Google Scholar]
- Rajkumar, S. V. (2018). Multiple myeloma: 2018 update on diagnosis, risk‐stratification, and management. American Journal of Hematology, 93(8), 981–1114. 10.1002/ajh.25117 [DOI] [PMC free article] [PubMed] [Google Scholar]
- Rohlff, C. , & Glazer, R. I. (1995). Regulation of multidrug resistance through the cAMP and EGF signalling pathways. Cellular Signalling, 7(5), 431–443. 10.1016/0898-6568(95)00018-k [DOI] [PubMed] [Google Scholar]
- Saleem, S. N. , & Abdel‐Mageed, A. B. (2015). Tumor‐derived exosomes in oncogenic reprogramming and cancer progression. Cellular and Molecular Life Sciences, 72(1), 1–10. 10.1007/s00018-014-1710-4 [DOI] [PMC free article] [PubMed] [Google Scholar]
- Shao, H. , Chung, J. , Lee, K. , Balaj, L. , Min, C. , Carter, B. S. , Hochberg, F. H. , Breakefield, X. O. , Lee, H. , & Weissleder, R. (2015). Chip‐based analysis of exosomal mRNA mediating drug resistance in glioblastoma. Nature Communications, 6, 6999. 10.1038/ncomms7999 [DOI] [PMC free article] [PubMed] [Google Scholar]
- Tsukamoto, S. , Løvendorf, M. B. , Park, J. , Salem, K. Z. , Reagan, M. R. , Manier, S. , Zavidij, O. , Rahmat, M. , Huynh, D. , Takagi, S. , Kawano, Y. , Kokubun, K. , Thrue, C. A. , Nagano, K. , Petri, A. , Roccaro, A. M. , Capelletti, M. , Baron, R. , Kauppinen, S. , & Ghobrial, I. M. (2018). Inhibition of microRNA‐138 enhances bone formation in multiple myeloma bone marrow niche. Leukemia, 32(8), 1739–1750. 10.1038/s41375-018-0161-6 [DOI] [PubMed] [Google Scholar]
- van Niel, G. , D'Angelo, G. , & Raposo, G. (2018). Shedding light on the cell biology of extracellular vesicles. Nature Reviews Molecular Cell Biology, 19(4), 213–228. 10.1038/nrm.2017.125 [DOI] [PubMed] [Google Scholar]
- Wan, Z. , Gao, X. , Dong, Y. , Zhao, Y. , Chen, X. , Yang, G. , & Liu, L. (2018). Exosome‐mediated cell‐cell communication in tumor progression. American Journal of Cancer Research, 8(9), 1661–1673. [PMC free article] [PubMed] [Google Scholar]
- Wang, J. , Faict, S. , Maes, K. , De Bruyne, E. , Van Valckenborgh, E. , Schots, R. , Vanderkerken, K. , & Menu, E. (2016b). Extracellular vesicle cross‐talk in the bone marrow microenvironment: Implications in multiple myeloma. Oncotarget, 7(25), 38927–38945. 10.18632/oncotarget.7792 [DOI] [PMC free article] [PubMed] [Google Scholar]
- Wang, J. , Hendrix, A. , Hernot, S. , Lemaire, M. , De Bruyne, E. , Van Valckenborgh, E. , Lahoutte, T. , De Wever, O. , Vanderkerken, K. , & Menu, E. (2014). Bone marrow stromal cell‐derived exosomes as communicators in drug resistance in multiple myeloma cells. Blood, 124(4), 555–566. 10.1182/blood-2014-03-562439 [DOI] [PubMed] [Google Scholar]
- Wang, J. , Hong, Y. , Shao, S. , Zhang, K. , & Hong, W. (2018). FFAR1‐and FFAR4‐dependent activation of Hippo pathway mediates DHA‐induced apoptosis of androgen‐independent prostate cancer cells. Biochemical and Biophysical Research Communications, 506(3), 590–596. 10.1016/j.bbrc.2018.10.088 [DOI] [PubMed] [Google Scholar]
- Wang, J. , De Veirman, K. , Faict, S. , Frassanito, M. A. , Ribatti, D. , Vacca, A. , & Menu, E. (2016a). Multiple myeloma exosomes establish a favourable bone marrow microenvironment with enhanced angiogenesis and immunosuppression. Journal of Pathology, 239(2), 162–173. 10.1002/path.4712 [DOI] [PubMed] [Google Scholar]
- Yonezawa, T. , Katoh, K. , & Obara, Y. (2004). Existence of GPR40 functioning in a human breast cancer cell line, MCF‐7. Biochemical and Biophysical Research Communications, 314(3), 805–809. 10.1016/j.bbrc.2003.12.175 [DOI] [PubMed] [Google Scholar]
- Zarfati, M. , Avivi, I. , Brenner, B. , Katz, T. , & Aharon, A. (2019). Extracellular vesicles of multiple myeloma cells utilize the proteasome inhibitor mechanism to moderate endothelial angiogenesis. Angiogenesis, 22(1), 185–196. 10.1007/s10456-018-9649-y [DOI] [PubMed] [Google Scholar]
- Zhang, L. , Pan, L. , Xiang, B. , Zhu, H. , Wu, Y. , Chen, M. , Guan, P. , Zou, X. , Valencia, C. A. , Dong, B. , Li, J. , Xie, L. , Ma, H. , Wang, F. , Dong, T. , Shuai, X. , Niu, T. , & Liu, T. (2016). Potential role of exosome‐associated microRNA panels and in vivo environment to predict drug resistance for patients with multiple myeloma. Oncotarget, 7(21), 30876–30891. 10.18632/oncotarget.9021 [DOI] [PMC free article] [PubMed] [Google Scholar]
Associated Data
This section collects any data citations, data availability statements, or supplementary materials included in this article.
Data Availability Statement
The datasets generated during and/or analyzed during the current study are available from the corresponding author on reasonable request.