

Abstract
Human ILCs are classically categorized into five subsets; cytotoxic CD127−CD94+ NK cells and non‐cytotoxic CD127+CD94−, ILC1s, ILC2s, ILC3s, and LTi cells. Here, we identify a previously unrecognized subset within the CD127+ ILC population, characterized by the expression of the cytotoxic marker CD94. These CD94+ ILCs resemble conventional ILC3s in terms of phenotype, transcriptome, and cytokine production, but are highly cytotoxic. IL‐15 was unable to induce differentiation of CD94+ ILCs toward mature NK cells. Instead, CD94+ ILCs retained RORγt, CD127 and CD200R1 expression and produced IL‐22 in response to IL‐15. Culturing non‐cytotoxic ILC3s with IL‐12 induced upregulation of CD94 and cytotoxic activity, effects that were not observed with IL‐15 stimulation. Thus, human helper ILCs can acquire a cytotoxic program without differentiating into NK cells.
Keywords: IL‐12, IL‐15, innate lymphoid cells, NK cells, tonsil
Cytotoxic CD94+ ILC3s in tonsil are distinct from conventional NK cells. IL‐12, but not IL‐15, is indispensable for their development.

Introduction
Innate Lymphoid Cells (ILCs) protect against infiltrating pathogens, regulate tissue integrity and maintain homeostasis in barrier tissues. ILCs can be categorized into five distinct subpopulations based on their development, transcription factor expression, and cytokine production; Lymphoid tissue inducer (LTi) cells, ILC1s, ILC2s, ILC3s, and NK cells [1]. The latter four are considered the innate equivalents of non‐cytotoxic CD4+ Th1, Th2, Th17/22, and cytotoxic CD8+ T cells, respectively. CD4+ T helper cells with cytotoxic capacities (CD4+ CTL) generated by IL‐2 and antigen stimulation have been described extensively but the ILC equivalent of this CD4+ CTL had not yet been identified in vivo [2, 3, 4, 5, 6].
ILC subsets and NK cells develop from a common innate lymphoid progenitor (CILP). NK cells are thought to arise via an NK cell precursor (NKP), whereas ILC1s, 2s, and 3s are thought to develop via an innate lymphoid cell precursor (ILCP). Helper ILCs are considered non‐cytotoxic, however, it has been reported that human ILC3s can give rise to NK or NK‐like cells in vitro [7, 8, 9, 10, 11, 12, 13]. In addition, intermediate ILC–NK cells have been identified in vivo [9, 10, 12, 14]. Based on these data, it has been proposed that NK cells develop in humans via an ILC3‐like intermediate. However, in patients deficient in the ILC3 lineage determining transcription factor RORγt, ILC3s are absent whereas NK cells are present in normal numbers. Moreover, IL‐7‐deficient patients have normal numbers of NK cells whereas ILC3s are absent [15]. Thus, findings in these immunocompromised patients argue against the notion that ILC3s are an obligatory intermediate cell type in NK cell development. Another possibility is that ILC3s, which are highly plastic and can convert into ILC1s under influence of IL‐12 [16], have also the capacity to convert into NK cells perhaps via ILC1. However, whereas NK cells have been shown to transdifferentiate into ILC1s under influence of TGF‐β, the reversed process, ILC1 to NK cell, has not yet been observed [17, 18]. Investigating the issue whether ILC3s can differentiate into NK cells in vitro, we previously found that the CD117 (c‐Kit)+ stage 3 cell population, which was proposed to form an intermediate in NK cell development, is heterogeneous and consists of a CD127+ and a CD127− population. Using a feeder mix consisting of irradiated PBMC and EBV‐immortalized B cells and PHA we observed that CD127− stage 3 cells were able to differentiate into NK cells whereas CD127+ cells were not [19]. The discrepancy between those findings and the observed in vitro generated ILC3‐derived NK‐like cells prompted us to re‐evaluate and characterize the lineage relationship between NK cells and ILC3s ex vivo and in vitro.
Here we show that a proportion of CD127+ ILCs ex vivo isolated from tonsils are highly cytotoxic, expressed the NK cell marker CD94, but in contrast to NK cells expressed RORγt. Mechanistically, we demonstrate that IL‐12, but not IL‐15, can induce a cytotoxic program marked by CD94 in conventional ILCs in vitro.
Results
ILCs that express CD127 and CD94 resemble ILC3s
To investigate the characteristics of NK cells and ILCs in detail, we examined CD127 and CD94 expression on lineage marker negative (Lin‐) cells. We gated for lymphocytes, excluded doublets and dead cells and selected CD45+CD3− cells (Supporting Information Fig. S1A). Subsequently we gated out non‐relevant lineages using antibodies against CD3, CD4, TCRαβ, and TCRγδ (T cells), CD19 (B cells) CD14 (monocytes) FcRεR1a (mast cells), BDCA2 (pDCs), CD123 (pDCs, basophils), and CD34 (hematopoietic progenitors). We excluded NK‐defining antibodies against CD94, CD56, and CD16 from the lineage cocktail. This protocol enabled us to purify ILC1s, ILC3s, and NK cells using CD127, CD161, and CD94. In tonsils, we identified Lin−CD127−CD94+ NK cells, which were CD161 negative (Fig. 1A). As expected and in contrast to CD127+ ILCs, a proportion of these NK cells express CD16 and killer‐cell Ig‐like receptors (KIRs) (Fig. 1C and D). Within the Lin−CD127+ population, conventional ILCs expressed CD161 but not CD94 and could be subdivided into CD117−NKp44− ILC1s and CD117‐expressing NKp44− ILC3s and NKp44+ ILC3s. Interestingly, a population within the Lin−CD127+CD161+ ILC gate also expressed the NK cell marker CD94 (Fig. 1A). This population (from here on called CD94+ ILCs), which is present in a similar frequency as ILC3s (Fig. 1B), did not express CD16 (Fig. 1C) and KIRs (Fig. 1D). We did not observe expression of CD94 on CRTH2+ ILC2 (Supporting Information Fig. S1B,C). NKp80, which is present on all human NK cells [20], including tonsillar CD16− and CD16+ NK cells, was absent on CD94+ ILCs, conventional ILC1s and ILC3s (Fig. 1E). Conversely, CD200R1, shown to discriminate between ILCs and NK cells in mouse and human [8, 21], was expressed on ILC1s, ILC3s and CD94+ ILCs, but absent on both CD16− and CD16+ NK cells (Fig. 1E). Furthermore, the level of CD127 was comparable to that expressed on conventional ILCs (Fig. 1E). Similar to ILC3s, CD94+ ILCs partly expressed NKp44 and IL‐1R1, and also CD117, CD56, NKG2A, and additionally low levels of NKp46 (Fig. 1F). Hence, we identified a lineage− cell population characterized by the expression of the pan‐ILC markers CD127, CD161, and CD200R1, and the ILC3 related markers CD117, NKp44, and IL‐1R1, but also expressed the NK cell marker CD94 in tonsils. Although NK cells in the tonsil lack CD127, CD56brightCD16− peripheral blood NK cells are known to express intermediate levels of CD127 [22]. Supporting Information Figure S2 confirms that these cells express CD127 although at lower levels than conventional peripheral blood ILCs. However, these CD127dimCD16− NK cells also express NKp80 and lack CD200R1 (Fig. S2B) and are therefore also distinct from tonsillar CD94+ ILC3s.
Figure 1.
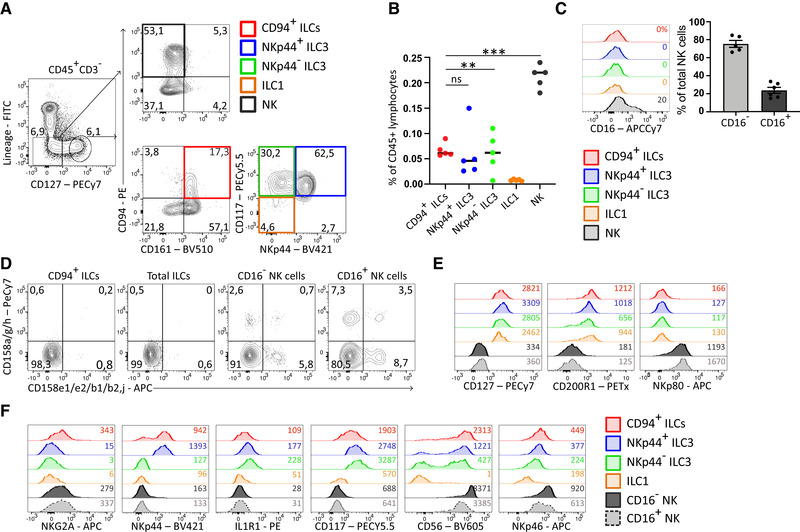
Identification and characterization of tonsillar CD94+ ILCs, conventional ILCs, and NK cells in tonsil. (A) Gating strategy of ILC subsets and NK cells in pediatric tonsil. Total tonsillar cells were depleted for CD3 and CD19 followed by staining with antibodies against lineage (CD1a, CD3, CD4, CD14, CD34, CD19, FcRεR1a, BDCA2, CD123, TCRαβ, TCRγδ, and CRTH2) and ILC/NK related markers as indicated. Cells were gated for lymphocytes, singlets, live CD45+CD3− as indicated in Supportting Information Fig. S1A). Plots are representative of at least 10 donors of at least five experiments. (B) Quantification of indicated subsets as a percentage of total CD45+ tonsillar lymphocytes. For this quantification, total tonsillar cells were not depleted before analysis. Black lines represent mean percentage and each dot represents one donor (N = 5). Data were generated from three independent experiments. **p < 0.01, ***p < 0.0001; ns, not significant (one‐way ANOVA). (C) Representative flow cytometric analysis of CD16 surface expression of indicated ILC and NK subset which are gated for as in (A). Percentage CD16+ is indicated in histograms. Bar graphs shows the mean ± SEM of percentage CD16+ and CD16− NK cells within the total CD127–CD94+ NK cell population. Each dot represents one donor (N = 5) and data were generated from five independent experiments. (D) Representative flow cytometric analysis of the expression of indicated KIRs on indicated ILC and NK cell subset. Plots are representative of at least three donors from at least two independent experiments. (E and F) Representative flow cytometric analysis of indicated ILC and NK cell related surface markers of indicated ILC and NK cell subsets, which were gated for as in (A). MFI are indicated in the plots and plots are representative of at least three donors from at least three independent experiments.
Next we analyzed the transcriptional profile of CD94+ ILCs as compared to bulk NK cells and conventional ILC3s. In line with the results of the flow cytometry analysis, a principal component analysis (PCA) highlighted a unique transcriptional profile of freshly isolated tonsillar CD94+ ILCs, which clustered close to NKp44+ ILC3s but were distinct from NK cells (Fig. 2A). Indeed, hallmark ILC genes were expressed on CD94+ ILCs including RORγt (Fig. 2B, E, and F) but not on NK cells. On the other hand, several genes were shared with NK cells, such as Eomesodermin (EOMES), granzymes, and granulysin (Fig. 2C, E, and F). T‐box transcription factor 21 (TBX21) expression was low in both CD94+ ILCs and ILC3s on transcriptional level but the protein was present in CD94+ ILCs as detected by intracellular staining using an anti‐T‐bet antibody (Fig. 2D, E, and F). In conclusion, tonsillar CD94+ ILCs resemble conventional ILCs but exhibit some cytotoxic features similar to NK cells.
Figure 2.
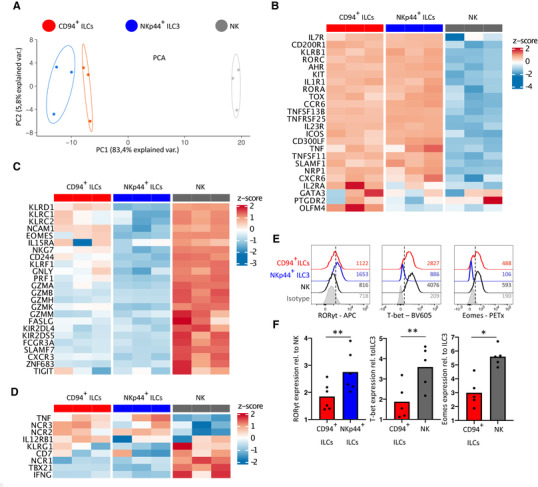
Microarray and flow cytometric analyses show strong similarities between CD94+ ILCs and ILC3s. (A) Principal component analysis (PCA) plot of gene expression as determined by microarray in CD94+ ILCs, NKp44+ ILC3s, and NK cells isolated from tonsil. The most variable genes with an interquartile range above 1.5 were used. N = 3 donors, 5500—10 000 cells from each subset were isolated from each donor. (B) Heatmap of the expression of ILC associated genes in CD94+ ILCs, NKp44+ ILC3s and NK cells of three donors. Expression normalized per gene by z‐score. (C) Heatmap as in (B) of NK‐cell associated genes. (D) Heatmap as in (B) of genes described to be expressed on both ILCs and NK cells. (E) Histograms of intracellular stain for indicated transcription factors in freshly isolated CD94+ ILCs, NKp44+ ILC3s and NK cells and measured by flow cytometry. MFI are indicated in plots and plots are representative of at least 5 donors from at least 3 independent experiments. (Ft) Quantification of intracellular TF expression relative to NK cells (RORγt, N = 6) or ILC3s (T‐bet, Eomes both N = 5). Bars represent mean relative expression and each dot represents one donor. Data were generated from at least 3 independent experiment. All bar graphs were tested for normal distribution using the Shapiro–Wilk test. All bars were normally distributed and tested for significance with a paired t‐test. *p < 0.05, ** p < 0.01, ns; not significant.
CD94+ ILCs mimic ILC3 behavior in response to IL‐15 stimulation
IL‐2 and IL‐15 are essential for NK cell development, function and activation [23]. Activated tonsil NK cells produced copious amounts of IFN‐γ but no IL‐22 in response to IL‐2 and IL‐15. In contrast, CD94+ ILCs produced only low amounts of IFN‐γ under those conditions as compared to NK cells, but showed intracellular expression of the ILC3 hallmark cytokine IL‐22 (Fig. 3A and B). Higher levels of IL‐22 were produced by CD94+ ILCs after stimulation with IL‐2, IL‐23, and IL‐1β, an IL‐22 inducing cocktail for ILC3s, to which NK cells respond by producing high levels of IFN‐γ but not IL‐22. Furthermore, culturing CD94+ ILCs for more than 1 week with IL‐2 and IL‐15 did not affect expression of the ILC markers CD200R1, CD161, CD127, or RORγt and did not result in up‐regulation of one of the NK cell maturation markers CD16 or NKp80 (Fig. 3C and D). Taken together, these data indicate that CD94+ ILCs are distinct from (developing) NK cells.
Figure 3.
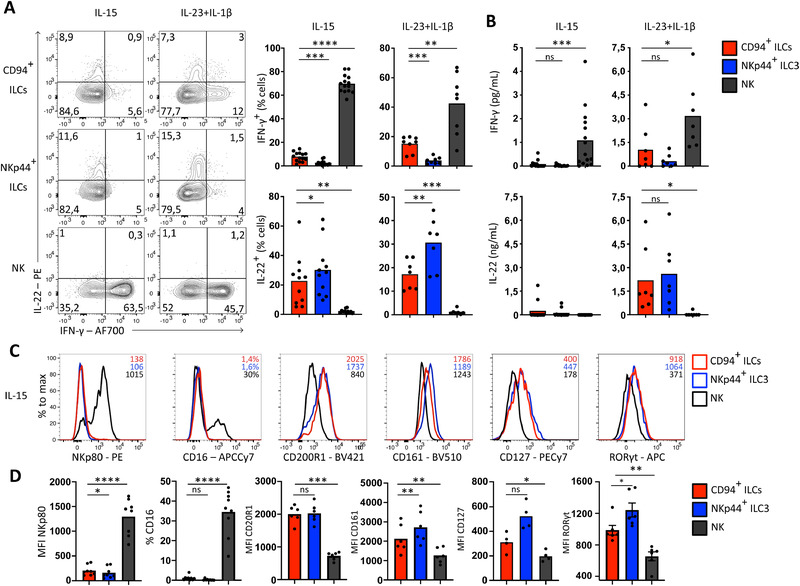
CD94+ ILCs respond similar to ILC3s to cytokine stimulation in vitro. (A) Representative flow cytometric analysis of intracellular IL‐22 and IFN‐γ on sorted CD94+ ILCs, NKp44+ ILC3s and NK cells after 8 days culturing on OP9 cells in the presence of 10 U/ml IL‐2 supplemented with 50 ng/ml IL‐15 (N = 14 for IFN‐ γ, N = 11 for IL‐22) or IL‐23 and IL‐1β (N = 8 for IFN‐γ, N = 7 for IL‐22) and subsequently stimulated with PMA/ionomycin for 3 h. Bar graphs represent mean percentage cytokine expressing cells with each dot represting one donor. Data was generated from at least four independent experiments. (B) Quantification of IFN‐γ (N = 14 after IL‐15 stimulation and N = 7 after IL‐23+IL‐1β stimulation) and IL‐22 production (N = 12 after IL‐15 stimulation and N = 7 after IL‐23+IL‐1β stimulation) by ELISA in culture supernatant from cells stimulated as in (A). Measured concentrations are normalized to 5000 cells. Bar graphs represent mean and each dot represents one donor. Data were generated from at least four independent experiments. (C) Representative flow cytometric analysis of indicated ILC and NK cell related surface markers or transcription factor after 8‐day culture on OP9 feeder cells in the presence of IL‐2 (10 U/mL) and IL‐15 (50 ng/mL). MFI or, if indicated, percentage positive cells, is shown in histograms. Data are representative of four to nine donors from at least three independent experiments. (D) Quantification of the expression of indicated surface markers and TF displayed by MFI or percentage positive cells. Bar graphs represent mean and each dot represents one donor (CD127 N = 4, CD200R1, CD161, RORγt N = 6, CD16 N = 9) and was generated from at least 3 independent experiments. All bar graphs were tested for normal distribution using the Shapiro–Wilk test. All bars were normally distributed and tested for significance with a paired t‐test. *p < 0.05, **p < 0.01, ***p < 0,001, ****p < 0.0001; ns, not significant
CD94+ ILC subsets are similar to conventional ILC1s and ILC3s
Similar to conventional ILCs, the CD94+ ILC population could be subdivided into CD117−NKp44− ILC1s, CD117+ NKp44− ILC3s, and CD117+NKp44+ ILC3s, whereas NK cells were mainly CD117−NKp44− (Fig. 4A). Like conventional ILC3s, the CD94‐expressing ILC3s expressed transcripts for RORC, AHR, IL1R1, and IL22, and they expressed low levels of TBX21 (encoding for T‐bet), and IFNG (Fig. 4B). CD94+ NKp44− ILC3s expressed some EOMES, GZMB, and PRF1, in contrast to conventional NKp44− ILC3s. Highest levels of EOMES, TBX21, PRF1, GZMB, and IFNG were found in CD94+ ILC1s and NK cells (Fig. 4B).
Figure 4.
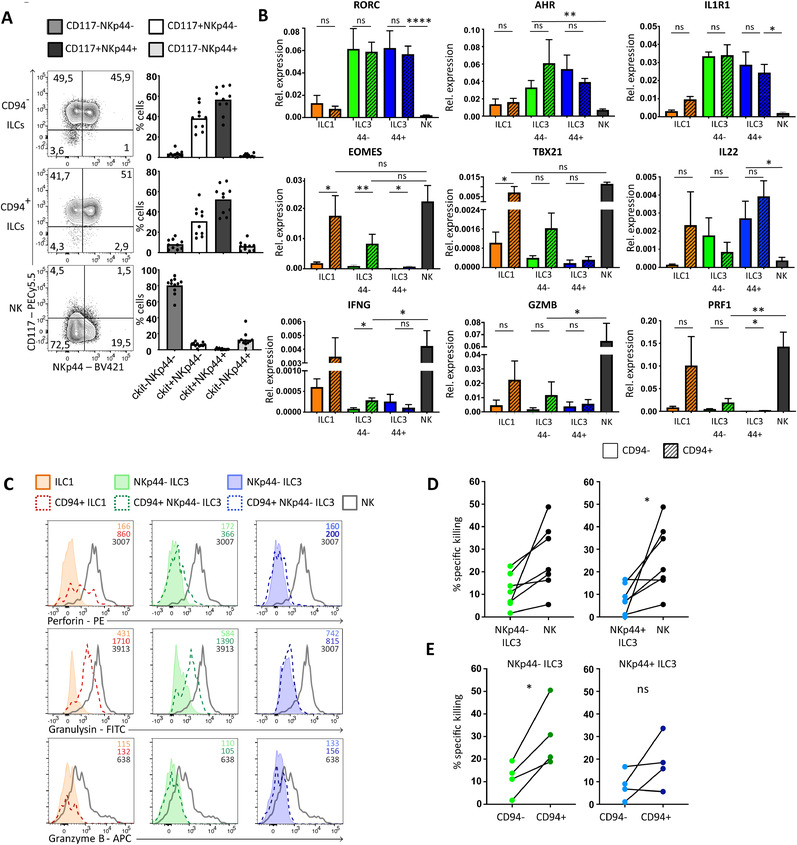
CD94+ ILC subsets mirror conventional ILC subsets and CD117+NKp44− CD94+ ILCs are cytotoxic. (A) Representative flow cytometric analysis of surface expression of NKp44 and CD117 of indicated populations. Bar graphs show quantification of mean percentage ± SEM of cells in each indicated quadrant. Each dot in the bar graphs represents one donor (N = 10) and data was generated from at least 5 independent experiments. (B) Quantification of relative mRNA expression by RT‐qPCR and compared to β‐actin of indicated genes in indicated ILC subsets freshly isolated from tonsil. Bar graphs represent mean ± SEM of 3–5 donors (N = 3–5) from at least two independent experiments, except for IL22 that represents two to three donors (N = 2–3). (C) Representative flow cytometric analysis of intracellular perforin, granzyme B, and granulysin in indicated ILC subsets and NK cells, which were directly stained after sorting indicated subsets. MFI is indicated in histograms. Data represent three donors from two independent experiments. (D‐E) Graph showing the specific killing of K562 cells after co‐culture with NKp44− ILC3s, NKp44+ ILC3s, NK cells, CD94+NKp44− ILCs or CD94+NKp44+ ILC3s at an effector: target ratio of 8:1. Each dot represents 1 or 2 donors pooled and connected dots are the same donor. N = 7 in (D), N = 4 in (E). Percentage specific killing was calculated as 100‐((live cells in well/live cells control well)*100). Data were generated from at least 3 independent experiments. All data were tested for normal distribution using the Shapiro–Wilk test. All data were normally distributed and tested with paired t‐test. *p < 0.05, **p < 0.01, ***p < 0.001, ****p < 0.0001.
In conclusion, CD94 marks a subset of ILC1s and ILC3s that express genes involved in cytotoxicity.
NKp44−CD94+ ILCs are cytotoxic
The expression of NK cell‐related genes in NKp44−CD94+ ILCs raised the question whether these cells functionally resemble NK cells in terms of their cytotoxic capacities. Intracellular staining directly following isolation showed clear perforin and granulysin protein expression in CD94+ ILC1 and, although less, in CD94+NKp44− ILC3s, but not in CD94+NKp44+ ILC3s and conventional CD94− ILC subsets (Fig. 4C). The level of granulysin and perforin expression was lower compared to conventional NK cells. None of the CD94− or CD94+ ILC subsets expressed intracellular granzyme B measured directly following isolation, whereas freshly isolated NK cells showed clear granzyme B expression. However, CD94+ ILCs do have the capacity to express granzyme B following activation in vitro (Supporting Information Fig. S3A). Freshly isolated total CD94+ ILCs are as cytotoxic for K562 cells as NK cells, whereas conventional ILC3s were substantially less cytotoxic (Supporting Information Fig. S3 and Fig. 4D). In line with their expression of cytotoxic molecules (Fig. 4B and C), CD94+NKp44− ILC3s were much more cytotoxic than CD94−NKp44− ILC3s (Fig. 4E). CD94+NKp44+ ILCs induced less target cell death compared to CD94+NKp44− ILCs. The higher cytotoxic activity of CD94+NKp44− ILC3s compared to CD94+NKp44+ ILC3s coincides with higher expression levels of cytotoxic molecules (Fig. 4C). Although expression of granulysin and perforin in freshly isolated CD94+ ILC1s strongly suggest that these cells are cytotoxic as well, the rarity of these cells prevented us from isolating enough CD94+ ILC1s to directly assess cytotoxic activity against K562.
IL‐12 induced CD94 and a cytotoxic program in CD94− ILC3s
Previously, we demonstrated that both ILC2s and ILC3s transdifferentiated towards IFN‐γ‐producing ILC1s following exposure to IL‐12, which was enhanced in the presence of IL‐1β or IL‐18 [16, 24, 25]. Here, we show that up to 50% of ILC1s and both ILC3 subsets acquired CD94 surface expression in the presence of OP9 mouse stromal cells as feeders, IL‐2 as a survival signal and inflammatory IL‐12 (Fig. 5A). These in vitro generated CD94+ ILCs, gated for as in Supporting Information Fig. S4A, under influence of IL‐12 still expressed CD200R1 (Fig. 5B) and CD161 (Supporting Information Fig. S4B), but acquired expression of Eomes (Fig. 5C) and produced IFN‐γ and Granzyme B (Supporting Information Fig. S4C,D). The NK cell markers NKp80 and CD16 were not upregulated upon in vitro acquisition of CD94 (Supporting Information Fig. S4E,F), indicating that ILCs do not develop into (mature) NK cells under these conditions. In contrast to IL‐12, IL‐15, a major regulator of NK cell development, failed to upregulate CD94 and Eomes in conventional ILCs (Fig. 5A and C), but instead retained RORγt expression (Fig. 3C).
Figure 5.
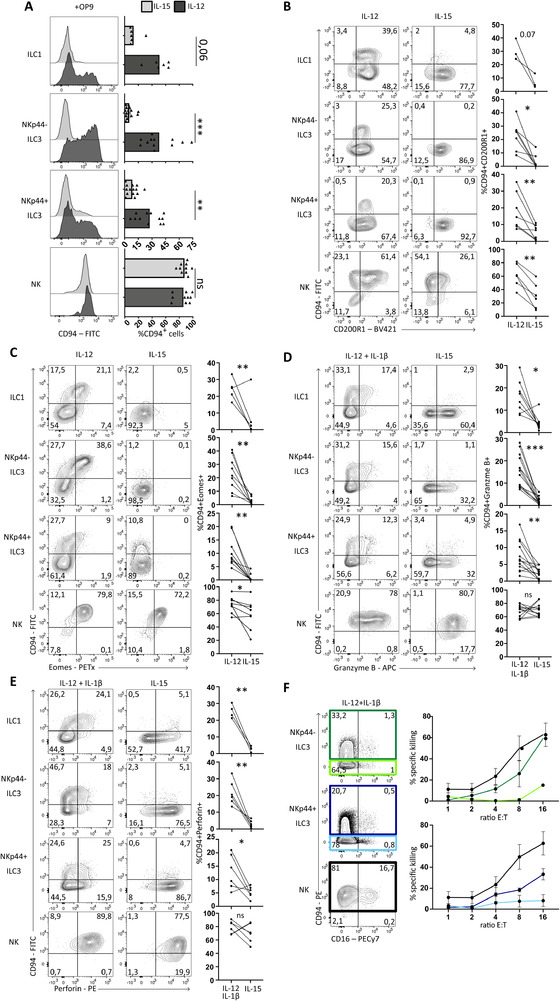
IL‐12, but not IL‐15, induces cytotoxicity in conventional ILCs. (A) Representative flow cytometric analysis of surface expression of CD94 of indicated populations after culturing for 7 days on OP9 with IL‐2 (10 U/ml) supplemented with IL‐15 or IL‐12 (both 50 ng/ml). Gating strategy as in Fig. S4A was applied to select for ILCs / NK cells. Bar graphs show quantification of percentage of CD94+ cells, each dot represents one donor (ILC1 N = 6, NKp44− and NKp44+ ILC3 N = 12, NK N = 10). Data was generated from at least 4 independent experiments. (B‐E) Representative flow cytometric analysis of the expression of indicated surface markers or intracellular stained transcription factors or cytokines after culturing as in A. Cytokines were measured after an additional 3 hours PMA/ionomycin stimulation. Gating strategy as in Fig. S4A was applied to select for ILCs / NK cells. Percentages in double positive upper right gates are quantified on the right side of the plots. Each dot represents one donor and connected lines are the same donor. In (B) ILC1 N = 3, ILC3 N = 7, NK N = 6. In (C) ILC1 N = 5, ILC3 N = 9, NK N = 7. In (D) ILC1 N = 8, ILC3 N = 13, NK N = 12. In (E) ILC1 N = 4, ILC3 and NK N = 6. Data are generated from at least three independent experiments. (F). Representative flow cytometric analysis of surface expression of CD94 and CD16 of indicated populations after culture on OP9 for 7 days with IL‐2 (10 U/ml) with IL‐12 and IL‐1β (50 ng/ml). (Light) green, (light) blue, and black squares indicate which populations were resorted and used for the killing assay depicted on the right showing the mean percentage ± SEM of specific killing of K562 cells after co‐culture with indicated ILC subsets or NK cells at indicated an effector‐target ratio. Percentage of specific killing was calculated as 100‐((live cells in well/live cells control well)*100). Each dot represents two to three donors (N = 2‐3) from two independent experiments. All data were tested for normal distribution using the Shapiro‐Wilk test. All data were normally distributed and tested with paired t‐test. *p < 0.05, **p<0,01, ***p < 0.001, ****p < 0.0001.
Next, we assessed the cytolytic potential of in vitro generated CD94+ ILC3s in comparison to ILC3s that remained CD94− and conventional NK cells after culture with IL‐2, IL‐12, and IL‐1β. Addition of IL‐1β did not alter the acquisition of CD94, but increased expansion of the culture. Together with upregulation of CD94, we observed induction of cytotoxic molecules granzyme B and perforin (Fig. 5D and E). In line with this, in vitro generated CD94+ ILCs were superior in their lytic potential as compared to their CD94− counterparts, like freshly isolated CD94+ ILCs (Fig. 5F). Thus, NKp44− and NKp44+ ILC3s can acquire a cytotoxic CD94+ ILC phenotype under the influence of IL‐2 and IL‐12. Despite the absence of CD94, Eomes and other NK cell associated features, high levels of Granzyme B and Perforin were found by intracellular stain upon culturing of ILC3s with IL‐15 (Fig. 5D and E). Interestingly, in a cellular killing assay comparing NK cells and ILC3s after culture with IL‐15, no clear cytotoxic activity was observed in NKp44+ ILC3s (Supporting information Fig. S5). This suggests that the sole induction of granzyme B and perforin upon IL‐15 stimulation was not sufficient to exert high cytotoxicity against K562 cells.
To exclude that IL‐12‐mediated induction of CD94 and cytotoxic capacities in NKp44‐ILC3s is due to expansion of a small contaminating population, we performed cloning experiments. Single cells were sorted using flow cytometry and cultured on OP9 cells in the presence of IL‐2, IL‐12, and IL‐1β. We observed that 60–70% of the expanded clones had acquired CD94 (Fig. 6A). Of those CD94 expressing clones the vast majority also upregulated Eomes and T‐bet. Importantly they retained expression of the ILC marker CD200R1 but did not upregulate the NK marker NKp80 (Fig. 6A and B). We also observed that some CD94+ clones did not upregulate T‐bet or Eomes and some other clones contained a low proportion (<7%) of NKp80low cells. Consistent with previous published data [16, 24], CD94−T‐bet+CD200R1+Eomes−, which have an ILC1 phenotype were also observed (Supporting Information Fig. S6A and B). Clones that were highly expanded were analyzed for their cytokine production. The majority of the CD94+ clones derived from both NKp44− and NKp44+ ILC3s produced IFN‐γ and granzyme B (Fig. 6C and D). These data confirm our observation that IL‐12 induced CD94 expression and cytotoxic capacities in ILC3 and was not due to selective outgrowth of a small contaminating CD94+ ILC3 population.
Figure 6.
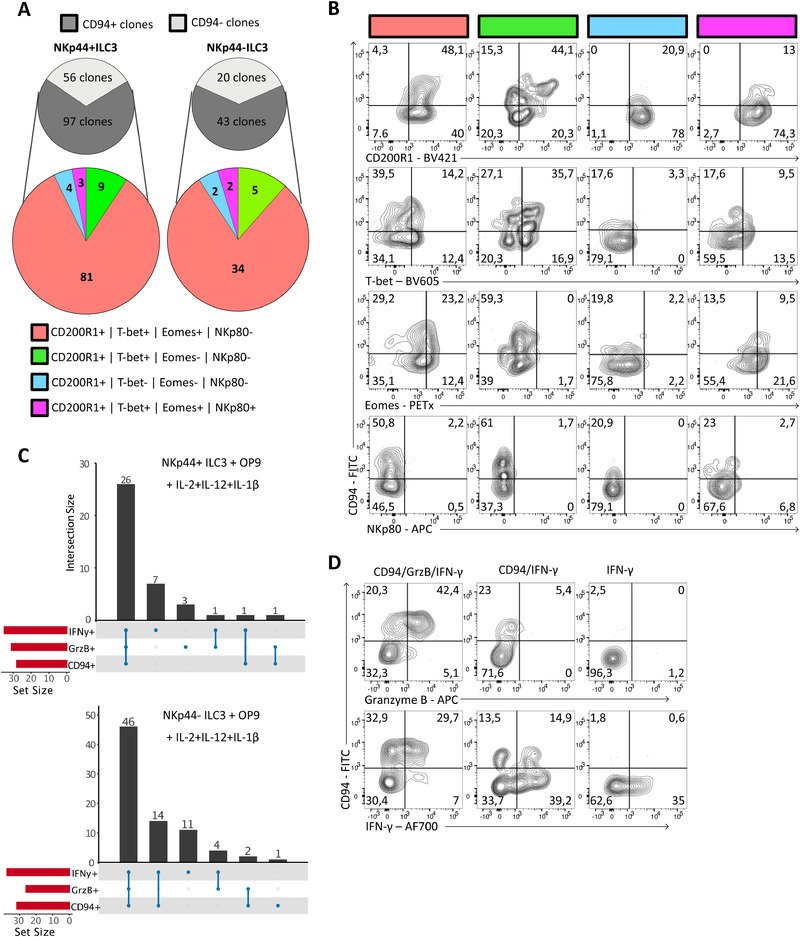
Single NKp44− and NKp44+ ILC3s give rise to cytotoxic CD94+ ILCs. (A‐D) Single NKp44+ ILC3s or NKp44− ILC3s were sorted by FACS into 96‐well round‐bottom plates pre‐seeded with OP9 and stimulated with IL‐2 (20 U/ml), IL‐12, and IL‐1β (20 ng/mL) for 2–3 weeks. Clones were analyzed only if >80 CD45+ cells. Gating strategy as shown in Supporting Information Fig. S4A was applied to select for ILCs. (A) Grey pie charts quantifying the number of CD94+ and CD94− clones derived from conventional CD94−NKp44+ ILC3s and CD94−NKp44− ILC3s after culture. Colored pie charts show expression of combinations of CD200R1, T‐bet, Eomes and NKp80 within the CD94+ clones. (B) Representative flow cytometric analysis of subgroups displayed in colored pie chart of A. (C) Clones that were sufficiently expanded were stimulated with PMA/ionomycin for 3 h, stained intracellular for granzyme B and IFN‐γ and measured by flow cytometry. Bar graphs show numbers and type of cytokines produced by clones. (D) Representative flow cytometric analysis of combinations of CD94, IFN‐γ, and granzyme B expressing clones, which were quantified in (C). The clones were generated from four different donors in two independent experiments.
Discussion
We identified human cytotoxic CD94+ ILCs that are characterized by the expression of the ILC markers CD127, CD161, and CD200R1, and absence of mature NK cell markers NKp80 and CD16. CD94/NKG2A co‐expression in CD127+ ILCs has been observed by several studies [10, 14, 26, 27, 28, 29] but in depth characterization of these cells in fresh tissue and their developmental requirements was thus far not performed. We found that CD94+ ILCs expressed transcripts and proteins associated with cytotoxic cells, including EOMES and effector molecules granzyme B and granulysin. Whereas IL‐15 was unable to induce differentiation of CD94+ ILCs into NK cells it induced the ILC3 hallmark cytokine IL‐22 in CD94+ ILCs as was previously observed with conventional CD94− ILC3s [30], but not in NK cells. We used CD200R1 and NKp80 to further differentiate CD94+ ILCs from NK cells. NKp80 was previously described to be expressed on virtually all fresh and activated NK cells in peripheral blood [20], whereas CD200R1 was described to distinguish ILC1s from NK cells in different mouse tissues [21]. We extended those data showing that in human peripheral blood all ILCs express CD200R1 [8]. Our data reveal that also in tonsil, ILC1s, ILC3s, and CD94+ ILCs express CD200R1 while neither CD16+ nor the presumable more immature CD16− NK cells do not. In contrast, NKp80 is expressed on CD16+ and CD16− NK cells but not on ILC1s, ILC3s, and CD94+ ILCs. In the tonsil ILCs and NK cells differ in expression of CD127 but part of the CD16‐ NK cells in peripheral blood do express CD127, although at levels lower than on ILCs. These peripheral blood CD127dimCD16− NK cells do express NKp80 and lack CD200R1 and therefore also these peripheral blood NK cells are distinct from CD94+ ILCs. These data together indicate that cytotoxic CD94+ ILCs belong to the ILC lineage and not to the NK cell lineage.
We could further dissect the CD94+ ILCs in three subsets with similar phenotypes as ILC1 and ILC3; CD94+NKp44+ ILC3s, CD94+NKp44− ILC3s, both characterized by the expression of CD117, and CD94+ ILC1s, characterized by the absence of NKp44 and CD117. CD94+NKp44− ILC3s were superior in their cytotoxic capacities compared to CD94+NKp44+ ILC3s. CD94+ ILC1s could not be analyzed for their cytotoxic capacities because of limited cell numbers. However, the higher expression of transcripts for cytotoxic molecules and intracellular granulysin protein suggest that they have a higher cytotoxic capacity than CD94+ ILC3s. Recently, single cell RNA sequencing of tonsillar ILCs revealed a cell type with similarities to CD94+ ILCs [14]. Those cells, which were proposed to be transitional between ILC3 and ILC1 based on RNA velocity analysis, expressed transcripts of cytotoxic molecules suggesting they were cytotoxic. However, these researchers did not isolate and characterize these transitional cells to verify their phenotypes and functions [14]. Our analysis demonstrates that ex vivo isolated CD94+ ILCs display cytotoxic activity but are distinct from NK cells.
Investigating the origin of cytotoxic CD94+ ILCs we observed that these cells can arise from conventional non‐cytotoxic ILC3s following incubation with IL‐12 but not by IL‐15 in vitro. This finding is in line with observations of other researchers who reported that ILC3s from human tonsil could differentiate toward NK‐like cells with cytotoxic capacities under the influence of IL‐12. However, these researchers also reported that ILC3 can become Eomes+CD94+ cytotoxic following culture with IL‐15 in vitro, which contrasts with our findings [13]. The reasons for this discrepancy are unknown. Despite the lack of CD94 and Eomes upregulation in ILC3 upon IL‐15 culture, we did observe intracellular staining for perforin and granzyme B. However, only very low cytotoxic activity against target cells was found, suggesting that sole upregulation of cytotoxic molecules is not sufficient to induce the ability to kill target cells. Why the presence of perforin and granzyme is not sufficient for killing activity is unclear. It might be possible that perforin and granzyme B are not present in granules within these cells or, alternatively, granules containing these molecules are not secreted by the IL‐15‐stimulated ILC3s in the presence of K562. Thus, together our data indicates that ILCs can promptly respond to local IL‐12 but not to IL‐15 to gain cytotoxic functions.
Our observation that IL‐15 fails to induce differentiation of CD94+ ILCs into mature NK cells contrasts with earlier observations of Freud and collaborators on the basis of which it was proposed that ILC3s are precursors of NK cells. These researchers identified a Lin‐CD94+NKp80−CD16− population which represented an intermediate stage in NK cell development and were called stage 4a NK cells. These stage 4a cells were reported to be similar to ILC3s and able to develop into mature NK cells expressing NKp80 and CD16 [10]. These stage 4a cells express CD94 and are similar to the cells we describe here but in contrast to our cells, which are CD127+, they are heterogeneous in the expression of CD127 and contain CD127−/dim cells. Because CD127+ ILCs failed to upregulate mature NK cell markers in our cultures, it is likely that the NK cells are derived from the CD127−/dim portion of the mixed stage 4a population. However, we cannot completely exclude that in vivo the ILC3s could upregulate mature NK cell markers. On the other hand, both RORγt−/− and IL‐7R−/− patients have normal levels of NK cells, but lack ILC3s and would thus also lack RORγt+CD127+CD94+ ILCs [15]. These observations, also made in mice, make it highly unlikely that ILC3s and CD94+ ILCs are NK cells precursors.
The identification of cytotoxic ILCs raises the question what the function of these cells could be. Even though NK cell related genes were expressed on a lower level and not all NK cell related genes were expressed in CD94+ ILCs, their killing efficiency is similar to NK cells. Interestingly, KIR expression was absent on freshly isolated CD94+ ILCs, suggesting that killing is most likely regulated through CD94 itself. Since some viruses, (e.g., influenza, Epstein–Barr, and human Cytomegalovirus) have evolved specific NK cell evasion mechanisms by promoting engagement of inhibitory KIRs and thereby inactivating NK cells, the existence of these CD94+ ILCs could be an evolutionary adaptation [31]. Given that CD94+ ILCs do not express KIRs, and thus no inhibitory KIRs, they should be resistant to this type of viral immune mediated evasion and their cytotoxicity may be crucial in protection against such viruses. Thus, it is possible that cytotoxic ILCs are involved in antiviral immunity. Interestingly HIV infection results in depletion of peripheral blood ILCs [32], which are mostly immature [7, 8], whereas ILCs are retained in the tonsils and gut. It would be of interest to analyze the characteristics of CD94+ ILCs in viral infections. Co‐expression of CD94 and CD127 was reported absent in human fetal intestine [33], suggesting that the development of CD94+ ILCs is microbiota dependent. The constitutive expression of granulysin in the CD94+ ILC subsets may suggest that these cells are specialized in eradicating pathogenic bacteria as this toxin has bactericidal activities [34]. It will be of interest to analyze expression and function of granulysin in ILCs located at barrier surfaces like gut, airways, and skin as pathogenic bacteria enter at those locations.
The cytotoxic ILCs described here are reminiscent of cytotoxic CD4+ T cells [2]. Like non‐cytotoxic ILCs, CD4+ T cells also have the capacity to up‐regulate a cytotoxic machinery, which occurs primarily during chronic viral infections [3, 4, 5, 6, 35, 36]. Similar to ILCs, CD4+ cytotoxic T Lymphocytes (CTLs) are characterized by the expression of CD94 and Eomes and produce IFN‐γ and cytolytic granules [37]. In contrast to IL‐12 driven cytotoxicity in ILCs, CD4+ CTLs are induced by IL‐2 and low doses of antigen [38, 39], suggesting that the mechanisms of induction of the cytotoxic machinery in CD4+ T cells and ILCs are different.
We conclude that both innate and adaptive “helper” non‐cytotoxic lymphocytes have the capacity to gain cytotoxicity under the influence of environmental cues.
Materials and methods
Isolation of ILCs and NK cells from tonsil and blood
Human pediatrics tonsils were collected with approval of tissue‐specific protocols by the Medical Ethical Committee of the Amsterdam UMC, Amsterdam. Tonsils were obtained from pediatric tonsillectomies performing within the Amsterdam UMC or Onze Lieve Vrouwe Gasthuis hospital (Amsterdam, The Netherlands). Informed consent was obtained from patients whose tonsils were used in this study after the nature and possible consequences were explained. Buffy coats were provided by the blood bank (Sanquin, Amsterdam). PBMCs were isolated by Ficoll‐Hypaque density gradient (Lymphoprep; Axis‐Shield). Tonsils were processed to obtain cell suspensions as described before [40]. For ILC enrichment, tonsil cell suspensions were depleted for CD3 and CD19 by MACS depletion and PBMC were depleted for CD3, CD14, and CD19 using MojoSort magnetic cell separation system (BioLegend, San Diego, CA, USA). Obtained (depleted) cell suspensions were stained for 30 min at 4°C with fluorochrome‐conjugated antibodies (Supporting Information Table S1). The cells were purified by flow cytometry using a FACSAria IIU (BD Biosciences).
Flow cytometry analysis
For flow cytometry, we adhered to the Guidelines for the use of flow cytometry and cell sorting in immunological studies [41]. After culture, cells were analyzed by surface staining and intracellular transcription factor or intracellular cytokine staining. For experiments involving intracellular cytokine staining, cells were stimulated with PMA (10 ng/ml; Sigma) plus Ionomycin (500 nM; Merck) for 6 h, with the last 2 h in the presence of Golgi Plug (555029; BD). For FACS analysis, cells were washed and stained for surface antigen staining and fixable viability dye eFluor455UV (65‐0868‐14; eBioscience) for 30 min at 4°C in PBS. Then cells were washed and fixed using 4% paraformaldehyde for 10 min, followed by permeabilization using the Foxp3/Transcription factor staining buffer kit (ThermoFisher Scientific). Samples were subsequently stained with intracellular cytokine/transcription factor antibodies for 30 min at room temperature in permeabilization buffer. Samples were acquired on the LSRFortessa or FACSCanto II (BD Biosciences) and analyzed using FlowJo software (FlowJo LLC, Ashland, OR).
ILC/NK cell bulk and single cell co‐culture with OP9 cells
Naïve OP9 murine stromal cells were kindly provided by Dr. T. Nakano (Osaka University, Osaka, Japan). For co‐cultures with ILCs or NK cells, 3000 OP9 cells were plated one day prior to co‐culture per well in a 96‐well round bottom plate in Yssel's medium (IMDM + 4% (v/v) Yssel's supplement (made in house, Amsterdam UMC) + 2% (v/v) human AB serum (Invitrogen)). For bulk cultures (1000‐5000 ILCs per condition), ILCs or NK cells were cultured with OP9 cells for 7–9 days with IL‐2 (10 U/ml) with combinations of IL‐12, IL‐1β, IL‐15 and IL‐23 (all 50 ng/ml) and cytokines were supplemented at day 3 and 6. In single cell cloning, IL‐2 (20 U/ml), IL‐12 and IL‐1β (20 ng/ml) and medium were refreshed weekly and samples were analyzed after 2–3 weeks.
Cytokine secretion analysis
Supernatants were collected after culturing and analyzed for the presence of IFN‐γ or IL‐22 (eBioscience) by Enzyme‐Linked Immunosorbent Assay (ELISA) according to the manufacturer's protocol.
Killing assay
Ex vivo isolated or resorted ILCs/NK cells were rested o/n in Yssel's medium with IL‐2. Then ILCs were co‐cultured with 2000 Calcein AM (Biolegend) stained K562 cells per well, at indicated ratios for 6 h. DAPI was added and cells were acquired on the FACSCanto II (BD Biosciences) and analyzed using FlowJo software (FlowJo LLC, Ashland, OR). Percentage of specific killing was calculated as 100%‐((live K562 in sample/live K562 in control)*100).
Quantitative real‐time PCR
Sorted cell populations were lysed and RNA was isolated using the NucleoSpin RNA XS kit (Macherey‐Nagel) according to the manufacturer's protocol. Complementary DNA was synthesized using the High Capacity Archive kit (Applied Biosystems). PCR was performed with a LightCycler 480 Instrument II (Roche) with SYBR Green I master mix (Roche). Primers sets that were used are listed in Table S2 Analysis of expression was performed with Bio‐Rad CFX Manager 3.1 software and normalized to the expression of β‐actin.
Microarray analysis
Sorted cell populations were snap frozen in PBS directly after sorting and stored at –80°C until RNA extraction. QIAzol Lysis Reagent (Qiagen) was added to the cells, and RNA was isolated and purified using the RNeasy kit (Qiagen). The RNA concentration was measured on a NanoDrop ND‐2000 (Thermo Scientific) and the RNA integrity was determined using the 2200 TapeStation System with Agilent RNA ScreenTapes (Agilent Technologies). Total RNA was amplified using the GeneChip WTF Pico Kit (Thermo Fisher Scientific), generating biotinylated sense‐strand DNA targets. The labeled samples were hybridized to human Clariom S pico arrays (Thermo Fisher Scientific). Washing and staining was performed by the GeneChip Fluidics Station 450 and the scanning was performed using the GeneChip Scanner 3000 (both Thermo Fisher Scientific). All cell populations were generated in triplicate. All data analysis was performed in RStudio. Raw data were normalized sing the RMA algorithm implemented in the limma Bioconductor R‐Package [42]. Adjusted P‐values were calculated using the Benjamin‐Hochberg method. Data were visualized using glimma and complex heatmap R‐packages [43]. The following packages were used in the analysis pipeline: oligo, limma, affycoretools, clariomshumantranscriptcluster.db, GO.db, Glimma, biobroom, ComplexHeatmap, pathfindR, ggbiplot, tidyverse [42, 43, 44, 45, 46, 47, 48].
Author contributions
L.K. designed the study, performed experiments, analyzed data, and wrote the manuscript. B.A.H. analyzed data and edited the manuscript. C.M.K. performed experiments and analyzed data. H.S. designed and directed the study and edited the manuscript. J.H.B. designed and directed the study and edited the manuscript.
Conflict of Interest
L.K., B.A.H., C.K., and J.H.B. have no commercial or financial competing interests. HS consults for GSK, UniQure, and AIMM Therapeutics.
Peer review
The peer review history for this article is available at https://publons.com/publon/10.1002/eji.202048696.
Abbreviations
- Eomes
eomesodermin
- ILCs
innate lymphoid cells
- Lin
lineage
- RORγt
RAR‐related orphan receptor gamma
- TBX21
T‐box transcription factor 21
Supporting information
Supporting information
Acknowledgements
We thank B. Hooibrink, T.M.M. van Capel and K.I.M Brandwijk for help with flow cytometry. We thank Onze Lieve Vrouw Gasthuis, Amsterdam, the Netherlands for providing tonsils. This work is supported by the European Research Council (Advanced grant 341038 to H. Spits). B.A. Heesters is supported by a Veni fellowship (91618032) of the NWO (Netherlands Organization for Sciences). J.H. Bernink is supported by a ZonMw Veni fellowship (09.150.161.810.107) and a Dutch Lung Fund grant 4.2.18.237JO.
Contributor Information
Hergen Spits, Email: hergen.spits@amsterdamumc.nl.
Jochem H Bernink, Email: j.bernink@hubrecht.eu.
Data availability statement
Microarray GEO (Gene Expression Omnibus): GSE147231.
References
- 1. Vivier, E. , Artis, D. , Colonna, M. , Diefenbach, A. , Di Santo, J. P. , Eberl, G. , Koyasu, S. et al., Innate lymphoid cells: 10 years on. Cell. 2018, 174 [DOI] [PubMed] [Google Scholar]
- 2. Spits, H. , Ijssel, H. , Thompson, A. and de Vries, J. E. , Human T4+ and T8+ cytotoxic T lymphocyte clones directed at products of different class II major histocompatibility complex loci. J. Immunol. 1983. 131. [PubMed] [Google Scholar]
- 3. van Leeuwen, E. M. , Remmerswaal, E. B. , Vossen, M. T. , Rowshani, A. T. , Wertheim‐van Dillen, P. M. , van Lier, R. A. and ten Berge, I. J. , Emergence of a CD4+CD28‐ granzyme B+, cytomegalovirus‐specific T cell subset after recovery of primary cytomegalovirus infection. J. Immunol. 2004. 173. 10.4049/jimmunol.173.3.1834. [DOI] [PubMed] [Google Scholar]
- 4. Zaunders, J. J. , Dyer, W. B. , Wang, B. , Munier, M. L. , Miranda‐Saksena, M. , Newton, R. , Moore, J. et al., Identification of circulating antigen‐specific CD4+ T lymphocytes with a CCR5+, cytotoxic phenotype in an HIV‐1 long‐term nonprogressor and in CMV infection. Blood. 2004. 103. 10.1182/blood-2003-08-2765. [DOI] [PubMed] [Google Scholar]
- 5. Appay, V. , Zaunders, J. J. , Papagno, L. , Sutton, J. , Jaramillo, A. , Waters, A. , Easterbrook, P. et al., Characterization of CD4(+) CTLs ex vivo. J. Immunol. 2002. 168. 10.4049/jimmunol.168.11.5954. [DOI] [PubMed] [Google Scholar]
- 6. Aslan, N. , Yurdaydin, C. , Wiegand, J. , Greten, T. , Ciner, A. , Meyer, M. F. , Heiken, H. et al., Cytotoxic CD4 T cells in viral hepatitis. J Viral Hepat. 2006. 13. 10.1111/j.1365-2893.2006.00723.x. [DOI] [PubMed] [Google Scholar]
- 7. Lim, A. I. , Li, Y. , Lopez‐Lastra, S. , Stadhouders, R. , Paul, F. , Casrouge, A. , Serafini, N. et al., Systemic Human ILC Precursors Provide a Substrate for Tissue ILC Differentiation. Cell. 2017. 168. 10.1016/j.cell.2017.02.021. [DOI] [PubMed] [Google Scholar]
- 8. Nagasawa, M. , Heesters, B. A. , Kradolfer, C. M. A. , Krabbendam, L. , Martinez‐Gonzalez, I. , de Bruijn, M. J. W. , Golebski, K. et al., KLRG1 and NKp46 discriminate subpopulations of human CD117(+)CRTH2(‐) ILCs biased toward ILC2 or ILC3. J. Exp. Med. 2019. 216. 10.1084/jem.20190490. [DOI] [PMC free article] [PubMed] [Google Scholar]
- 9. Hughes, T. , Briercheck, E. L. , Freud, A. G. , Trotta, R. , McClory, S. , Scoville, S. D. , Keller, K. et al., The transcription Factor AHR prevents the differentiation of a stage 3 innate lymphoid cell subset to natural killer cells. Cell Rep. 2014. 8. 10.1016/j.celrep.2014.05.042. [DOI] [PMC free article] [PubMed] [Google Scholar]
- 10. Freud, A. G. , Keller, K. A. , Scoville, S. D. , Mundy‐Bosse, B. L. , Cheng, S. , Youssef, Y. , Hughes, T. et al., NKp80 Defines a Critical Step during Human Natural Killer Cell Development. Cell Rep. 2016. 16. 10.1016/j.celrep.2016.05.095. [DOI] [PMC free article] [PubMed] [Google Scholar]
- 11. Chen, L. , Youssef, Y. , Robinson, C. , Ernst, G. F. , Carson, M. Y. , Young, K. A. , Scoville, S. D. et al., CD56 Expression Marks Human Group 2 Innate Lymphoid Cell Divergence from a Shared NK Cell and Group 3 Innate Lymphoid Cell Developmental Pathway. Immunity. 2018. 49. 10.1016/j.immuni.2018.08.010. [DOI] [PMC free article] [PubMed] [Google Scholar]
- 12. Scoville, S. D. , Mundy‐Bosse, B. L. , Zhang, M. H. , Chen, L. , Zhang, X. , Keller, K. A. , Hughes, T. et al., A Progenitor Cell Expressing Transcription Factor RORgammat Generates All Human Innate Lymphoid Cell Subsets. Immunity. 2016. 44. 10.1016/j.immuni.2016.04.007. [DOI] [PMC free article] [PubMed] [Google Scholar]
- 13. Raykova, A. , Carrega, P. , Lehmann, F. M. , Ivanek, R. , Landtwing, V. , Quast, I. , Lunemann, J. D. et al., Interleukins 12 and 15 induce cytotoxicity and early NK‐cell differentiation in type 3 innate lymphoid cells. Blood Adv. 2017. 1. Available at: https://www.zora.uzh.ch/id/eprint/144904/1/Interleukins_12_and_15_induce_cytotoxicity_and_early_NK-cell_differentiation_Raykova_et_al.pdf. 10.1182/bloodadvances.2017008839. [DOI] [PMC free article] [PubMed] [Google Scholar]
- 14. Cella, M. , Gamini, R. , Secca, C. , Collins, P. L. , Zhao, S. , Peng, V. , Robinette, M. L. et al., Subsets of ILC3‐ILC1‐like cells generate a diversity spectrum of innate lymphoid cells in human mucosal tissues. Nat. Immunol. 2019. 20. 10.1038/s41590-019-0425-y. [DOI] [PMC free article] [PubMed] [Google Scholar]
- 15. Vonarbourg, C. , Mortha, A. , Bui, V. L. , Hernandez, P. P. , Kiss, E. A. , Hoyler, T. , Flach, M. et al., Regulated expression of nuclear receptor RORgammat confers distinct functional fates to NK cell receptor‐expressing RORgammat(+) innate lymphocytes. Immunity. 2010. 33. 10.1016/j.immuni.2010.10.017. [DOI] [PMC free article] [PubMed] [Google Scholar]
- 16. Bernink, J. H. , Peters, C. P. , Munneke, M. , te Velde, A. A. , Meijer, S. L. , Weijer, K. , Hreggvidsdottir, H. S. et al., Human type 1 innate lymphoid cells accumulate in inflamed mucosal tissues. Nat. Immunol. 2013. 14. Available at: https://www.ncbi.nlm.nih.gov/pubmed/23334791. 10.1038/ni.2534. [DOI] [PubMed] [Google Scholar]
- 17. Gao, Y. , Souza‐Fonseca‐Guimaraes, F. , Bald, T. , Ng, S. S. , Young, A. , Ngiow, S. F. , Rautela, J. et al., Tumor immunoevasion by the conversion of effector NK cells into type 1 innate lymphoid cells. Nat. Immunol. 2017. 18. 10.1038/ni.3800. [DOI] [PubMed] [Google Scholar]
- 18. Cortez, V. S. , Ulland, T. K. , Cervantes‐Barragan, L. , Bando, J. K. , Robinette, M. L. , Wang, Q. , White, A. J. et al., SMAD4 impedes the conversion of NK cells into ILC1‐like cells by curtailing non‐canonical TGF‐beta signaling. Nat. Immunol. 2017. 18. 10.1038/ni.3809. [DOI] [PMC free article] [PubMed] [Google Scholar]
- 19. Crellin, N. K. , Trifari, S. , Kaplan, C. D. , Cupedo, T. and Spits, H. , Human NKp44+IL‐22+ cells and LTi‐like cells constitute a stable RORC+ lineage distinct from conventional natural killer cells. J. Exp. Med. 2010. 207. 10.1084/jem.20091509. [DOI] [PMC free article] [PubMed] [Google Scholar]
- 20. Vitale, M. , Falco, M. , Castriconi, R. , Parolini, S. , Zambello, R. , Semenzato, G. , Biassoni, R. et al., Identification of NKp80, a novel triggering molecule expressed by human NK cells. Eur. J. Immunol. 2001. 31. 10.1002/1521-4141 (200101)31:1<233::aid‐immu233>3.0.co.2–4. [DOI] [PubMed] [Google Scholar]
- 21. Weizman, O. E. , Adams, N. M. , Schuster, I. S. , Krishna, C. , Pritykin, Y. , Lau, C. , Degli‐Esposti, M. A. et al., ILC1 Confer Early Host Protection at Initial Sites of Viral Infection. Cell. 2017. 171. 10.1016/j.cell.2017.09.052. [DOI] [PMC free article] [PubMed] [Google Scholar]
- 22. Romagnani, C. , Juelke, K. , Falco, M. , Morandi, B. , D'Agostino, A. , Costa, R. , Ratto, G. et al., CD56brightCD16‐ killer Ig‐like receptor‐ NK cells display longer telomeres and acquire features of CD56dimNK cells upon activation. J. Immunol. 2007. [DOI] [PubMed] [Google Scholar]
- 23. Huntington, N. D. , Vosshenrich, C. A. J. and Di Santo, J P. , Developmental pathways that generate natural‐killer‐cell diversity in mice and humans. Nat. Rev. Immunol. 2007. 7. 10.1038/nri2154. [DOI] [PubMed] [Google Scholar]
- 24. Bernink, J. H. , Krabbendam, L. , Germar, K. , de Jong, E. , Gronke, K. , Kofoed‐Nielsen, M. , Munneke, J. M. et al., Interleukin‐12 and ‐23 Control Plasticity of CD127(+) Group 1 and Group 3 Innate Lymphoid Cells in the Intestinal Lamina Propria. Immunity. 2015. 43. Available at: https://www.ncbi.nlm.nih.gov/pubmed/26187413. 10.1016/j.immuni.2015.06.019. [DOI] [PubMed] [Google Scholar]
- 25. Bal, S. M. , Bernink, J. H. , Nagasawa, M. , Groot, J. , Shikhagaie, M. M. , Golebski, K. , van Drunen, C. M. et al., IL‐1beta, IL‐4 and IL‐12 control the fate of group 2 innate lymphoid cells in human airway inflammation in the lungs. Nat Immunol. 2016. 17. 10.1038/ni.3444. [DOI] [PubMed] [Google Scholar]
- 26. Dogra, P. , Rancan, C. , Ma, W. , Toth, M. , Senda, T. , Carpenter, D. J. , Kubota, M. et al., Tissue Determinants of Human NK Cell Development, Function, and Residence. Cell. 2020. 10.1016/j.cell.2020.01.022. [DOI] [PMC free article] [PubMed] [Google Scholar]
- 27. Björklund, A. K. , Forkel, M. , Picelli, S. , Konya, V. , Theorell, J. , Friberg, D. , Sandberg, R. et al., The heterogeneity of human CD127+ innate lymphoid cells revealed by single‐cell RNA sequencing. Nat. Immunol. 2016. 17. 10.1038/ni.3368. [DOI] [PubMed] [Google Scholar]
- 28. Simoni, Y. , Fehlings, M. , Kløverpris, H. N. , McGovern, N. , Koo, S. L. , Loh, C. Y. , Lim, S. et al., Human Innate Lymphoid Cell Subsets Possess Tissue‐Type Based Heterogeneity in Phenotype and Frequency. Immunity. 2017. 10.1016/j.immuni.2016.11.005. [DOI] [PMC free article] [PubMed] [Google Scholar]
- 29. Chen, L. , Youssef, Y. , Robinson, C. , Ernst, G. F. , Carson, M. Y. , Young, K. A. , Scoville, S. D. et al., CD56 Expression Marks Human Group 2 Innate Lymphoid Cell Divergence from a Shared NK Cell and Group 3 Innate Lymphoid Cell Developmental Pathway. Immunity. 2018. 10.1016/j.immuni.2018.08.010. [DOI] [PMC free article] [PubMed] [Google Scholar]
- 30. Victor, A. R. , Nalin, A. P. , Dong, W. , McClory, S. , Wei, M. , Mao, C. , Kladney, R. D. et al., IL‐18 Drives ILC3 Proliferation and Promotes IL‐22 Production via NF‐kappaB. J Immunol. 2017. 199. 10.4049/jimmunol.1601554. [DOI] [PMC free article] [PubMed] [Google Scholar]
- 31. Savoy, S. K. A. and Boudreau, J. E. , The Evolutionary Arms Race between Virus and NK Cells: Diversity Enables Population‐Level Virus Control. Viruses. 2019. 11. 10.3390/v11100959. [DOI] [PMC free article] [PubMed] [Google Scholar]
- 32. Kløverpris, H. N. , Kazer, S. W. , Mjösberg, J. , Mabuka, J. M. , Wellmann, A. , Ndhlovu, Z. , Yadon, M. C. et al., Innate Lymphoid Cells Are Depleted Irreversibly during Acute HIV‐Infection in the Absence of Viral Suppression. Immunity. 2016. 10.1016/j.immuni.2016.01.006. [DOI] [PMC free article] [PubMed] [Google Scholar]
- 33. van Unen, V. , Li, N. , Molendijk, I. , Temurhan, M. , Höllt, T. , van der Meulen‐de Jong, A. E. , Verspaget, H. W. et al., Mass Cytometry of the Human Mucosal Immune System Identifies Tissue‐ and Disease‐Associated Immune Subsets. Immunity. 2016. 10.1016/j.immuni.2016.04.014. [DOI] [PubMed] [Google Scholar]
- 34. Walch, M. , Dotiwala, F. , Mulik, S. , Thiery, J. , Kirchhausen, T. , Clayberger, C. , Krensky, A. M. et al., Cytotoxic cells kill intracellular bacteria through granulysin‐mediated delivery of granzymes. Cell. 2014. 157. 10.1016/j.cell.2014.03.062. [DOI] [PMC free article] [PubMed] [Google Scholar]
- 35. Zhou, J. , Li, S. , Wang, X. , Zou, M. and Gao, S. , Bartha‐k61 vaccine protects growing pigs against challenge with an emerging variant pseudorabies virus. Vaccine. 2017. 35. 10.1016/j.vaccine.2017.01.003. [DOI] [PubMed] [Google Scholar]
- 36. Heller, K. N. , Gurer, C. and Munz, C. , Virus‐specific CD4+ T cells: ready for direct attack. J Exp Med. 2006. 203. 10.1084/jem.20060215. [DOI] [PMC free article] [PubMed] [Google Scholar]
- 37. Graham, C. M. , Christensen, J. R. and Thomas, D. B. , Differential induction of CD94 and NKG2 in CD4 helper T cells. A consequence of influenza virus infection and interferon‐gamma? Immunology. 2007. 121. 10.1111/j.1365-2567.2007.02563.x. [DOI] [PMC free article] [PubMed] [Google Scholar]
- 38. Pipkin, M. E. , Sacks, J. A. , Cruz‐Guilloty, F. , Lichtenheld, M. G. , Bevan, M. J. and Rao, A. , Interleukin‐2 and Inflammation Induce Distinct Transcriptional Programs that Promote the Differentiation of Effector Cytolytic T Cells. Immunity. 2010. 10.1016/j.immuni.2009.11.012. [DOI] [PMC free article] [PubMed] [Google Scholar]
- 39. Workman, A. M. , Jacobs, A. K. , Vogel, A. J. , Condon, S. and Brown, D. M. , Inflammation enhances IL‐2 driven differentiation of cytolytic CD4 T cells. PLoS One. 2014. 9. 10.1371/journal.pone.0089010. [DOI] [PMC free article] [PubMed] [Google Scholar]
- 40. Krabbendam, L. , Nagasawa, M. , Spits, H. and Bal, S. M. , Isolation of Human Innate Lymphoid Cells. Curr. Protoc. Immunol. 2018. 122. 10.1002/cpim.55. [DOI] [PubMed] [Google Scholar]
- 41. Cossarizza, A. , Chang, H. D. , Radbruch, A. , Acs, A. , Adam, D. , Adam‐Klages, S. , Agace, W. W. et al., Guidelines for the use of flow cytometry and cell sorting in immunological studies (second edition). Eur. J. Immunol. 2019. 49: 1457–1973. [DOI] [PMC free article] [PubMed] [Google Scholar]
- 42. Ritchie, M. , Phipson, Wu, D. , Hu, Y. , Law, C. W. , Shi, W. and Smyth, G. K. , limma powers differential expression analyses for RNA‐sequencing and microarray studies | Nucleic Acids Research | Oxford Academic. limma powers Differ. Expr. Anal. RNA‐sequencing microarray Stud. 2015. [DOI] [PMC free article] [PubMed]
- 43. Su, S. , Law, C. W. , Ah‐Cann, C. , Asselin‐Labat, M. L. , Blewitt, M. E. and Ritchie, M. E. , Glimma: Interactive graphics for gene expression analysis. Bioinformatics. 2017. 10.1093/bioinformatics/btx094. [DOI] [PMC free article] [PubMed] [Google Scholar]
- 44. Carvalho, B. S. and Irizarry, R. A. , A framework for oligonucleotide microarray preprocessing. Bioinformatics. 2010. 10.1093/bioinformatics/btq431. [DOI] [PMC free article] [PubMed] [Google Scholar]
- 45. Gu, Z. , Eils, R. and Schlesner, M. , Complex heatmaps reveal patterns and correlations in multidimensional genomic data. Bioinformatics. 2016. 10.1093/bioinformatics/btw313. [DOI] [PubMed] [Google Scholar]
- 46. Ulgen, E. , Ozisik, O. and Sezerman, O. U. , pathfindR: An R Package for Comprehensive Identification of Enriched Pathways in Omics Data Through Active Subnetworks. Front. Genet. 2019. 10. Available at: https://www.frontiersin.org/article/10.3389/fgene.2019.00858. [DOI] [PMC free article] [PubMed] [Google Scholar]
- 47. Vu, V. Q. , ggbiplot: A ggplot2 based biplot. R package version 0.55. Vu, Vincent Q. 2011.
- 48. Wickham, H. , Averick, M. , Bryan, J. , Chang, W. , Mcgowan, L. D. A. , François, R. , Grolemund, G. et al., Welcome to the Tidyverse Tidyverse package. 2019. 4. 10.21105/joss.01686. [DOI] [Google Scholar]
Associated Data
This section collects any data citations, data availability statements, or supplementary materials included in this article.
Supplementary Materials
Supporting information
Data Availability Statement
Microarray GEO (Gene Expression Omnibus): GSE147231.