Abstract
Purpose
To assess continuity of perimetric defects corresponding to arcuate defects seen on optical coherence tomography (OCT) en face reflectance images of the retinal nerve fibre layer (RNFL) in patients with glaucoma.
Methods
Seven patients with glaucoma who had arcuate structural defects on OCT RNFL en face images were recruited. Static suprathreshold stimuli were presented along different meridians to localise perimetric defects in the corresponding hemifield. Then two contrasts, one 6 dB greater than the other, were used with kinetic perimetry to assess the slope of the defect. Findings with kinetic and 24‐2 perimetry were compared.
Results
Static perimetry found that regions of perimetric abnormality spatially corresponded with the regions of en face RNFL hyporeflectivity. Kinetic perimetry found that the slopes of the edges of the defects ranged from 3–12 dB degree−1, and that the functional abnormalities were continuous with the physiologic blind spot even when the 24‐2 protocol only showed paracentral defects.
Conclusions
Perimetric abnormalities and arcuate RNFL en face defects were spatially correspondent. Perimetric testing guided by OCT en face reflectance images can reveal greater functional detail of glaucomatous abnormality than 24‐2 testing.
Keywords: arcuate defect, en face images, glaucoma, OCT, perimetry, retinal nerve fibre layer
Introduction
Clinical assessment of glaucomatous abnormality routinely involves static perimetry, in which only a limited number of retinal locations can be practically sampled. The retinal locations tested, therefore, need to be judiciously sampled in terms of the clinical utility of the perimetric results, such as structure‐function agreement and the potential impact of visual defects on activities of daily living. In recent years, it has become widely recognised that the locations tested by the most commonly used perimetric grid ‐ the 24‐2 grid ‐ sometimes miss the presence of glaucomatous abnormalities due to the low sampling density. 1 , 2 , 3 While the 10‐2 grid provides a higher sampling density for identifying central losses otherwise missed by the 24‐2 grid, its restricted field size is limiting. Performing perimetric testing with both 10‐2 and 24‐2 grids is also practically not viable. In view of this, an alternative grid, 24‐2C, has been developed in which 10 new testing perimetric locations have been added to the 24‐2 grid based on the retina locations identified to have the greatest susceptibility to glaucomatous defect. While there are clinical benefits to be derived from the added sampling of the macula in the 24‐2C pattern, 4 , 5 one potential setback is that it uses a fixed grid across a wide variety of possible patterns of the glaucomatous abnormality and also maintains a 6° spacing of the peripheral points. This may still be limiting for assessing the structural‐functional relation as well as assessing progression.
An alternative to the use of fixed grids, targeted perimetry, involves an individualised sampling methodology seeded by a structural or functional assessment of the potential regions of retinal abnormality. 6 , 7 , 8 , 9 , 10 , 11 , 12 This sampling method mostly concentrates the perimetric points within regions of interest (the regions of potential abnormality) to enhance the characterisation of the perimetric defect. Optical coherence tomography (OCT) en face visualisation of hyporeflectivity in the retinal nerve fibre layer (RNFL) is an appealing alternative for effectively guiding perimetric sampling for several reasons. These include the spatial detail in the pattern of RNFL hyporeflectivity, 13 , 14 as well as the limited contribution of non‐fibre component to the reflectance signature assessed by the OCT en face visualisation of the RNFL. 15
Recent studies have found that the spatial pattern of the RNFL hyporeflectivity seen in the en face images was also seen in results from static perimetry. 12 , 16 These results give the impression that the perimetric defect is continuous with the en face RNFL defect, and the current study used kinetic perimetry to assess that continuity in patients with arcuate RNFL defects. The goal of this study is to improve clinical understanding of relations between perimetric defects and the arcuate RNFL abnormalities seen on OCT en face visualisation of the RNFL, and provide a basis for methods of targeted perimetry that improve structure‐function agreement.
Methods
The research methods followed the tenets of the Declaration of Helsinki and were approved by the Indiana University Institutional Review Board (IRB). After explaining the nature and possible risks of the study to the participants, written informed consent was obtained before testing. First, the subjects’ visual acuity and contrast sensitivity were checked, and then the study protocol was administered.
Subjects
Patients with glaucoma who had arcuate RNFL defects on en face images assessed with the Heidelberg Spectralis OCT (www.heidelbergengineering.co.uk) were selected from the participants of our prior study investigating the relation between en face image RNFL abnormalities and circumpapillary retinal nerve fibre layer thickness measures. 17 The prior study used a montage of OCT volume scans at 30 µm spacing, which were designed so that the montage covered most of the central ±24° of the retina. Reflectance slabs from those montaged volume scans were used for the current study.
The subjects with glaucoma had clear ocular media, as well as normal retinal findings with the exception of disc, RNFL or perimetric abnormalities associated with glaucoma, and were under the care of an eye care practitioner. Perimetric visual field results in the subjects had reproducible defects at two or more contiguous points with p < 0.01, or three or more contiguous points with p < 0.05, or a 10‐dB difference across the nasal horizontal midline in the presence of clinical glaucomatous optic neuropathy on the total (or pattern) deviation maps. Out of the 33 subjects with glaucoma who participated in the prior study, 10 were identified to have arcuate OCT en face RNFL defects. Arcuate RNFL defects were defined when the RNFL en face image of the participant’s study eye showed an arcuate pattern of hyporeflectivity (reduced reflectance). Seven of these participants accepted the invitation to participate in the current study.
Stimuli and contrast definitions on the octopus 900 perimeter
Visual field examinations were performed using the Octopus 900 perimeter (www.haag‐streit.com) with EyeSuite software version 3.3.1. The background luminance was set to 10 cd m−2. The stimulus size options available on the Octopus device are the Goldman size I to V stimuli ‐ circular luminance stimuli from 0.11° to 1.72° in diameter. For any given stimulus size, the maximum luminance (Lmaximum) is denoted as 4e and is equivalent to 318 cd m−2 on the device. In terms of contrast, a one‐step change in the numerical and alphabetical components of the luminance nomenclature is equivalent to a 5 dB and a 1 dB change, respectively. Furthermore, a change in the stimulus size by one step has traditionally been considered equivalent to a 5 dB change for kinetic perimetry. 18 Compared to the Humphrey Field Analyzer (HFA) with Lbackground of 10 cd m−2 and Lmaximum of 3183 cd m−2, a G‐III 4e stimulus on the Octopus 900 has equivalent contrast to a 10 dB stimulus on the HFA.
Study protocol
The study was divided into two phases. Each phase consisted of a series of steps providing the information needed to achieve the overall goal of the phase. Testing lasted between 30–40 min, including 1–2 min breaks between steps during which the subjects were instructed on the procedures involved in the succeeding step.
Phase 1: The goal of Phase 1 was to localise the perimetric abnormalities within retinal hemifields of each study participant, and to determine the edge of functional abnormality. To limit fatigue from long testing durations, only the hemiretina with the largest RNFL defect (based on the en face hyporeflectivity) was tested when both retinal hemifields had arcuate defects.
Step 1: The goal of this step was to give study participants practice with kinetic perimetry. The G‐III 4e stimulus was presented at 4 ° s−1 from the outer non‐seeing region towards fixation, and the subject’s task was to press the response trigger when the stimulus was seen (Figure 1a ). 19 The G‐III stimulus was chosen for this step because it is the routinely used perimetric stimulus for clinical assessments and is most familiar to glaucoma patients. The brightest luminance ‐ 4e ‐ was used to enhance its visibility. The spatial order of the stimulus presentation was sequential at 15 o intervals. The subject was informed about the pattern of presentation to reduce spatial uncertainty of stimulus presentation.
Figure 1.
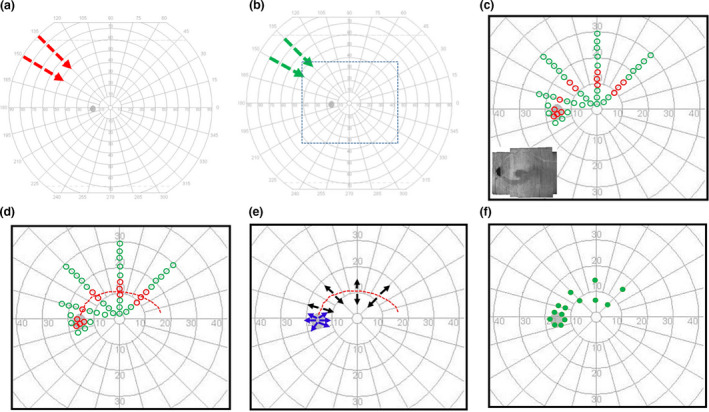
Schematic illustration of testing protocol. (a) Step 1 ‐ testing pattern for training study participants for kinetic testing superimposed on the user interface of the Octopus 900 perimeter. The arrows show examples of the direction and spacing of stimulus presentation. (b) Step 2 ‐ preliminary G‐II stimulus testing for estimating G‐II luminance for the subsequent steps of testing. The nature of testing was same as in (a). The short dashes enclose the central ± 30° which was our region of interest (ROI) (c) Step 3 ‐ the pattern of static suprathreshold testing in the ROI. The green and red markers are schematic representations of retinal locations where the static suprathreshold stimulus was seen and not seen, respectively. The inset shows an example of an en face RNFL image used to guide the selection of the hemifield for perimetric assessment. (d) Step 4 – the arcuate kinetic pattern (shown in red short dashes) used to assess the continuity of the locations of abnormality identified from the static suprathreshold testing in c. (e) Step 5 ‐ centrifugal presentation of the stimulus (black), diverging from the continuous perimetric abnormality defined in d, for identifying the edges of the glaucomatous defect. A similar assessment (shown in blue) was performed at the edge of the physiologic blind spot. (f) The green filled markers show examples of locations at which the kinetic stimulus presented in E was first seen.
The G‐II stimulus was preferred for testing, targeted at localising the regions of perimetric defect and used for subsequent testing. This stimulus has a combined benefit of being small and therefore beneficial for localizing defects, 20 as well as a likely lower test‐retest variability relative to the G‐I stimulus. 21
Step 2: In order to estimate the luminance of the G‐II stimulus to be used for further testing, Step 1 was repeated with the G‐II stimulus at the 1e luminance. The closer the isopter for this stimulus was to fixation, the greater the luminance of the G‐II stimulus used for the next steps of testing.
Step 3: The goal of this step was to localise the regions of perimetric defect rapidly within the subject’s central ±30° using static suprathreshold testing. Informed by the isopter for the G‐II 1e stimulus (in Step 2), static suprathreshold testing was performed using the 4e luminance for five patients. Alternate luminances were used for two patients: the 3e luminance was used for a subject with a relatively high hill of vision based on the isopter found with G‐II 1e testing; the 1a luminance was used for another patient because no defects could be found with the higher luminance. The stimulus was presented once at each location. During testing the subject was reminded to fixate on the fixation target, the examiner inspected the eye monitor display to ensure the pupil was centred and then the stimulus was presented. The stimulus was presented at locations approximately 2° apart along at least four representative meridians not more than 45° apart (Figure 1c ). The spatial order of the presentation was sequential to reduce the spatial uncertainty of the stimulus presentation. The subject’s task was to click the response button when a flash of light was seen.
The static suprathreshold stimuli were also presented in the disc region to localise the optic disc. The information from this testing was used together with the centre of fixation to guide overlaying the perimetric findings on the OCT en face RNFL reflectance images.
Step 4. The goal of this step was to test the continuity of the abnormalities detected with the static suprathreshold testing (in Step 3). The same stimulus (used for the static suprathreshold testing in Step 3) was presented along a path that began at the location of the blind spot, and linked the points of perimetric defect identified with static suprathreshold perimetry (Figure 1d ).
The kinetic stimulus was moved at 2 ° s−1 for this and subsequent kinetic testing to minimise the impact of reaction time on the test assessment and refine the location of perimetric defect findings. 22 The path followed by this stimulus when it was not seen was defined as an ‘arc of functional abnormality’ within the subject’s field of vision. The subject’s task during the stimulus presentation was to click the response trigger when the stimulus was seen.
Step 5: The goal of this step was to define the edge of the perimetric defect. The stimulus used in Step 3 was moved centrifugally, diverging from points along the arc of functional abnormality (Figure 1e ). The stimulus was presented along representative meridians (such as in Step 3) and a 3rd degree polynomial was used to interpolate between the points along the meridians at which the stimulus was first seen. When fixation losses were observed during the kinetic stimulus presentation, the presentation was repeated twice and the coordinates at which the stimulus was seen were averaged.
Phase 2: The goal of Phase 2 was to assess the steepness of the edges of the perimetric defect.
Step 6: To assess the slope of the perimetry defects, centrifugal testing (as in Step 5) was repeated using two different stimulus luminances 3 dB (0.3 log units) above and below that used in Step 5. If, however, a 3 dB contrast change was unattainable due to the limits imposed by the range of luminances provided on the Octopus device, the stimulus size was changed and the luminance adjusted to achieve an equivalent contrast. For example, a 3 dB contrast increment from G‐II 4e was computed as follows: because the maximum luminance attainable on the Octopus device is 4e, the stimulus size was changed from G‐II to G‐III (considered equivalent to 5 dB contrast increase for kinetic perimetry 18 ) and then the luminance was changed from 4e to 4c (equivalent to 2 dB contrast decrease). Thus, the change from G‐II 4e to G‐III 4c was considered equivalent to a 3 dB contrast increment.
After the testing of the arcuate perimetric defect was completed, the step was repeated at the edge of the physiological blind spot to provide a reference for defining the steepness of the arcuate defect. When the slope of the defect was within the range of slope quantified at the edge of the disc, the defect was considered steep.
Analysis
Phase 1
We investigated the spatial relation between the RNFL reflectance hyporeflectivity and the perimetric functional abnormality by superimposing the findings of both the static suprathreshold and kinetic perimetric testing on 4 μm OCT en face slabs centred at 24 μm beneath the inner limiting membrane (Figure S1). Remnant nerve fibre bundles within the regions of hyporeflectivity on OCTA en face images are often more superficial on the en face images because of the use of the inner limiting membrane as a reference plane for generating the en face images. Therefore, our choice of a 4 μm thick superficial en face slab was to enhance the visualisation of such fibres. Even more superficial slabs may have been preferred but the fibres in the more superficial layers are easily obscured by putative glial reflectances. 23
We used horizontal and vertical motions of the visual field to align the fixation point with the centre of the fovea, and then, if needed, rotated the RNFL en face image slightly around fixation to align the physiologic blind spot from the perimetric findings with the disc on the RNFL en face images. To avoid the impact of corneal curvature and axial length on comparisons made in microns, all lateral measurements were kept in degrees of visual angle; only axial distances from the inner limiting membrane were expressed in microns. We compared the width of the RNFL hyporeflectivity on the OCT en face image with the width of the perimetric abnormality on the kinetic perimetric findings along the 30°, 60° and 90° meridians (Figure S2), using a repeated measures t‐test. We also compared the differences in the widths of defects after adjusting perimetric locations for reaction time, which was reliably assessed in four subjects.
Furthermore, to assess how the findings compared with standard clinical measures, we superimposed the findings from the kinetic perimetric testing on the total deviation maps from 24‐2 perimetry testing. The 24‐2 total deviation values were obtained from the patients’ routine clinic visits with the Humphrey Field Analyzer using a G‐III stimulus. The total deviation maps provided a raw estimate of the perimetric deviation from age norms without further adjustments to the data such as in a pattern deviation map, which uses a method that can overestimate the adjustment factor in eyes with perimetric defects. 24 , 25
Phase II
We investigated the functional slope at the edge of the defects by analysing the difference between the widths of the perimetric defects measured with the two contrast conditions. The perimetric defect width obtained with the higher contrast stimulus was subtracted from that of the lower contrast stimulus along the 30°, 60°, 90°, 120° and 150° meridians, and the mean difference was computed. A similar computation was made for the measures at the edge of the physiological scotoma assessed along the horizontal meridian of the disc. The slopes were expressed as dB degree−1 and were computed as the range of stimulus luminances used for investigating the edge of the perimetric defect (6 dB) divided by the mean difference in the widths of the perimetric defect assessed with the higher‐contrast and the lower‐contrast stimuli. 26
Results
The mean age (standard deviation, S.D.) of the subjects studied was 70 (5) years ranging from 61–75 years, and the mean deviation of the 24‐2 perimetric testing was −3.9 (3.3) dB ranging from −1.6 to −10.8 dB. Figure 2 shows a step‐by‐step presentation of the findings in Subject 1. The regions of perimetric abnormality found with static suprathreshold testing spatially corresponded with the regions of RNFL hyporeflectivity (Figure 2c ), and the regions of functional abnormality identified with the static suprathreshold technique were continuous with the physiological blind spot (Figure 2d ). The edges of the functional abnormality came close to the edges of hyporeflective regions seen on the OCT en face images (Figure 2e ). The region of abnormality identified on 24‐2 static perimetry was within the region of abnormality identified with the kinetic testing (Figure 2f ).
Figure 2.
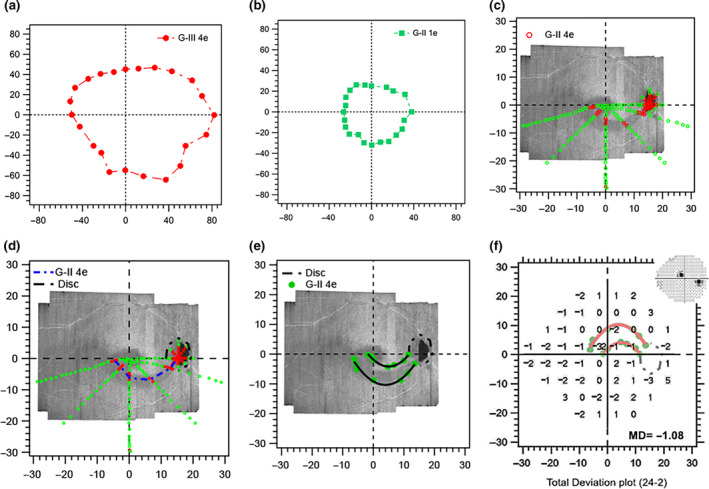
Findings of Phase 1 testing in Subject 1. (a) Isopter for the G‐III 4e stimulus during kinetic perimetric training. (b) Isopter for the G‐ II 1e stimulus used for estimating G‐II stimulus luminance for suprathreshold static testing. (c) The green and red markers show the results for the suprathreshold testing as locations at which the stimuli presented were seen (green) and not seen (red), respectively. (d) The blue short dashes (arc of functional abnormality) illustrate the path of a 2 ° s−1 kinetic stimulus passing through the unseen locations in c, assessing the continuity of the defect with the physiologic blind spot. The short black dashes illustrate the edge of the physiologic blind spot. (e) The green filled markers show the locations at which the stimuli diverging from the arc of functional abnormality were first seen, and black curves show interpolated edges obtained by 3rd degree polynomial fits to these patterns of locations. (f) Total deviation findings from 24‐2 static perimetry overlaid with the kinetic perimetric findings. The insert is a greyscale image of the 24‐2 sensitivities. All axes are in degrees of visual angle.
The findings for the static (Figure 3 ) and kinetic (Figure 4 ) testing for five other subjects were similar to those for Subject 1, as was the comparison between the kinetic results and 24‐2 threshold static results (Figure 5 ). For the remaining patient (Subject 7), we only saw a pattern of abnormality consistent with the arcuate defect (Figure 4 ) at a considerably lower stimulus luminance. The defect was however small, and it could not be followed with a kinetic strategy amid eye movements.
Figure 3.
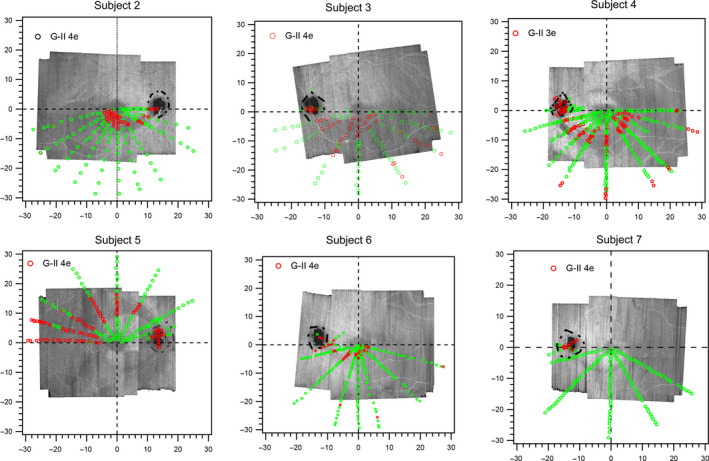
Meridional static suprathreshold perimetric testing results in the remaining six subjects. The green markers represent the retinal locations where the stimulus was seen, and the red markers identify locations where the stimulus was not seen. Except in Subject 7, the spatial locations of the abnormality corresponded with the regions of hyporeflectivity on the en face images. Red arrows point to the arcuate retinal nerve fibre layer (RNFL) defects on en face images of Subjects 6 and 7 to enhance the visibility of the defects.
Figure 4.
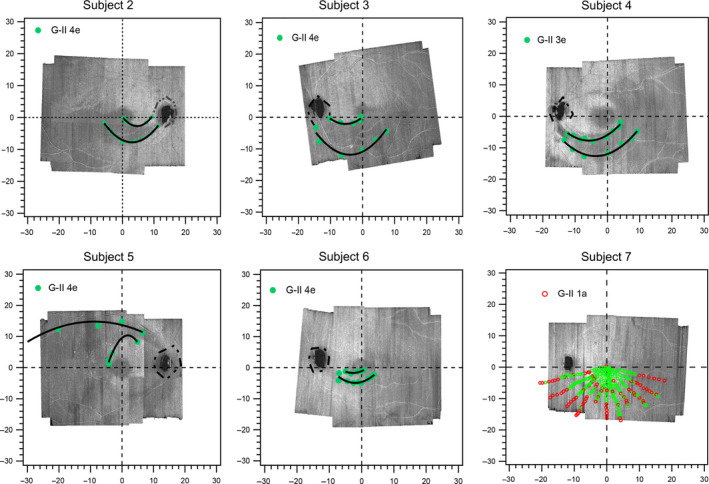
The edges of the functional abnormalities relative to the edges of the structural abnormalities. The green‐filled markers show the locations at which the centrifugal stimulus moving from non‐seeing locations was first seen. The black lines are third degree polynomial fits used to interpolate between the green markers. For Subject 7, at a dimmer stimulus luminance, a pattern of abnormality began to emerge; however, the defect was so small that it could not be followed with a kinetic strategy amid eye movements.
Figure 5.
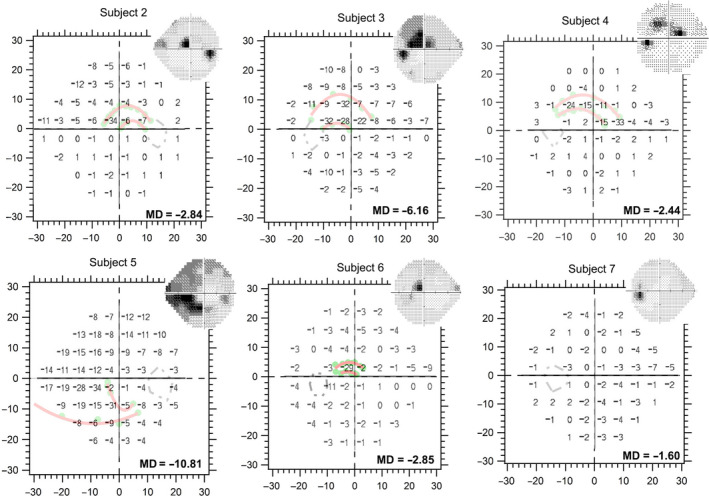
Kinetic perimetry findings compared to the total deviation findings from static threshold 24‐2 perimetric testing. The insets are greyscale images from the static 24‐2 protocol. The regions of greatest perimetric abnormalities in the retinal hemifield studied, shown as dark shades on the greyscale images, corresponded with the regions identified by kinetic perimetric results as showing abnormalities.
For the six subjects with defects assessed with kinetic testing (Figure 6 ), the mean (S.D.) width of the perimetric defect was 6.0° (2.8) ranging from 3.4° −11.1° and was moderately different compared to the RNFL hypo‐reflective region on en face images with mean width of 4.2° (2.1) ranging from 2.6° −8.2°; Cohen’s D = 0.7; p = 0.02. After compensating for the effects of reaction time (in four subjects with reaction time assessment) the mean width of perimetric defect was 5.1° (2.2), ranging from 2.2°–8.7°, and was similar to the RNFL hyporeflective region with mean width 4.6° (2.6) ranging from 2.6°–8.2°; Cohen’s D = 0.2, p = 0.3. In phase 2, the slopes at the edges of the functional abnormality ranged from 3–12 dB degree−1, and the slopes near the optic disc were within this range for five patients and steeper than 40 dB degree−1 for one (Subject 2).
Figure 6.
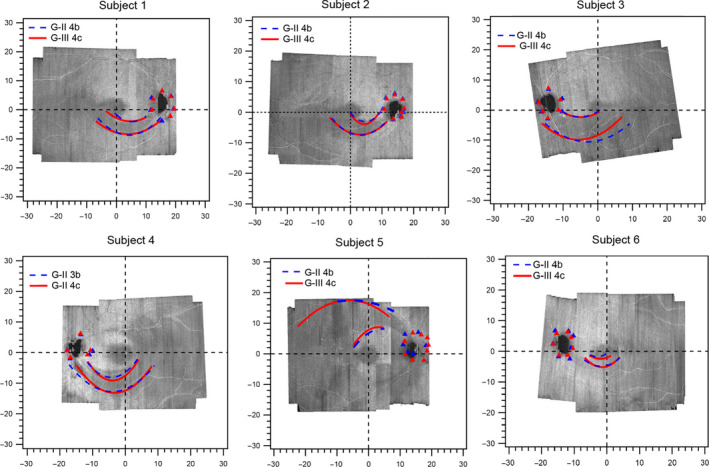
Functional slope at the edge of the glaucomatous defects superimposed on the optical coherence tomography (OCT) en face images. The red and blue colours show third degree polynomial fits to the edges of the functional defects identified with the two stimuli 6 dB apart. The triangles show the edges of the physiological blind spot. Subject 7 was not included because we were unable to follow the findings of the static suprathreshold testing with kinetic testing.
Discussion
In this study, we used a combination of kinetic and static perimetry in selected patients who had arcuate hyporeflective regions on the OCT en face visualisation of the RNFL, and found that the perimetric defects from both testing modalities spatially corresponded to the hyporeflective RNFL en face defects at 24 μm below the inner limiting membrane. Using a kinetic methodology, we confirmed that, as with the RNFL hyporeflectivity, the perimetric defects were continuous and traceable to the disc along the nerve fibre trajectory. We also found that what appeared as paracentral defects on the 24‐2 testing were in fact arcuate in nature. Importantly, over the 6 dB range of contrasts used for exploring the edge of the glaucomatous perimetric defect, as well as the edge of the physiologic scotoma, we found the edges of the perimetric defects were as steep as the edges of the physiologic scotoma.
Our findings, together with those of prior studies, 1 , 27 emphasise that the presence of paracentral defects on 24‐2 testing could possibly indicate an arcuate defect and require further investigation to assess the full extent of the perimetric abnormality and to appropriately characterise the defect type. Consistent with the nature of the RNFL hyporeflectivity seen on the en face image, it is clear from our rapid meridional static suprathreshold strategy (as well as kinetic perimetric findings) that using a suitable sampling grid would enhance a clinician’s ability to properly classify the defect type. While the patterns of en face RNFL hyporeflectivity that characterise perimetric arcuate defects are yet to be determined, we infer from this pilot dataset that the perimetric abnormalities accompanying arcuate RNFL hyporeflectivities are arcuate in nature, and that sampling the perimetric testing locations guided by the en face images may enhance the defect type classification.
Our study has some limitations, including sample size and the testing approach of the methodology. Clearly, further study in a larger sample size is needed to explore the preliminary observations from this study. Also, our study methodology was simplified to support the use of a clinical device and limit the testing duration to a range that supports reliable assessment and limit the impact of fatigue. For example, our kinetic approach used a one‐way method of limits as compared to the two‐way method of limits or 2‐interval‐forced‐choice method used by Phu et al. 28 Also, a limited range of stimulus luminances (6 dB) was used for assessing the slope at the edges of the perimetric defect. Despite this simplification of our methodology, and the use of single stimulus presentations, there was good agreement between the static and kinetic perimetric findings, as well as agreement with the en face reflectance hyporeflective regions. Another limitation is the resolution of the static perimetric testing. A much finer resolution of about 1° would have supported exploring other interesting concepts such as statokinetic dissociation at the edges of the perimetric defects. 29 , 30
To conclude, in this small group of patients the perimetric defects that accompanied arcuate RNFL defects seen on OCT en face visualisation of the nerve fibre layer were arcuate in nature. Perimetric testing guided by OCT en face reflectance images has the potential to reveal a greater functional detail of glaucomatous abnormality and enhance the clinical classification of the defect type, as well as enhance the estimation of the extent of functional loss from the disease process in an individualised manner.
Disclosure
One of the authors, William H. Swanson, is a consultant for Heidelberg Engineering who had no input into the design of this study. The other two authors, Bright S. Ashimatey and Brett J. King, have no conflict of interest.
Author contributions
Bright Senyo Ashimatey: Conceptualization (lead); Data curation (lead); Formal analysis (lead); Investigation (lead); Methodology (lead); Writing‐original draft (lead). Brett King: Conceptualization (supporting); Writing‐review & editing (supporting). William H. Swanson: Funding acquisition (lead); Investigation (supporting); Project administration (lead); Resources (lead); Writing‐review & editing (lead).
Supporting information
Figure S1. 4μm slab optical coherence tomography (OCT) en face visualisation of the retinal nerve fibre layer reflectance centred at 24μm depth for the seven subjects assessed in our study.
Figure S2. Schematic illustration quantifying perimetric defects and reflectance defects on the 4μm en face reflectance slabs centred at 24μm depth. Width of abnormalities were assessed for the kinetic perimetric findings A) and en face reflectance images (B) along the 30 o, 60 o and 90° meridians. All measurements (including scale bars) are in degrees of visual angle.
Acknowledgements
Research reported in this publication was supported by the National Eye Institute of the National Institutes of Health under Award Numbers R01EY024542, R01EY028135, 5P30EY019008. The content is solely the responsibility of the authors and does not necessarily represent the official views of the National Institutes of Health.
Ashimatey BS, King BJ, & Swanson WH. Functional characteristics of glaucoma related arcuate defects seen on OCT en face visualisation of the retinal nerve fibre layer. Ophthalmic Physiol Opt. 2021; 41: 437–446. 10.1111/opo.12780
References
- 1. De Moraes CG, Hood DC, Thenappan A et al. 24–2 Visual fields miss central defects shown on 10–2 tests in glaucoma suspects, ocular hypertensives, and early glaucoma. Ophthalmology 2017; 124: 1449–1456. [DOI] [PMC free article] [PubMed] [Google Scholar]
- 2. Hood DC, Raza AS, de Moraes CG, Liebmann JM & Ritch R. Glaucomatous damage of the macula. Prog Retin Eye Res 2013; 32: 1–21. [DOI] [PMC free article] [PubMed] [Google Scholar]
- 3. Sullivan‐Mee M, Karin Tran MT, Pensyl D, Tsan G & Katiyar S. Prevalence, features, and severity of glaucomatous visual field loss measured with the 10–2 achromatic threshold visual field test. Am J Ophthalmol 2016; 168: 40–51. [DOI] [PubMed] [Google Scholar]
- 4. Phu J & Kalloniatis M. Ability of 24–2C and 24–2 grids to identify central visual field defects and structure‐function concordance in glaucoma and suspects. Am J Ophthalmol 2020; 219: 317–331. [DOI] [PubMed] [Google Scholar]
- 5. Callan T, Lee GC, Yu S et al. Evaluation of the SITA Standard 24–2C visual field test. Invest Ophthalmol Vis Sci 2020; 61: 3876. [Google Scholar]
- 6. Orzalesi N, Miglior S, Lonati C & Rosetti L. Microperimetry of localized retinal nerve fiber layer defects. Vision Res 1998; 38: 763–771. [DOI] [PubMed] [Google Scholar]
- 7. Schiefer U, Papageorgiou E, Sample PA et al. Spatial pattern of glaucomatous visual field loss obtained with regionally condensed stimulus arrangements. Invest Ophthalmol Vis Sci 2010; 51: 5685–5689. [DOI] [PMC free article] [PubMed] [Google Scholar]
- 8. Wu Z & Medeiros FA. Recent developments in visual field testing for glaucoma. Curr Opin Ophthalmol 2018; 29: 141–146. [DOI] [PubMed] [Google Scholar]
- 9. Chong LX, McKendrick AM, Ganeshrao SB & Turpin A. Customized, automated stimulus location choice for assessment of visual field defects. Invest Ophthalmol Vis Sci 2014; 55: 3265–3274. [DOI] [PubMed] [Google Scholar]
- 10. Ballae Ganeshrao S, Turpin A & McKendrick AM. Sampling the visual field based on individual retinal nerve fiber layer thickness profile. Invest Ophthalmol Vis Sci 2018; 59: 1066–1074. [DOI] [PubMed] [Google Scholar]
- 11. Denniss J, McKendrick AM & Turpin A. Towards patient‐tailored perimetry: automated perimetry can be improved by seeding procedures with patient‐specific structural information. Transl Vis Sci Technol 2013; 2: 3. [DOI] [PMC free article] [PubMed] [Google Scholar]
- 12. Alluwimi MS, Swanson WH, Malinovsky VE & King BJ. Customizing perimetric locations based on en face images of glaucomatous damage to the retinal nerve fiber bundles. Transl Vis Sci Technol 2018; 7: 5. [DOI] [PMC free article] [PubMed] [Google Scholar]
- 13. Thompson B. Visualisation of the visual system. Ophthalmic Physiol Opt 2018; 38: 474–476. [DOI] [PubMed] [Google Scholar]
- 14. Hood DC, Fortune B, Mavrommatis MA et al. Details of glaucomatous damage are better seen on OCT en face images than on OCT retinal nerve fiber layer thickness maps. Invest Ophthalmol Vis Sci 2015; 56: 6208–6216. [DOI] [PMC free article] [PubMed] [Google Scholar]
- 15. Huang XR, Knighton RW & Cavuoto LN. Microtubule contribution to the reflectance of the retinal nerve fiber layer. Invest Ophthalmol Vis Sci 2006; 47: 5363–5367. [DOI] [PubMed] [Google Scholar]
- 16. Alluwimi MS, Swanson WH, Malinovsky VE & King BJ. A basis for customising perimetric locations within the macula in glaucoma. Ophthalmic Physiol Opt 2018; 38: 164–173. [DOI] [PMC free article] [PubMed] [Google Scholar]
- 17. Ashimatey BS, King BJ, Burns SA & Swanson WH. Evaluating glaucomatous abnormality in peripapillary optical coherence tomography enface visualisation of the retinal nerve fibre layer reflectance. Ophthalmic Physiol Opt 2018; 38: 376–388. [DOI] [PMC free article] [PubMed] [Google Scholar]
- 18. Goldmann H. Fundamentals of exact perimetry. 1945. Optom Vis Sci. 1999; 76: 599–604. [DOI] [PubMed] [Google Scholar]
- 19. Johnson CA & Keltner JL. Optimal rates of movement for kinetic perimetry. Arch Ophthalmol 1987; 105: 73–75. [DOI] [PubMed] [Google Scholar]
- 20. Swanson WH & King BJ. Comparison of defect depths for sinusoidal and circular perimetric stimuli in patients with glaucoma. Ophthalmic Physiol Opt 2019; 39: 26–36. [DOI] [PMC free article] [PubMed] [Google Scholar]
- 21. Gilpin LB, Stewart WC, Hunt HH & Broom CD. Threshold variability using different Goldmann stimulus sizes. Acta Ophthalmol 1990; 68: 674–676. [DOI] [PubMed] [Google Scholar]
- 22. Vonthein R, Rauscher S, Paetzold J et al. The normal age‐corrected and reaction time‐corrected isopter derived by semi‐automated kinetic perimetry. Ophthalmology 2007; 114: 1065–1072. [DOI] [PubMed] [Google Scholar]
- 23. Ashimatey BS, King BJ & Swanson WH. Retinal putative glial alterations: implication for glaucoma care. Ophthalmic Physiol Opt 2018; 38: 56–65. [DOI] [PMC free article] [PubMed] [Google Scholar]
- 24. Marín‐Franch I, Swanson WH & Malinovsky VE. A novel strategy for the estimation of the general height of the visual field in patients with glaucoma. Graefes Arch Clin Exp Ophthalmol 2014; 252: 801–809. [DOI] [PMC free article] [PubMed] [Google Scholar]
- 25. Asman P, Wild JM & Heijl A. Appearance of the pattern deviation map as a function of change in area of localized field loss. Invest Ophthalmol Vis Sci 2004; 45: 3099–3106. [DOI] [PubMed] [Google Scholar]
- 26. Wyatt HJ, Dul MW & Swanson WH. Variability of visual field measurements is correlated with the gradient of visual sensitivity. Vision Res 2007; 47: 925–936. [DOI] [PMC free article] [PubMed] [Google Scholar]
- 27. Hood DC, Raza AS, de Moraes CG et al. Initial arcuate defects within the central 10 degrees in glaucoma. Invest Ophthalmol Vis Sci 2011; 52: 940–946. [DOI] [PMC free article] [PubMed] [Google Scholar]
- 28. Phu J, Kalloniatis M, Wang H & Khuu SK. Optimising the structure‐function relationship at the locus of deficit in retinal disease. Front Neurosci 2019; 13: 306. [DOI] [PMC free article] [PubMed] [Google Scholar]
- 29. Phu J, Kalloniatis M, Wang H & Khuu SK. Differences in static and kinetic perimetry results are eliminated in retinal disease when psychophysical procedures are equated. Transl Vis Sci Technol 2018; 7: 22. [DOI] [PMC free article] [PubMed] [Google Scholar]
- 30. Schiller J, Paetzold J, Vonthein R, Hart WM, Kurtenbach A & Schiefer U. Quantification of stato‐kinetic dissociation by semi‐automated perimetry. Vision Res 2006; 46: 117–128. [DOI] [PubMed] [Google Scholar]
Associated Data
This section collects any data citations, data availability statements, or supplementary materials included in this article.
Supplementary Materials
Figure S1. 4μm slab optical coherence tomography (OCT) en face visualisation of the retinal nerve fibre layer reflectance centred at 24μm depth for the seven subjects assessed in our study.
Figure S2. Schematic illustration quantifying perimetric defects and reflectance defects on the 4μm en face reflectance slabs centred at 24μm depth. Width of abnormalities were assessed for the kinetic perimetric findings A) and en face reflectance images (B) along the 30 o, 60 o and 90° meridians. All measurements (including scale bars) are in degrees of visual angle.


