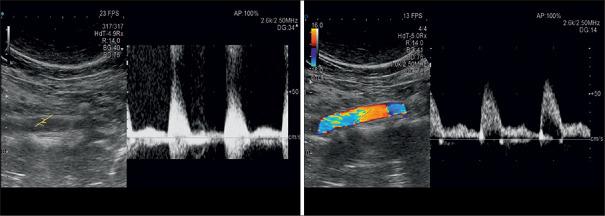
Abstract
With the development of modern EUS, multiple imaging functions, transducer settings, and examination modes have become available for clinical settings. While the major determinants of the ultrasound beam are still comprised of the signal wavelength, its frequency range, and its amplitude, other modifications and calculations have gained more interest for advanced users, such as tissue harmonic imaging (THI), spatial and frequency compounding, certain versions of speckle reduction, and various Doppler/duplex settings. The goal of such techniques is a better, perhaps more realistic image, with reduced artifacts (such as speckle), better image contrast, and an improved signal-to-noise ratio. In addition, “add-ons” such as THI, which is based on the phenomenon of nonlinear distortion of acoustic signals as they travel through tissues, provide greater contrast and an enhanced spatial resolution than conventional EUS. Finally, optimization of spectral and color Doppler imaging in EUS requires experience and knowledge about the basic principles of Doppler/duplex phenomena. For these purposes, factors such as adjustment of Doppler controls, Doppler angle, color gain, spectral wall filters, and others require special attention during EUS examinations. Incorporating these advanced techniques in EUS examinations may be time-consuming and cumbersome. Hence, practical guidelines enabling endosonographers to steer safely through the large quantity of technological properties and settings (knobology) are appreciated. This review provides an overview of the role of important imaging features to be adjusted before, during, and after EUS procedures.
Keywords: EUS, B-mode, doppler, image quality, guideline
INTRODUCTION
Contemporary ultrasound (US) equipment provides multiple imaging functions, transducer settings, transducer forms, and examination modes for various applications in the clinical setting. While the major determinants of the US beam are still comprised of the signal wavelength, its frequency range, and its amplitude, other modifications and calculations have gained more interest for advanced users such as tissue harmonic imaging (THI), spatial and frequency compounding imaging, and various Doppler/duplex settings.[1,2,3,4,5,6]
In real-time compound sonography, for instance, the target tissue is imaged from different angles and multiple overlapping images are averaged to form one compound image. The theory is that because the lesion is viewed from multiple angles, signals from the true structure are added up, whereas artifactual echoes are eliminated. The result is a better, more realistic image, with reduced artifacts, better image contrast, and improved signal-to-noise ratio.
THI provides better image quality than conventional sonography and is based on the phenomenon of nonlinear distortion of acoustic signals as they travel through tissues. Harmonics consist of multiples of the fundamental or transmitted sound frequency. Higher harmonic frequencies are generated by the propagation of ultrasonic waves through tissues. A band-pass filter is used to process the received signal. The image obtained by THI displays reduced artifacts, improved signal-to-noise ratio, enhanced contrast, and better spatial resolution.[2,4,7,8,9,10]
Most of these techniques have been transferred to miniaturized US transducers mounted on the top of endoscopes dedicated to perform EUS in gastroenterology.[11] Optimization of color Doppler imaging techniques for EUS examinations is of great interest because its application requires experience and knowledge about the basic principles of Doppler phenomena.[6,12,13] For these purposes, factors such as adjustment of Doppler controls, Doppler angle, color gain, spectral wall filters, and others require special attention during EUS examinations.
Incorporating these advanced EUS imaging techniques in practice to obtain “the best possible image” in each patient may be time-consuming and even cumbersome. Hence, a practical guideline that may help to steer safely through the large quantity of technological properties and settings (knobology) is appreciated not only for novices but also for experienced endosonographers. For this purpose, we provide important practical tips and tricks for successful imaging adjustment during EUS frequent applications in the clinical setting.
BEFORE EUS BEGINS
Probe selection
Radial echoendoscopes have been available in the market for more than 30 years. Developed as an evolution of the original mechanical scanning echoendoscopes, the current models are equipped with an electronic array transducer with a frequency range of 5–13 MHz. They are preferred especially by beginners for their intuitive 360° anatomical imaging, which allows quick scan of the gastrointestinal wall and the surrounding organs.
Curvilinear echoendoscopes display an ultrasound field of view of 130°–180° that runs parallel to the main scope axis, thus allowing to visualize needles and other devices that are introduced through the working channel and provide an image with a comparable orientation like percutaneous ultrasound. They typically feature large therapeutic channels up to 4 mm, which allow EUS-guided therapeutic procedures using large-bore devices and stents.[14,15,16,17,18] Advantages and disadvantages of radial versus curvilinear EUS have been discussed in more detail in a recent publication.[19] Independently from the manufacturer, all modern echoendoscopes offer fundamental and THI, color Doppler, contrast ultrasound, and elastography.[20,21,22,23,24,25,26]
Application presets
Each transducer has several application presets (APs) that are usually predefined by the manufacturer's application specialists. APs provides good default settings and image optimization for several specific diagnostic targets. Beyond standard settings such as general EUS, specific APs for gastrointestinal wall, pancreatic, biliary, and deep field explorations are usually available. For an interested user, we do not believe those APs to be useful. We feel certain knowledge of the settings to be important to know. In addition, in most EUS indications, no special different setting is useful. The user should use (a) the best image possible and (b) certain adjustments to personal preferences. No commonly accepted preset differences are known, for example, pancreatic or mediastinal indications. Thus, every beginner should use a standard preset for every indication and modify this very single preset to its own preferences and not chose too much different presets.[27]
Transmission power
Transmission power is defined as the energy per unit of time acting on the insonated tissue (mW/cm2). In principle, an increase in transmission power improves the image quality. Sound waves have mechanical and thermal effects on the examined tissue, which are directly proportional to the transmission power. Even though US as a diagnostic technique is considered to be harmless and noninvasive, it is recommended to align the use of transmission power with the As Low as Reasonably Achievable (ALARA) principle, especially in the cases of pregnant women and children. By default, US systems operate at 100% power, which can be downregulated by moving the US power toggle switch by decremental 5% steps. The transmission power in color Doppler is adjustable from high to medium and low.
As EUS is used mostly in sedated patients in a very narrow field of indications and especially very rarely in pregnant women, power settings are very rarely modified. For upper GI indications and mediastinal malignancies, the transmission power will not be modified.
IMAGE OPTIMIZATION DURING B-MODE AND DOPPLER ULTRASOUND IMAGING
Image optimization is performed in three steps. The first step requires proper adjustment of the B-Mode image. Subsequently, the examiner uses color flow imaging in the region of interest (ROI). Lastly, spectral Doppler imaging is conducted in a small examination area, named “sample volume (SV)” or “gate,” that features a vessel of interest.
OPTIMIZATION OF B-MODE IMAGING
Do a survey scan
Both with radial and linear echoendoscopes, a preliminary B-mode imaging is carried out to perform a general investigation of the structures and organs of interest. With this information, further examination of specific structures and image optimization can be conducted in a targeted manner.
Adjust the image depth
To adjust the image depth, the user displays the structures of interest as large as possible on the screen (i.e., the object “fills” the screen). The user should also aim for the lowest achievable depth setting. Excessive depth decreases the frame rate and temporal resolution. If remote structures need to be examined, use of the zoom function reduces the size of the ROI and improves the frame rate and temporal resolution during B-mode imaging. In general, we move from “overview” with certain settings to more precise imaging, which requires specific modifications [Figures 1 and 2].
Figure 1.
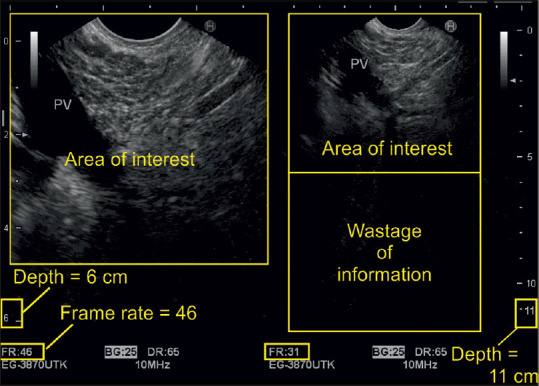
The image shows on the right side that setting the depth to 11 cm exceeds the area of interest by a wide margin. This leads to a lot of unnecessary information whose processing reduces the frame rate and temporal resolution. On the left side, adjustment of region of interest allows for much better resolution of the desired image
Figure 2.
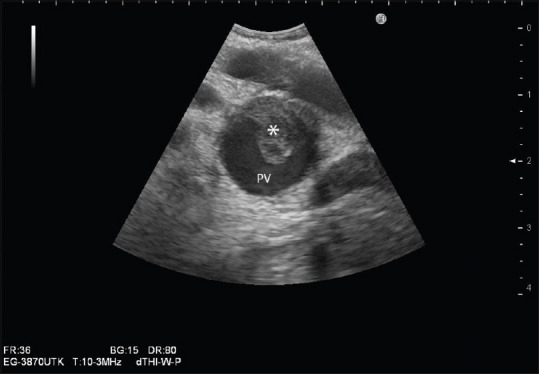
Portal vein thrombus (*): Use of the zoom function improves frame rate and temporal resolution
Adjust the transducer frequency
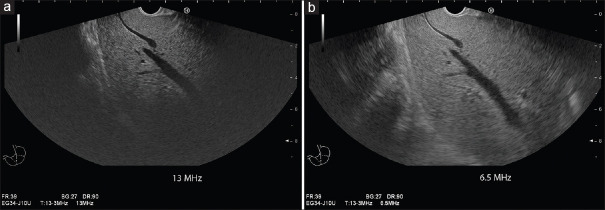
The examiner should use the lowest transducer frequency possible if maximal penetration is required. Higher frequencies are useful if high spatial resolution is needed. In general, if the object of interest is close to the transducer, minimal depth and highest frequency should be applied to improve the spatial resolution. Because high-frequency ultrasound waves have only a limited penetration depth, lower frequencies are selected for examining remote structures, for example, the liver [Figure 3]. We like to stress that EUS is no method for overview scanning. We also stress the fact that percutaneous US or computed tomography (CT) should be carried out before EUS, thus obtaining information about the patient's status.[19,23] EUS focuses on specific questions, justifying sedation and invasiveness according to the ALARA principle. Thus, overview is no real indication. Nevertheless, when a patient is sedated and the device is inserted, make the best out of the situation [Figure 1].
Figure 3.
Influence of transducer frequency on penetration depth: Using the highest frequency of 13 MHz, despite deep focus position, there is marked attenuation within the liver, and liver accessibility is limited to 4–5 cm depth. There is a high spatial resolution within the near field (a). Changing the frequency to 6.5 MHz improves liver accessibility markedly up to a depth of 7–8 cm at the cost of lower spatial resolution (b)
Adjust the ultrasound gain
Proper imaging requires the examiner to adjust the signal gain, which exists for each of the three US modalities (B-mode, color Doppler, and spectral Doppler). In most US processors, gain is regulated by clockwise or counterclockwise rotation of the respective controller (knob). In most instances, clockwise rotation leads to its amplification, whereas counterclockwise rotation leads toward its reduction. Initially, the operator chooses a B-mode gain of preference. If a Doppler examination is planned, the B-mode gain is kept as low as possible to leave enough pixels for the color flow imaging. In practice, the user should reduce the ultrasound gain for so long until the vessel lumen, which Doppler examination is planned for, is almost free of internal echoes [Figure 4].
Figure 4.
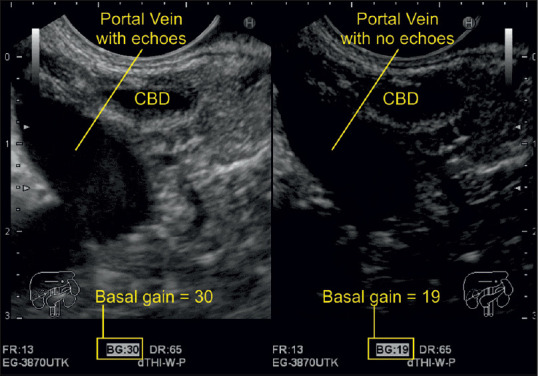
A decrease of gain from 30 to 19 caused the echoes from inside the portal vein to disappear. The right-sided image is optimized for vessel examination, whereas the left-sided images are optimized for studying its surrounding parenchymal organs
Adjust the focal zone
The sonographic focus is a point or an area where the best resolution is attained. It is comparable to the focus of a beam of light where the narrowest part of the beam provides the best resolution. The focus depth is usually visualized on the side of the screen as an arrow and can be manually moved up and down to the desired location. A single focus results in a point of higher lateral resolution than the surrounding field of view. A dual focus translates into an area of increased lateral resolution. The latter improves the spatial resolution of the area, but doubles the travel distance, reduces the frame rate by half, and consequentially brings the temporal resolution down compared to a single focus examination. The frame rate should be maintained above 20 frames per second (FPS) to safeguard a reasonable temporal resolution [Figures 5 and 6].
Figure 5.
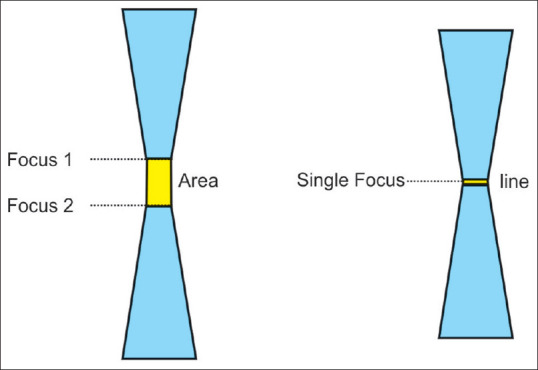
Single-focus zones are on a line, whereas dual-focus zones constitute an area where the ultrasound waves are narrowest. It is the site of best resolution
Figure 6.
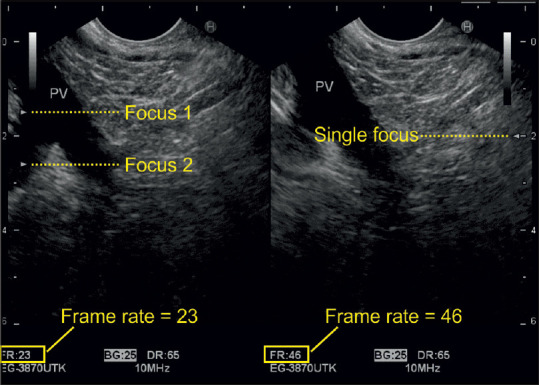
The frame rate is doubled once the user switches from dual to single focus. However, in this case, there was no need to do so, as the frame rate was already above 20 frames per second
Apply compound imaging
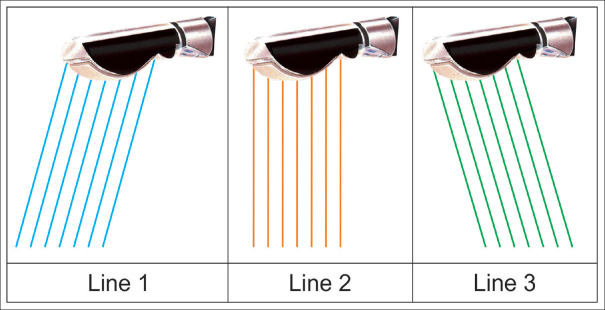
In conventional B-mode sonography, each image is obtained from a single angle of insonation, whereas in “compound imaging,” each sonographic picture is composed of multiple frames. In “spatial compounding,” multiple coplanar frames are recorded from different angles. The echoes from these multiple acquisitions are processed into a single composite image in real time. Characteristically, the frame margins are the same for each steering angle, but the noise and speckle position alternate in each frame. Spatial compounding averages the noise out, makes the image margins smooth, and reduces speckle due to graininess. Moreover, it leads to a better resolution at the central oval region where the frames from all steering angles overlap. There is less improvement of the image quality in the periphery where fewer frames overlap. Another compound imaging technique, the so-called “frequency compounding,” uses different transmitter frequencies to acquire multiple frames that are processed into a final composite image [Figuress 7 and 8].
Figure 7.
The figure shows that the same crystal can send beams in different directions (spatial compound imaging). The change in direction can be 5°–10°
Figure 8.
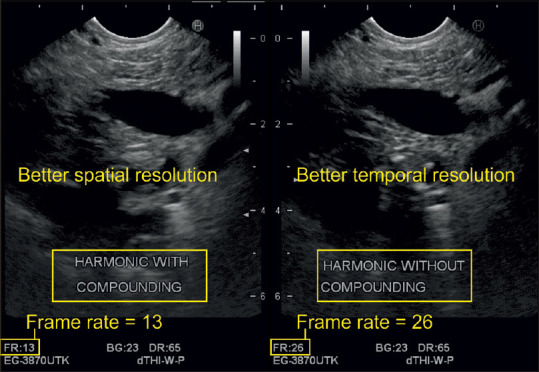
Compound imaging improves the spatial resolution but reduces the frame rate by half in this case
Apply tissue harmonic imaging
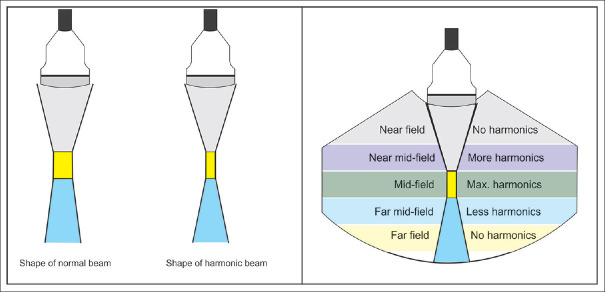
Transducers transmit waves at a basic frequency. The returning signal contains a mixture of the basic and harmonic frequencies. Harmonics are positive integral multiples of the fundamental frequency. The software of the latest US systems can filter incoming frequencies and render only information from certain harmonics into final pictures, a process called THI, which improves image resolution regarding all its main features. Harmonics are generated by the interaction of the sound wave with the tissue and they travel only once to reach the probe. Hence, they are associated with less clutter, noise, and artifacts. It has been previously shown that THI improves the image quality during radial EUS examinations. Especially delineation of pancreatic cystic lesions and in particular septae and nodules improves significantly with THI.[2,3,4] For test purposes, the operator can intermittently switch the THI function on and off to assess the best resolution of the image on the screen before acquiring it. Most of the modern devices do not require switching it off [Figure 9].
Figure 9.
The shape of a normal and harmonic ultrasound beam from a percutaneous probe (the same applies to the echoendoscope ultrasound transducer). Maximum harmonics are generated at the focus that translate into a superior resolution in the focal zone
OPTIMIZATION OF COLOR DOPPLER IMAGING
Activate the color-sampling box
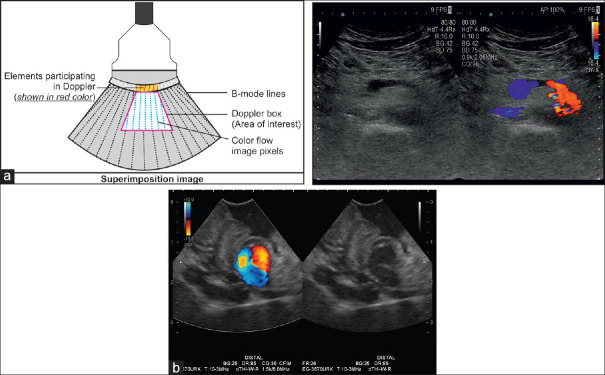
The “color-sampling box” (also color box) marks the area of interest within the gray-scale sonogram where the operator can apply color Doppler signals to examine blood flow patterns. In this box, the Doppler information is superimposed over the gray-scale B-mode image as several thousand color pixels. In the merged image, the resolution of the underlying B-mode picture is reduced through a noticeable downgrade of the FPS and the number of lines for its creation.
Choose the most appropriate color Doppler mode
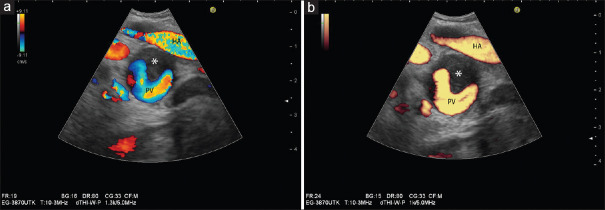
Most US machines used for EUS provide the opportunity to choose among two or more Doppler modes: traditional color Doppler imaging (CDI), color Doppler velocity (CDV), and color Doppler energy (CDE; power Doppler; angio mode). Using CDV, all the three basic flow information are displayed, namely flow direction (red: to the transducer; blue: away from the transducer), flow velocity (color tone or color brightness), and distribution of velocities within the vessel (represented by different colors within the vessel). With CDE, the information is restricted to flow intensity (one color, with brightness related to flow intensity). Sometimes, also the flow direction is displayed. Compared to CDV, CDE is more sensitive and less dependent from Doppler angle [Figures 10-12].
Figure 10.
Comparison between color Doppler velocity and color Doppler energy in a case of partial thrombosis (*) of the portal vein: Color Doppler velocity provides information on flow direction, flow velocities, and distribution of flow velocities within vessels (a). Note the higher velocity in the hepatic artery (hepatic artery showing alias phenomenon) compared to the portal vein, different directions of blood flow (red and yellow: onto the transducer; blue: away from the transducer). Color Doppler energy displays flow independent of direction (b)
Figure 12.
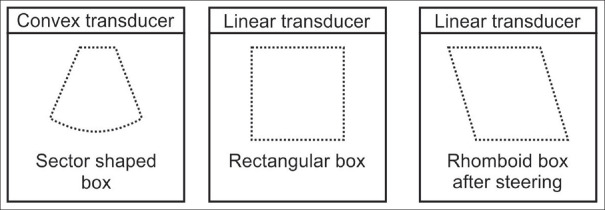
Different shapes of the color-sampling box depending on transducer type. Each transducer type has a distinct shape of the sampling box. It is square or rhomboid in linear transducers and sector shaped in curvilinear probes. Linear transducers are not available for flexible EUS
Figure 11.
The color box is superimposed on the B-mode sonogram. In the resulting merged image, few elements are responsible for color formation only (a). As shown in this example of a gastric varix, flow onto the transducer is coded red; flow away from the transducer is coded blue (b)
Adjustment of Doppler controls
Color Doppler imaging requires the examiner to adjust primary and secondary Doppler controls. Primary Doppler controls comprise the color box size, color box angle, color gain, pulse repetition frequency (PRF), and “invert” control. Secondary Doppler controls entail the wall filter, Doppler frequency, and write priority. For routine operations in Doppler imaging, there are four primary Doppler controls of particular importance, that is, the color box size and angle, color gain, and the PRF.
Adjust the color box size
The controls on the dashboard help the user change the shape and position of the color box [Figure 13].
Figure 13.
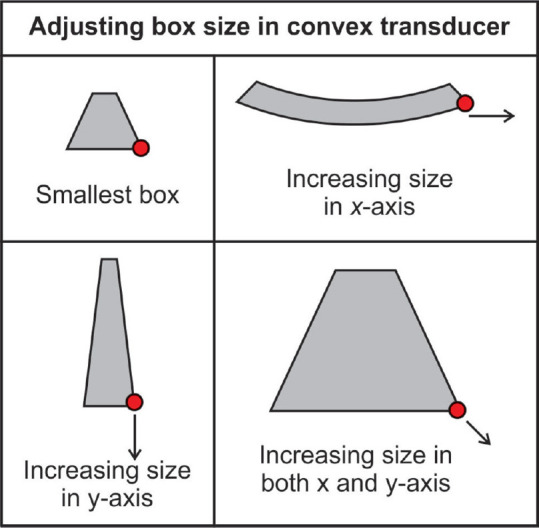
The user can manually scale the color box size by dragging the right lower corner of the box along the X- and Y-axis with the trackball or touchpad
Adjust the Doppler insonation angle
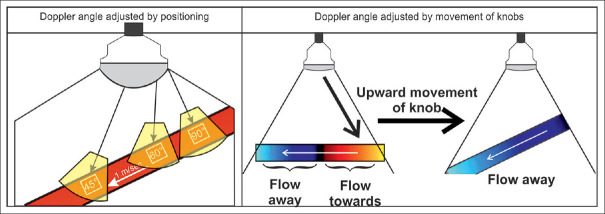
The Doppler angle is defined as the angle between the axis of the arriving ultrasonic signal and the direction of moving blood cells along the vascular axis. In color Doppler, the angle rests in between the sampling box and the blood flow direction. In spectral Doppler, the angle lies in between the axis of the Doppler beam and the course of the blood flow. With radial and curvilinear transducers used with EUS, the Doppler angle may be adjusted only by angulating the tip of the scope [Figures 14 and 15].
Figure 14.
In color Doppler imaging, the examiner should first move the probe to improve the Doppler angle (<60°). Afterward, fine adjustments are practicable by using the respective control/knob. This is true for conventional transcutaneous and EUS
Figure 15.
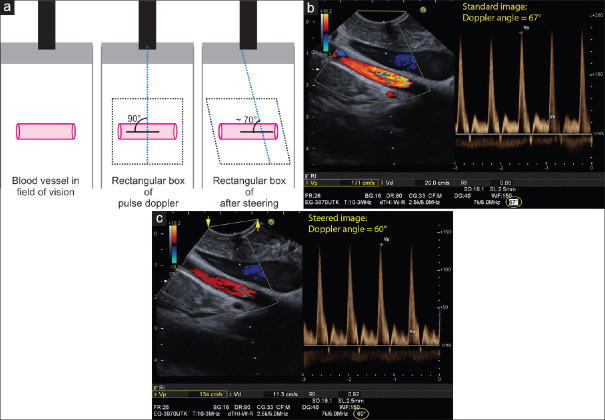
The saying goes: “A sleeping vessel is the sonographer's enemy and a standing vessel his/her friend.” The vascular structure in this figure, dubbed a “sleeping vessel,” lies at a 90° angle in the field of vision in parallel to the crystal arrays of the linear probe. Initially, the examiner should attempt to reduce the Doppler angle below 60° by re-positioning the probe. The more perpendicular the vascular structure is geared toward the probe (standing vessel), the better the Doppler signal becomes. If this maneuver fails to improve the orientation, technical shifting of the angle of insonation, image steering) might help (a). The example shows measurement of flow velocity in the superior mesenteric artery. After optimal positioning of the probe, an insonation angle of 67° results. The measured peak systolic velocity of 171 cm/s is not correct (b). Using the “image steering” function, an insonation angle of 60° is possible with more reliable measurement of peak systolic velocity of 134 cm/s (c)
Adjust the color gain
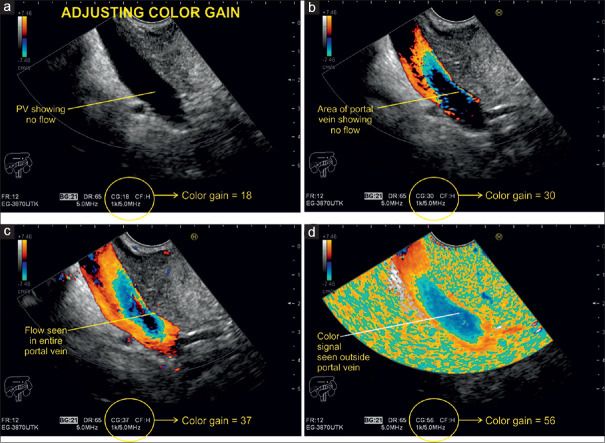
Initially, the operator should optimize the insonation angle, followed by adjusting the PRF. Finally, the gain will be increased excessively for a technical phenomenon, called “color bleed” or “blooming,” which refers to a flurry of color pixels outside the vascular lumen. This extraluminal signal is called noise. Then, the gain is subsequently decreased until the noise disappears, but the lumen should then still be completely filled with color signals [Figure 16].
Figure 16.
Doppler examination of the portal vein with different signal gain settings. In this case, a color gain of 18 shows no flow within the portal vein, whereas a color gain of 56 leads to a flurry of pixels outside of it, the so-called “color bleed” or “blooming”
Adjust the velocity scale/pulse repetition frequency
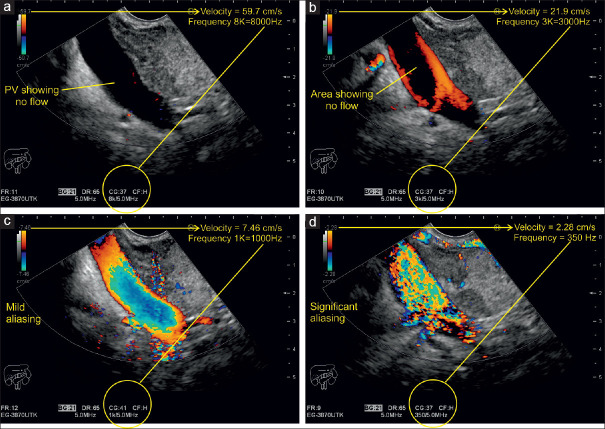
After activating the color-sampling box, a “color bar” or “color map” appears on the side of the screen, which is divided into two equal parts by a black bar that marks the baseline or point of zero flow on the Doppler spectrum. Red color represents a positive positional shift of a given signal (toward the probe) above the baseline and blue color stands for a negative positional shift (away from the probe) below the baseline. The lower the magnitude of such a change of positions in a specific time (i.e., velocity), the darker the shading of red and blue becomes. Accordingly, brighter shadings display positional shifts of higher magnitude or higher velocities. The extremes of the color bar are marked by the maximum (positive) and minimum (negative) velocity in centimeter per second. This value indicates the highest measurable limit for a given Doppler signal shift and is known as the Nyquist limit (half the Doppler PRF). In general, there are two indications for CDI: (a) to display the direction and perfusion of a large vessel and (b) to analyze the perfusion of a certain ROI. In EUS, b) is often the indication (solid tumor vascularization). Thus, PRF is mostly optimized to analyze the microvascularization or maybe perfusion of a ROI. Thus, it is of importance to lower the frequency so that it does enable the investigator not to fail to display even small vessels in a certain ROI [Figures 17 and 18].
Figure 17.
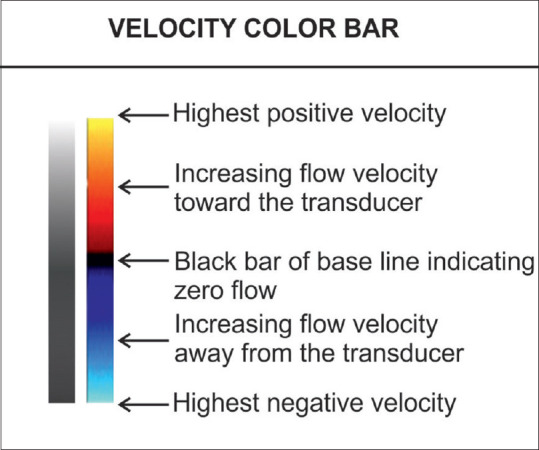
The red color indicates movement toward the transducer, whereas blue illustrates movement away from the probe. The shades of color closer to the baseline are darker. The extremes of the bar mark the Nyquist limit
Figure 18.
A Doppler examination of the portal vein with different pulse repetition frequency settings and their effect on the illustration of the blood flow. At high peak velocity of 59.7 cm/s and PRF of 8000 kHz, no flow can be detected (a). After reducing the peak velocity to 21.9 cm/s, blood flow is only detectable near the wall because of high-amplitude and low-frequency movements along the vascular walls. The lumen appears void because the high-frequency shift there corresponds to a velocity beyond the illustrated spectrum (b). Further reduction of the peak velocity leads to full-scale coloring of the entire venous lumen with increasing intensity near the center where lighter signals indicate a higher frequency shift and hence higher velocity (c). Even further reduction of the peak velocity to 7.46 cm/s makes color signals to appear outside the portal vein. A white color change becomes evident, the so-called “aliasing” (d)
Velocity and PRF are parameters for measuring Doppler shifts. Velocity is expressed as centimeter per second and PRF is measured in kilohertz (kHz). Both are directly proportional, that is, increasing the velocity scale increases the PRF and vice versa. The scales including their peak values appear at the bottom or on the side of the screen upon activation of the color and spectral Doppler function. The examiner can manually adjust the range of the scale relative to the vascular structure of interest. In general, measurements in arteries require a higher velocity scale, whereas for venous blood flow examinations, a lower velocity spectrum is recommended. Scales with a wider range cannot portray the velocity in veins adequately, whereas the use of low-range scales for intra-arterial measurements results in “aliasing,” which happens when the measured frequency shift exceeds half the PRF of the peak velocity on the scale.
Apply invert control
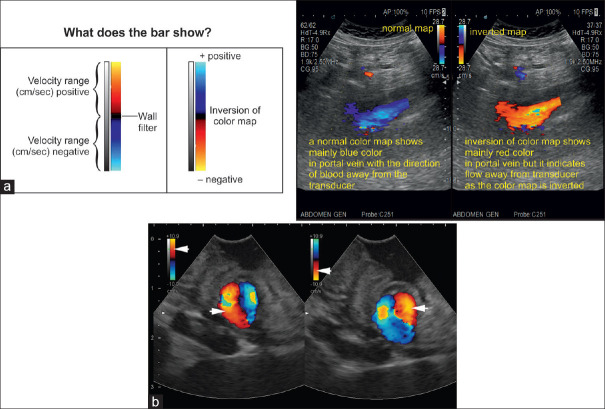
On a red/blue scale, the positive half of the range can be either red or blue depending on the sonographer's preference. Flow toward the transducer typically appears in red. The color scale can be inverted by simply pushing the “invert” button. The inversion may complicate the interpretation of the flow direction if the operator is not aware that the color bar has been inverted. Therefore, the flow direction should be interpreted based on the setting of the color bar [Figure 19].
Figure 19.
The ultrasound image is included to show how an inversion of color bar can change the color within the vessel. This inversion of color is given as a function in all ultrasound machines and generally the inversion has no practical significance (a). Inversion of Doppler colors in a frozen image of a small gastric varix: on the left part of the image, red is on top of the color bar (arrowhead), and inflow in the varix (directed onto the transducer) is coded red (arrowhead). On the right part of the image, the color box was inverted, with red now displayed at the bottom (arrowhead). Therefore, now, outflow from the varix (away from the transducer) is coded red (arrowhead) (b)
ADJUSTMENT OF SECONDARY COLOR DOPPLER CONTROLS
Adjust the color Doppler wall filter
Blood flow stimulates the vascular walls and the surrounding tissue. Doppler echoes are generated both by interference with the moving red blood cells (RBCs) and by oscillation of the vascular walls and the surrounding tissue (pulsations). For blood flow analysis, the focus is on echoes from the moving RBCs, which have low energy (amplitude) but produce high-frequency Doppler shift signals by moving at a fast pace within the blood vessel lumen. In comparison, Doppler echoes emitted by oscillating vascular walls and tissue are very strong (with an amplitude ~100 times stronger than the signal of the moving RBCs) but produce low-frequency signals. Wall filters eliminate the interfering high-amplitude and low-frequency signals from these sources. Coincidentally, they can cut out other diagnostically relevant information from very slowly moving RBCs, which are why this function should be applied with caution, especially in low-flow scenarios (e.g., examinations of the portal vein [PV] in patients with portal hypertension). Higher settings of wall filters are usually chosen for arterial examinations and lower settings for venous measurements. Typical wall filter settings are <25–50 Hz for venous flow and <50–100 Hz for arterial flow [Figure 20].
Figure 20.
In low-flow scenarios like the examination of a portal vein in this picture, the wall filter should not be set too high as it may inadvertently lead to cutting out relevant blood flow signals
Adjust the Doppler frequency
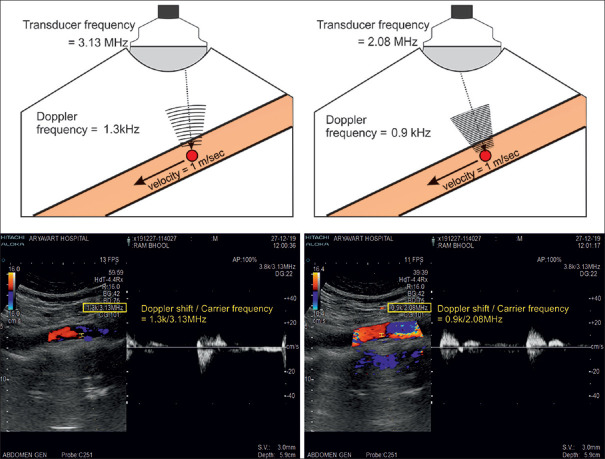
The Doppler frequency shift is proportional to the Doppler transmission frequency. The higher the transmission frequency, the higher the Doppler shift becomes. In general, in color mode, it is recommended to start the examination with the lowest frequency that the transducer provides. In most cases, the preset frequency works well. Whenever the flow velocity is low, higher frequencies can be used to improve the sensitivity of flow detection [Figure 21].
Figure 21.
The figure illustrates that Doppler frequency shift and transmission frequency are directly proportional
Adjust the “write priority” function
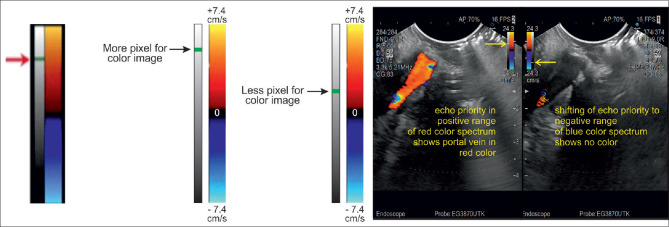
The “color priority” function determines whether the B-mode or color Doppler signal, that are both detected at the same location, will be displayed on the final pixel. Low priority (for color) implies more B-mode information and less color. Accordingly, higher priority gives weight to color Doppler data to the detriment of B-mode information. The write priority should be used if the color Doppler box is small as the color is more prominently reflected than within wider margins. The threshold for “gray-scale priority” (or tissue priority) function is predefined by the machine manufacturer. It is usually specified by a small horizontal bar on a vertical gray-scale indicator located alongside the color scale. Usually, the value is relatively high to optimize the display of color, but the user can adjust it. Raising the threshold favors more color in the place of gray scale [Figure 22].
Figure 22.
The gray-scale bar sits left of the color scale. The arrow marks the threshold, which indicates whether more or less pixels are used for the color image
OPTIMIZATION OF SPECTRAL DOPPLER IMAGING
The combination of the two imaging modalities, “pulsed-wave (PW) Doppler” (or spectral Doppler) and real-time B-mode imaging, is called “duplex Doppler imaging.“[6,28] Concurrent color Doppler imaging coupled with the duplex Doppler mode is referred to as “triplex imaging.” As for duplex Doppler, two imaging modalities (B-mode and spectral Doppler) run in alternation and when it comes to triplex imaging, three applications (B-mode, color Doppler, and spectral Doppler) operate side by side, which takes up a lot of computing power. In older US devices, this comes at the expense of spatial and temporal resolution that can be improved by freezing the B-mode and color Doppler image, allowing all computational resources to be allocated to spectral Doppler imaging.
Activate the axis
By pressing the “PW” (pulsed wave) Doppler button, a dotted line that represents the insonation axis and two bars marking the so-called “SV” (or “gate”) appear on the screen [Figure 23].
Figure 23.
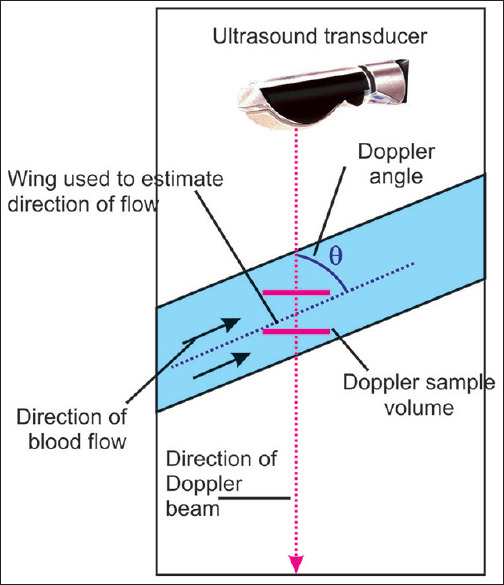
After activating the spectral Doppler function, the insonation axis and Doppler sample volume (gate) are visualized on the screen
Position the depth of the gate
The examiner can shift the insonation axis and the gate with the trackball to the area of interest. The gate depth eventually determines the PRF and velocity scale. As the imaging depth increases, the PRF decreases. Vascular structures in deeper parts of the sonogram can only be assessed at lower PRF and velocity range.
Adjust the size of the gate/sample volume
The Doppler SV refers to the frequency spectrum from a specific location. The sample size or gate should fill the vessel lumen without touching its walls (~2/3rd of the vessel diameter). Making the SV wider captures more slow-flow components near the walls, thus producing a noisy frequency shift spectrum and blurring of the spectral Doppler graph.
Adjust the Doppler angle
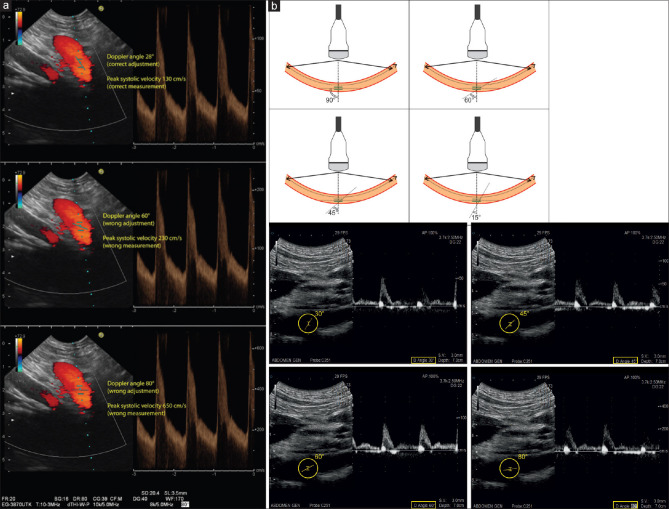
The examiner can adjust the Doppler angle by using the respective switch control on the dashboard. Velocity measurements are only reliable if the Doppler angle is <60°. Adjustment is necessary if the Doppler angle is between 30° and 60° [Figure 24].
Figure 24.
The Doppler angle can be changed by moving the spectral Doppler switch control. With correct adjustment of the Doppler angle to 28° in line with the course of the vessel (celiac trunk), peak systolic velocity is measured properly with 130 cm/s (a). Wrong adjustment of Doppler angles to 60° (b) or to 80° (c) results in wrong measurements of peak systolic velocity (230 and 650 cm/s, respectively)
Adjust the gain
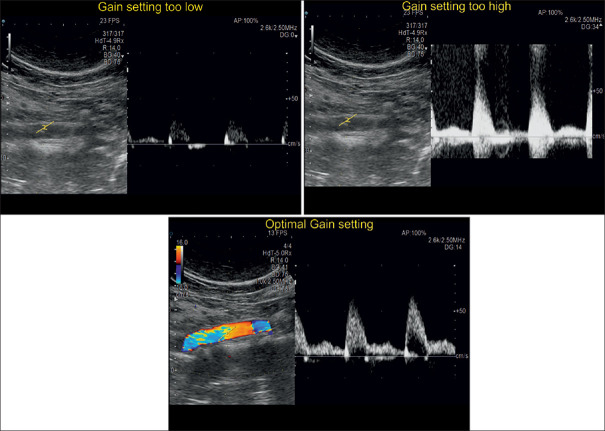
The user should optimize the insonation angle first, followed by adjustment of the PRF and thirdly the Doppler gain will be adjusted with the respective rotary control to the end of solely visualizing the spectral Doppler graph without additional frequencies [Figure 25].
Figure 25.
Different signals gain settings during a spectral Doppler examination. The optimal adjustment leads to a clearly visualized blood flow pattern
Adjust the pulse repetition frequency/velocity scale
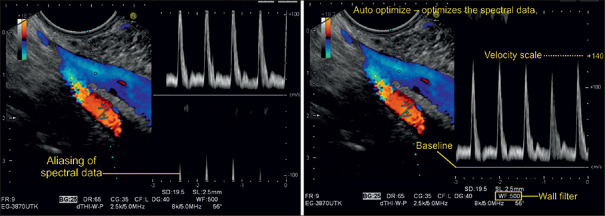
The spectral Doppler PRF automatically appears on the screen after activating the spectral Doppler function. In duplex Doppler imaging, at least two modalities (B-mode and spectral Doppler mode) fire in alternation, so there are two PRFs. As for triplex imaging, there are three PRFs accordingly. The PRF can vary from 1 to 10 kHz and depends on the distance between the structure of interest and the transducer. Most US devices optimize the PRF automatically as soon as that distance is changed. If the PRF is too low compared to the predominant Doppler shift, “aliasing” can occur. To avoid this phenomenon, while maintaining the same view, the PRF (and the Nyquist limit) can manually be increased by using the rotary control. This leads to a wider range of the visualized velocity scale [Figures 26 and 27].
Figure 26.
Spectral Doppler examination of the mesenteric vein, which is depicted mainly in blue color. The “negative” velocity spectrum (blood moving away from the probe) correlates with the hepatopetal flow pattern that is a normal finding for the mesenteric vein. The superior mesenteric artery shows a color change from light orange to light blue, which indicates aliasing. The upper limit of the velocity scale is 18.2 cm/s. Higher velocity measurements are inaccurate and appear negative (aliasing effect), as the PRF is too low in comparison to the measured Doppler shift. To avoid aliasing, the PRF requires adjustment. In newer ultrasound systems, the auto optimization function spontaneously adjusts the baseline for spectral Doppler to picture the graph without an offset
Figure 27.
The left image shows excessive gain with the resulting background noise by additional frequencies. In the right illustration, the gain setting is better which leads to a sharper spectral Doppler graph. The color code shows an aliasing effect, which is most likely explained by a directional change of the vessel
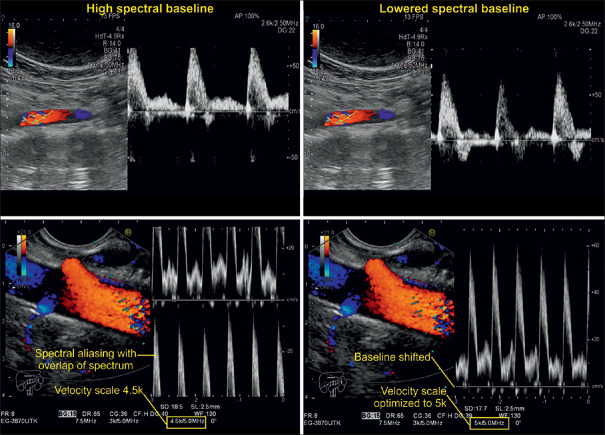
Adjust the baseline
Manual adjustment of the baseline is useful for better appearances of the spectral Doppler graph and may hereby help prevent spectral aliasing from happening, especially in high-velocity measurements such as arterial blood flow examinations. Unlike modifying the PRF, it does not alter the range of the velocity scale [Figure 28].
Figure 28.
Triplex imaging examinations of abdominal vessels. The two illustrations on the left depict spectral Doppler graphs whose peaks appear cut off and folded over to the negative side of the spectrum (spectral aliasing). After lowering the baseline, the graphs on the right-sided images are visualized in their entirety without any offsets. Note that the velocity scale and color coding do not differ in the images taken before and after the baseline adjustment
Adjust the spectral wall filter
Modern US machines provide a wider range of wall filters for spectral Doppler than for color or power Doppler imaging. The spectral wall filter should be chosen with the objective of eliminating interfering low-frequency wall movements (pulsations) without filtering the blood flow signal of interest [Figure 29].
Figure 29.
Spectral Doppler imaging with wall filter settings of increasing sensitivity. Wall filter 1 (image on the left) does not filter out low-frequency signals generated by vascular wall movements, which are displayed prominently alongside the spectral Doppler graph. At the other end of the sensitivity spectrum, wall filter 8 (illustration in the middle) eliminates low-frequency information from both the vascular walls and the central blood flow signal, which translates into a faint, discontinuous spectral Doppler graph. Wall filter 3 (image on the right) is the setting of choice, which suppresses almost exclusively low frequencies from vascular wall movements
Adjust the transmission frequency
Some US processors allow the user to adjust the transmission frequency. By using lower Doppler frequencies, the user can measure higher blood flow velocities without aliasing and can examine vascular structures at greater depth.
“Enter” button
By using the “enter” button, the user pauses and reactivates the spectral Doppler mode. Upon reactivation, the system updates the image and automatically optimizes the spectral data by adjusting the velocity scale/PRF as well as the baseline.
Listen to the audible signal
Doppler frequency shifts are fortuitously within the range of human hearing (20 Hz–20 kHz). The Doppler signal reflected of moving blood particles is detected by the probe and processed into an audible sound by the US system.
Special situations during Doppler imaging
Adjustments for color Doppler in the case of too much color or high flow:
Decrease color gain
Increase color velocity scale.
Adjustments for color Doppler in the case of lacking color or low flow:
Highest gain without background noise (increase color, power, and pulsed Doppler gain)
Decrease color velocity scale/PRF
Optimize Doppler angle (below 60°)
Increase the range of Doppler shift in one direction by shifting the baseline
Downsize the color box
Choose the wall filter with the lowest sensitivity acceptable
Try higher basic frequency for color Doppler
Set color priority to “high”
Set the focus at the level of interest
Increase the persistence
Increase the SV gate.
For optimizing contrast-enhanced ultrasound[29] and elastography settings,[30,31,32] we refer to the published literature.
CONCLUSIONS
Maximizing image quality of EUS frames during examinations is very helpful to differentiate tissue structures within the GI tract and its surrounding organs. To obtain optimal EUS images, some knowledge about the different physical properties of the EUS equipment, machine components, and basic physical ultrasound including Doppler principles is required. Ultrasound skills enable the physician to obtain better video signals and facilitate storage of high-quality images, which may enhance the diagnostic quality and outcome of patients' examinations in the clinical setting. This comprehensive review focuses on optimal preparation setup such as transducer selection, choice of AP, and transmission power. In addition, many detailed parameter settings including adjustment of Doppler controls, Doppler angle, color gain, spectral wall filters, and others are reported and specific recommendations are provided. Optimization of B-mode imaging, Doppler spectral imaging, and the associated techniques requires dedication to these parameter settings, but as reward, results will eventually show elucidated video sequences and still images with high resolution and a lot of useful diagnostic information.
Financial support and sponsorship
The authors acknowledge support from the Bad Mergentheimer Leberzentrum e.V.
Conflicts of interest
There are no conflicts of interest.
REFERENCES
- 1.Dietrich CF, Bartsch L, Turco V, et al. Knöpfologie in der B-Bild-Sonografie. Gastroenterologie up 2date. 2018;14:347–64. [Google Scholar]
- 2.Ishikawa H, Hirooka Y, Itoh A, et al. A comparison of image quality between tissue harmonic imaging and fundamental imaging with an electronic radial scanning echoendoscope in the diagnosis of pancreatic diseases. Gastrointest Endosc. 2003;57:931–6. doi: 10.1016/s0016-5107(03)70037-6. [DOI] [PubMed] [Google Scholar]
- 3.Ohno E, Kawashima H, Hashimoto S, et al. Current status of tissue harmonic imaging in endoscopic ultrasonography (EUS) and EUS-elastography in pancreatobiliary diseases. Dig Endosc. 2015;27(Suppl 1):68–73. doi: 10.1111/den.12433. [DOI] [PubMed] [Google Scholar]
- 4.Matsumoto K, Katanuma A, Maguchi H, et al. Performance of novel tissue harmonic echo imaging using endoscopic ultrasound for pancreatic diseases. Endosc Int Open. 2016;4:E42–50. doi: 10.1055/s-0034-1393367. [DOI] [PMC free article] [PubMed] [Google Scholar]
- 5.Bang JY, Hawes RH, Varadarajulu S. Objective evaluation of a new endoscopic ultrasound processor. Dig Endosc. 2013;25:554–5. doi: 10.1111/den.12148. [DOI] [PubMed] [Google Scholar]
- 6.Jenssen C, Kubale R, Bartsch L, et al. Knöpfologie in der Doppler-Sonografie. Gastroenterologie up2date. 2019;15:43–46. [Google Scholar]
- 7.Fusaroli P, Saftoiu A, Dietrich CF. Contrast-enhanced endoscopic ultrasound: Why do we need it.A foreword? Endosc Ultrasound. 2016;5:349–350. doi: 10.4103/2303-9027.193596. [DOI] [PMC free article] [PubMed] [Google Scholar]
- 8.Anvari A, Forsberg F, Samir AE. A primer on the physical principles of tissue harmonic imaging. Radiographics. 2015;35:1955–64. doi: 10.1148/rg.2015140338. [DOI] [PubMed] [Google Scholar]
- 9.Ihnatsenka B, Boezaart AP. Ultrasound: Basic understanding and learning the language. Int J Shoulder Surg. 2010;4:55–62. doi: 10.4103/0973-6042.76960. [DOI] [PMC free article] [PubMed] [Google Scholar]
- 10.Fusaroli P, Saftoiu A, Mancino MG, et al. Techniques of image enhancement in EUS (with videos) Gastrointest Endosc. 2011;74:645–55. doi: 10.1016/j.gie.2011.03.1246. [DOI] [PubMed] [Google Scholar]
- 11.Hocke M, Ignee A, Topalidis T, et al. Contrast-enhanced endosonographic Doppler spectrum analysis is helpful in discrimination between focal chronic pancreatitis and pancreatic cancer. Pancreas. 2007;35:286–8. doi: 10.1097/MPA.0b013e318093f964. [DOI] [PubMed] [Google Scholar]
- 12.Ignee A, Gebel M, Caspary WF, et al. Doppler imaging of hepatic vessels Review. Z Gastroenterol. 2002;40:21–32. doi: 10.1055/s-2002-19633. [DOI] [PubMed] [Google Scholar]
- 13.Dietrich CF, Ignee A, Seitz KH, et al. Duplex sonography of visceral arteries. Ultraschall Med. 2001;22:247–57. doi: 10.1055/s-2001-18923. [DOI] [PubMed] [Google Scholar]
- 14.Fusaroli P, Jenssen C, Hocke M, et al. EFSUMB Guidelines on Interventional Ultrasound (INVUS), Part V EUS-guided therapeutic interventions (short version) Ultraschall Med. 2016;37:412–20. doi: 10.1055/s-0035-1553742. [DOI] [PubMed] [Google Scholar]
- 15.Jenssen C, Hocke M, Fusaroli P, et al. EFSUMB Guidelines on Interventional Ultrasound (INVUS), Part IV EUS-guided interventions: General aspects and EUS-guided sampling (short version) Ultraschall Med. 2016;37:157–69. doi: 10.1055/s-0035-1553788. [DOI] [PubMed] [Google Scholar]
- 16.Fusaroli P, Jenssen C, Hocke M, et al. EFSUMB Guidelines on Interventional Ultrasound (INVUS), Part V. Ultraschall Med. 2016;37:77–99. doi: 10.1055/s-0035-1553738. [DOI] [PubMed] [Google Scholar]
- 17.Jenssen C, Hocke M, Fusaroli P, et al. EFSUMB Guidelines on Interventional Ultrasound (INVUS), Part IV EUS-guided interventions: General aspects and EUS-guided sampling (Long Version) Ultraschall Med. 2016;37:E33–76. doi: 10.1055/s-0035-1553785. [DOI] [PubMed] [Google Scholar]
- 18.ASGE Technology Committee, Murad FM, Komanduri S, et al. Echoendoscopes. Gastrointest Endosc. 2015;82:189–202. doi: 10.1016/j.gie.2015.02.017. [DOI] [PubMed] [Google Scholar]
- 19.Dietrich CF, Arcidiacono PG, Braden B, et al. What should be known prior to performing EUS exams.(Part II)? Endosc Ultrasound. 2019;8:360–9. doi: 10.4103/eus.eus_57_19. [DOI] [PMC free article] [PubMed] [Google Scholar]
- 20.Yusuf TE, Tsutaki S, Wagh MS, et al. The EUS hardware store: State of the art technical review of instruments and equipment (with videos) Gastrointest Endosc. 2007;66:131–43. doi: 10.1016/j.gie.2006.03.935. [DOI] [PubMed] [Google Scholar]
- 21.Dietrich CF, Jenssen C. Modern ultrasound imaging of pancreatic tumors. Ultrasonography. 2020;39:105–13. doi: 10.14366/usg.19039. [DOI] [PMC free article] [PubMed] [Google Scholar]
- 22.Dietrich CF, Hocke M. Elastography of the pancreas, current view. Clin Endosc. 2019;52:533–40. doi: 10.5946/ce.2018.156. [DOI] [PMC free article] [PubMed] [Google Scholar]
- 23.Dietrich CF, Arcidiacono PG, Braden B, et al. What should be known prior to performing EUS? Endosc Ultrasound. 2019;8:3–16. doi: 10.4103/eus.eus_54_18. [DOI] [PMC free article] [PubMed] [Google Scholar]
- 24.Hocke M, Braden B, Jenssen C, et al. Present status and perspectives of endosonography 2017 in gastroenterology. Korean J Intern Med. 2018;33:36–63. doi: 10.3904/kjim.2017.212. [DOI] [PMC free article] [PubMed] [Google Scholar]
- 25.Dietrich CF, Burmeister S, Hollerbach S, et al. Do we need elastography for EUS? Endosc Ultrasound. 2020;9:284–90. doi: 10.4103/eus.eus_25_20. [DOI] [PMC free article] [PubMed] [Google Scholar]
- 26.Saftoiu A, Napoleon B, Arcidiacono PG, et al. Do we need contrast agents for EUS? Endosc Ultrasound. 2020 doi: 10.4103/eus.eus_20_20. DOI: 10.4103/eus.eus_20_20. [DOI] [PMC free article] [PubMed] [Google Scholar]
- 27.Lim AK, Moran CM, Dietrich CF. EFSUMB Course Book. In: Dietrich CF, editor. Ultrasound "Knobology". 2nd ed. London: EFSUMB; 2020. pp. 1–24. [Google Scholar]
- 28.Zander D, Huske S, Hoffmann B, et al. Ultrasound Image Optimization (“Knobology”): B-Mode. Ultrasound Int Open. 2020;6:E14–E24. doi: 10.1055/a-1223-1134. [DOI] [PMC free article] [PubMed] [Google Scholar]
- 29.Dietrich CF, Averkiou M, Nielsen MB, et al. How to perform Contrast-Enhanced Ultrasound (CEUS) Ultrasound Int Open. 2018;4:E2–15. doi: 10.1055/s-0043-123931. [DOI] [PMC free article] [PubMed] [Google Scholar]
- 30.Săftoiu A, Gilja OH, Sidhu PS, et al. The EFSUMB guidelines and recommendations for the clinical practice of elastography in non-hepatic applications: Update 2018. Ultraschall Med. 2019;40:425–53. doi: 10.1055/a-0838-9937. [DOI] [PubMed] [Google Scholar]
- 31.Dietrich CF, Bibby E, Jenssen C, et al. EUS elastography: How to do it? Endosc Ultrasound. 2018;7:20–8. doi: 10.4103/eus.eus_49_17. [DOI] [PMC free article] [PubMed] [Google Scholar]
- 32.Dietrich CF, Barr RG, Farrokh A, et al. Strain elastography How to do it? Ultrasound Int Open. 2017;3:E137–49. doi: 10.1055/s-0043-119412. [DOI] [PMC free article] [PubMed] [Google Scholar]


