FIGURE 1.

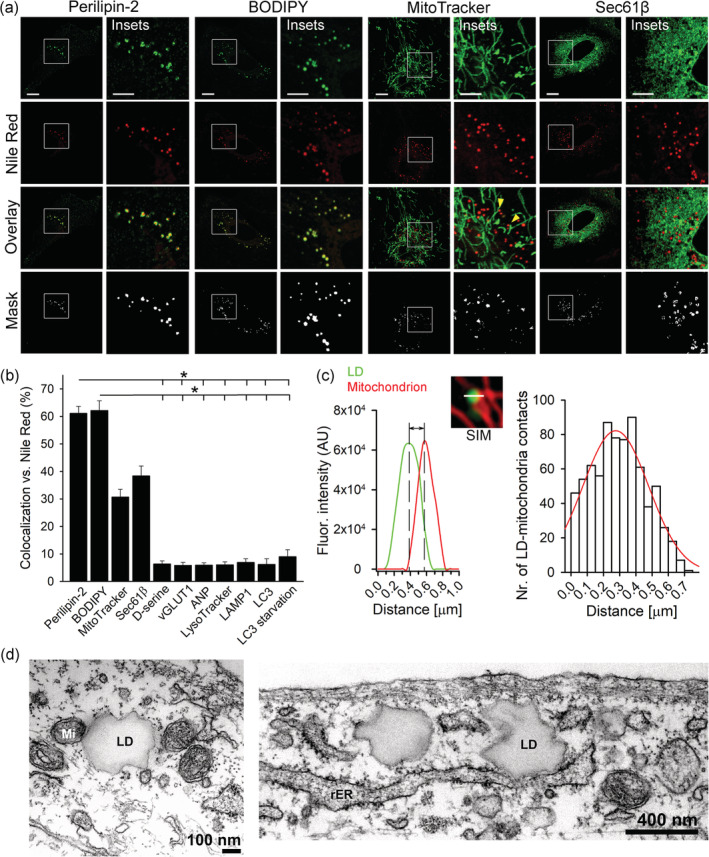
Subcellular colocalization of lipid droplets in isolated astrocytes. (a) Representative fluorescence images of isolated rat cortical astrocytes incubated in growth medium for 24 hr and labeled with fluorescent organelle markers (green) and Nile Red (red), a fluorescent marker for lipid droplets (LDs). Astrocytes were first labeled with antibodies against perilipin‐2 (LD‐binding protein; n = 7 [106 cells]), BODIPY493/503 dye (BODIPY; LD marker; n = 9 [99 cells]), MitoTracker dye (mitochondrial marker; n = 16 [86 cells]) or transfected with the plasmid pAc‐GFPC1‐Sec61beta (Sec61β), to label the endoplasmic reticulum (ER marker; n = 5 [54 cells]; green, upper panels) and then stained with Nile Red. Merged images (Overlay) display colocalization (yellow) between the specific organelle markers (green) and Nile Red (red). Colocalization mask (Mask) between the green and the red fluorescence pixels. Insets show white boxed regions at higher magnification. Yellow arrows show the position of LDs near mitochondria. Representative images of astrocytes exposed to antibodies for d‐serine (n = 6 [127 cells]) or the vesicular glutamate transporter 1 (vGLUT1; n = 6 [106 cells]) to label glutamatergic vesicles, peptidergic vesicles containing the atrial natriuretic peptide (ANP; n = 5 [101 cells]), acidic organelles, stained by the LysoTracker dye (n = 18 [103 cells]), lysosomes stained by antibodies against the lysosomal membrane protein 1 (LAMP1; n = 9 [99 cells]), autophagosomes stained by the antibodies against the light chain 3 (LC3; n = 6 [134 cells]) under normal and starvation conditions (LC3 starvation; n = 6 [123 cells]) are shown in Figure S1. Scale bars: 10 μm and 5 μm (insets). (b) Mean colocalization levels (%) of green fluorescent pixels (fluorescent organelle markers) compared with red fluorescent pixels (Nile Red, LDs). (c) Frequency distribution plot of the distances between LDs and mitochondria in control astrocytes. The distance between a LD to the nearest mitochondrion was determined by structured illumination microscopy (SIM) measuring the distance between the peaks of the BODIPY493/503 (green) and MitoTracker Red CMXRos (red) fluorescence intensity profiles in a single plane in 15 cells. The mean value for the distance between the LDs and the mitochondria, which was calculated by fitting a Gaussian curve on a frequency distribution plot, is 276 ± 14 nm. (d) Transmission electron micrographs of an astrocyte showing close proximity of LDs to mitochondria (Mi) and rough endoplasmic reticulum (rER). Bars represent means ± SEM. n, number of independent experiments. *p < .05 (ANOVA, Dunn's test). Data for every set of experiments were obtained from at least three different animals [Color figure can be viewed at wileyonlinelibrary.com]
