Abstract
Purpose
For stereotactic radiosurgery (SRS), accurate evaluation of dose‐volume metrics for small structures is necessary. The purpose of this study was to compare the DVH metric capabilities of five commercially available SRS DVH analysis tools (Eclipse, Elements, Raystation, MIM, and Velocity).
Methods
DICOM RTdose and RTstructure set files created using MATLAB were imported and evaluated in each of the tools. Each structure set consisted of 50 randomly placed spherical targets. The dose distributions were created on a 1‐mm grid using an analytic model such that the dose‐volume metrics of the spheres were known. Structure sets were created for 3, 5, 7, 10, 15, and 20 mm diameter spheres. The reported structure volume, V100% [cc], and V50% [cc], and the RTOG conformity index and Paddick Gradient Index, were compared with the analytical values.
Results
The average difference and range across all evaluated target sizes for the reported structure volume was − 4.73%[−33.2,0.2], 0.11%[−10.9, 9.5], −0.39%[−12.1, 7.0], −2.24%[−21.0, 1.3], and 1.15%[−15.1,0.8], for TPS‐A through TPS‐E, respectively. The average difference and range for the V100%[cc] (V20Gy[cc]) was − 0.4[−24.5,9.8], −2.73[−23.6, 1.1], −3.01[−23.6, 0.6], −3.79[−27.3, 1.3], and 0.26[−6.1,2.6] for TPS‐A through TPS‐E, respectively. For V50%[cc](V10Gy[cc]) in TPS‐A through TPS‐E the average and ranger were − 0.05[−0.8,0.4], −0.18[−1.2, 0.5], −0.44[−1.4, 0.3], −0.26[−1.8, 2.6], and 0.09[−1.4,2.7].
Conclusion
This study expanded on the previously published literature to quantitatively compare the DVH analysis capabilities of software commonly used for SRS plan evaluation and provides freely available and downloadable analytically derived set of ground truth DICOM dose and structure files for the use of radiotherapy clinics. The differences between systems highlight the need for standardization and/or transparency between systems, especially when evaluating plan quality for multi‐institutional clinical trials.
Keywords: commercial systems, dose volume differences, DVH analysis, SRS
1. INTRODUCTION
For stereotactic radiosurgery (SRS), accurate evaluation of dose‐volume metrics for small structures is crucial. One of the most common and extensively utilized plan evaluation tools is the dose‐volume histogram (DVH). 1 , 2 , 3 , 4 The DVH is an efficient method of quantifying and visualizing dose coverage for targets and organs at risk (OAR) by converting three‐dimensional (3D) information into a two‐dimensional curve for each object and is currently a standard feature in every treatment planning system. Clinical trials and protocols rely on DVH analysis to determine compliance and evaluate treatments, and guidelines for reporting DVH metrics were recently published in The Report of AAPM Task Group 263: Standardizing Nomenclatures in Radiation Oncology. 5
Previous studies have evaluated the capabilities and accuracy of DVH calculations with varying grid resolutions, 6 bin width/size capabilities, 7 and large complex targets. 8 Stereotactic radiosurgery treatment planning offers a unique set of challenges, namely high doses with steep gradients and very small structures, which can present a challenge for accurate DVH evaluations. Previous studies 1 , 2 , 7 , 8 , 9 have focused on standard fractionation and volumes; therefore, the need for further investigation of the ability to accurately calculate structure volumes and small dose volumes with high gradients exists. The evaluation of SRS plan quality typically includes the conformity index 10 and gradient index. 11 Accuracy of the DVH calculation on these quantities has not been previously evaluated. This study aimed to expand on the previously published literature 10 to quantitatively compare the DVH analysis capabilities of software commonly used for SRS plan evaluation and provide a freely available and downloadable analytically derived set of ground truth DICOM dose and structure files for the use of radiotherapy clinics.
2. MATERIALS AND METHODS
2.A. Evaluated systems
Five commercially available SRS DVH analysis tools were evaluated in this study: Eclipse version 15.6 (Varian Medical Systems, Palo Alto, CA), Elements 3.0 (BrainLab, Munich, Germany), MIM V6.7 (MIM software, Cleveland, OH), Raystation 8B (Raysearch, Stockholm, Sweden), and Velocity 3.1.0 (Varian Medical Systems, Palo Alto, CA). Note that this is not an exhaustive list of systems that can perform DVH analysis for SRS but represents the systems available to the authors.
2.B. Evaluation plan creation
A ground truth set of DICOM dose and structure set files were created using MATLAB (MathWorks, Natick, MA) to be imported and evaluated in each of the systems. Each system only interacted with the ground truth plans, which were not manipulated by another system. Structure sets, each containing 50 target spheres for each specified diameter, were created for two synthetic CT datasets having 0.6 mm pixel size with 0.5‐ and 1‐mm slice spacing. Structure sets were created for sphere diameters 3, 5, 7, 10, 15, and 20 mm for a total of N = 600 evaluated structures. A dose matrix was created using an analytical model developed for linear‐accelerator based SRS. 14 The dose around each sphere was given by equation 1 where r is the distance from the center of the sphere, C is the sphere diameter, and the fitting parameters from Suh et al. are s1 = 0.249, s2 = 7.019, s3 = 0.029, and s4 = 1.927. 14
| (1) |
For each target sphere, a spherical evaluation volume was created where the dose was greater than or equal to 25% of the dose at the surface of the target sphere (D(C)/4). These evaluation volumes were used for calculating dose‐volume metrics in the neighborhood of each sphere. For each of the evaluated systems, a standard dose grid of 1 mm × 1 mm × CT slice spacing was used. The target spheres were spaced such that the evaluation volumes did not overlap. Within each evaluation volume, there was no contribution to the dose from target spheres outside of the evaluation volume. The dose outside of all of the evaluation volumes was set to 25%. Figure 1 shows a representative sample from Velocity for the 5‐mm target structures and dose distributions.
Fig. 1.

(LEFT) Sample analysis image from Velocity showing the 5‐mm target spheres with analytically defined dose distributions surrounded by an evaluation volume used to calculate V100% [cc], and V50% [cc]. (RIGHT) Close‐up of one if the 50 spherical targets for each dataset showing the Target (red), Shell (Blue) and a color dose distribution with a range of 20 to 5 Gy.”
The DICOM structure sets and dose matrices were imported into each treatment planning system. The target sphere volumes reported by the planning system were obtained, along with the V100% [cc] and V50% [cc] in the evaluation volume structures. From these values, the RTOG conformity index 13 , 15 , 16 and the Paddick gradient index 12 , 13 were computed. The values were compared with the analytical values, given by for the sphere volume and Eq. (1) for the dose volumes. Additionally, each system was compared against slice stacking and the improved slice stacking methodology as described by Ma et al in 2012. 11 Briefly, the slice stacking method computes the volume by multiplying the area of the polygons defined by the contours by the CT slice thickness. The improved slice stacking methodology includes a correction that improves volume calculation at the inferior and superior ends. 11 The slice stacking methods require contours and so were used only for structure volume calculation and not for V100% [cc] or V50% [cc].
The DICOM files used for this work are available in the supplementary material.
2.C. Import, settings, export, and analysis
2.C.1. Eclipse 15.6.05
The analytically derived DICOM files were imported using the standard DICOM media file import filter. The target sphere volumes and evaluation dose‐volume values were extracted using the Eclipse Scripting API (ESAPI), resulting in more significant figures than is available in the user interface. Eclipse has two resolutions for the internal voxel representation of the structure, low‐ and high‐resolution. The structure resolution corresponds to the voxel size in the transverse plane and high resolution can only be used when the corresponding image size is larger than 256 × 256 voxels. The DICOM import filter automatically sets high resolution for spheres having diameter ≤15 mm.
2.C.2. Elements 3.0
The analytically derived DICOM files were sent to BrainLab product engineering in Munich Germany, where they were imported into Dose Review 3.0 prototype (a part of the Elements package, to be released in October 2020). The structure and dose volumes were evaluated by BrainLab engineering and recorded in a spreadsheet which was parsed and analyzed in MATLAB to find the reported structure volume, V100% [cc], and V50% [cc]. Dose Review 3.0 used an adaptive voxel grid size to calculate the volumes of target and dose clouds. The grid size was 0.5 mm for the 3‐ and 5‐mm targets, and 1 for 7 mm and above targets.
2.C.3. MIM V6.7
The analytically derived DICOM files were imported into MIM and each dataset containing CT images, RTstructures, RTplan, and RTdose of size‐specific targets was selected and read by MIM application. Cumulative DVH graphs of all structures were generated, exported saved as an Excel (Microsoft corp., Redmond, WA) format file. The exported Excel files were analyzed in MATLAB to obtain the reported structure volume, V100% [cc] and V50% [cc].
2.C.4. Raystation 8b
The analytically derived DICOM files corresponding to different‐sized target and evaluation shells were imported to Raystation. Once imported into Raystation, DVH metrics are automatically calculated for all structures. To obtain absolute data, a Python script was used within Raystation to export the DVH values directly from structures. Resulting values were transferred to MATLAB to be used for comparative analysis between the different TPS systems.
2.C.5. Velocity 3.1.0
The analytically derived DICOM files were imported into Velocity and automatically registered using the created DICOM registration. For each RTplan and RTdose combination, the target and evaluation volumes were manually exported via the secondary DVH analysis export feature. The generated text files were parsed and analyzed in MATLAB (MathWorks, Natick, MA) to find the reported structure volume, V100% [cc], and V50% [cc].
The goal of this work was to evaluate differences in reported metrics against reference DICOM structure sets and dose distributions, not to evaluate the fitness of specific treatment planning systems. Therefore, we report the results without identifying the specific systems and ordered differently than presented above. Readers interested in the performance of a specific system can download the test data and replicate this work for the system of interest.
3. RESULTS
TablesI, II, III show the average difference and range of each of the evaluated systems for the reported structure volumes (50 for each sphere size, total N = 600), V100% [cc], and V50% [cc], respectively. Figures 2, 3, 4 show the average difference of the reported structure volume, V100% [cc], and V50% [cc], respectively. Additionally, each system was compared against slice stacking and the improved slice stacking (SSI) methodology as described by Ma et al in 2012. Using this information, the Paddick index, shown in Fig. 5, and the RTOG conformity indices, shown in Fig. 6, (analytical CI = 1) were calculated.
Table I.
The average difference and total range between the reported structure volume and the analytically derived volume for each of the evaluated systems.
| Target size (mm) | TPS‐A Range [%] | TPS‐B Range [%] | TPS‐C Range [%] | TPS‐D Range [%] | TPS‐E Range [%] |
|---|---|---|---|---|---|
| 0.5‐mm slice spacing | |||||
| 3 | −9.8 (−16.4, −6.9) | 0.1 (−10.9, 8.2) | −1.5 (−12.1, 7.0) | −3.8 (−8.5, −0.8) | −1.0 (−1.0, −1.0) |
| 5 | −3.1 (−5.7, −2.2) | −0.1 (−2.1, 1.8) | −0.4 (−2.6, 1.5) | −1.6 (−3.2, −0.8) | −0.5 (−0.7, 0.8) |
| 7 | −1.3 (−2.6, −0.9) | 0.1 (−1.2, 1.2) | −0.1 (−1.3, 1.1) | −0.9 (−1.6, −0.3) | −0.1 (−0.3, 0.2) |
| 10 | −1.3 (−2.6, −0.9) | 0.1 (−1.2, 1.2) | −0.1 (−1.3, 1.1) | −0.5 (−0.8, −0.1) | −0.1 (−0.3, 0.2) |
| 15 | −0.4 (−1.0, −0.3) | −0.0 (−1.1, 0.5) | −0.1 (−1.1, 0.5) | −0.2 (−0.4, −0.1) | 0.0 (−0.3, 0.1) |
| 20 | −0.1 (−0.3, 0.2) | −0.0 (−0.4, 0.2) | −0.0 (−0.4, 0.2) | −0.1 (−0.2, −0.1) | 0.0 (−0.2, −0.0) |
| 1‐mm slice spacing | |||||
| 3 | −23.7 (−33.2, −20.1) | 1.3 (−8.3, 9.5) | −1.3 (−10.9, 7.0) | −8.9 (−21.0, −1.8) | −2.4 (−15.1, 13.2) |
| 5 | −9.6 (−14.0, −7.4) | 0.0 (−5.4, 4.0) | −0.6 (−5.9, 3.4) | −4.9 (−10.0, −2.0) | −3.8 (−9.9, 0.8) |
| 7 | −5.4 (−9.5, −3.9) | −0.1 (−2.4, 2.4) | −0.5 (−3.2, 2.0) | −3.2 (−6.0, 1.3) | −3.1 (−5.9, −0.9) |
| 10 | −5.4 (−9.5, −3.9) | −0.1 (−2.4, 2.4) | −0.5 (−3.2, 2.0) | −1.5 (−2.9, −0.8) | −3.1 (−5.9, −0.9) |
| 15 | −2.2 (−3.6, −1.8) | 0.0 (−1.2, 1.0) | −0.1 (−1.3, 0.7) | −0.8 (−1.5, −0.5) | −1.4 (−3.2, −0.3) |
| 20 | −0.9 (−1.8, −0.7) | −0.0 (−0.5, 0.6) | −0.1 (−0.7, 0.5) | −0.5 (−0.8, −0.3) | −0.9 (−1.6, −0.2) |
| Average | −4.73 | 0.11 | −0.39 | −2.24 | 1.15 |
| Range | (−33.2, 0.2) | (−10.9, 9.5) | (−12.1, 7.0) | (−21.0, 1.3) | (−15.1, 0.8) |
Table II.
The average difference and total range between the reported V100% [cc] and the analytically derived dose volume for each of the evaluated systems.
| Target size (mm) | TPS‐A Range [%] | TPS‐B Range [%] | TPS‐C Range [%] | TPS‐D Range [%] | TPS‐E Range [%] |
|---|---|---|---|---|---|
| 0.5‐mm slice spacing | |||||
| 3 | −0.2 (−24.5, 9.8) | −12.4 (−19.8, −5.8) | −13.1 (−20.7, −6.8) | −11.1 (−16.4, −6.6) | 0.2 (−22.2, 13.2) |
| 5 | 0.0 (−6.5, 6.2) | −3.5 (−6.5, −2.1) | −3.9 (−7.1, −2.4) | −3.6 (−8.1, −1.5) | −0.2 (−3.7, 7.0) |
| 7 | 0.1 (−3.0, 2.1) | −1.3 (−2.5, 0.3) | −1.5 (−2.8, −0.0) | −1.6 (−3.8, −0.7) | −0.2 (−3.7, 3.0) |
| 10 | 0.1 (−3.0, 2.1) | −1.3 (−2.5, 0.3) | −1.5 (−2.8, −0.0) | −0.2 (−0.7, 0.4) | −0.2 (−3.7, 3.0) |
| 15 | 0.4 (−2.1, 1.0) | −0.3 (−1.4, 0.3) | −0.5 (−1.5, 0.1) | 0.2 (−0.6, 0.8) | 0.2 (−2.6, 1.0) |
| 20 | 0.3 (−0.2, 0.7) | 0.1 (−0.4, 0.2) | −0.2 (−0.6, 0.1) | 0.3 (−0.1, 0.9) | 0.1 (−0.7, 0.7) |
| 1‐mm slice spacing | |||||
| 3 | −4.3 (−24.5, 2.7) | −10.6 (−23.6, −0.7) | −10.8 (−23.6, −0.7) | −20.1 (−27.3, −16.6) | 2.0 (−36.3, 20.3) |
| 5 | −1.4 (−7.2, 5.4) | −3.4 (−7.8, 0.1) | −3.6 (−8.1, −0.1) | −6.3 (−10.6, −4.0) | −0.5 (−16.0, 10.0) |
| 7 | −0.5 (−3.9, 1.6) | −1.5 (−4.2, 1.1) | −1.8 (−4.3, 0.6) | −3.0 (−4.5, −2.0) | −0.5 (−5.9, 3.6) |
| 10 | −0.5 (−3.9, 1.6) | −1.5 (−4.2, 1.1) | −1.8 (−4.3, 0.6) | −0.7 (−1.3, −0.0) | −0.5 (−5.9, 3.6) |
| 15 | 0.2 (−2.3, 0.7) | −0.3 (−1.6, 0.8) | −0.5 (−1.8, 0.5) | 0.4 (−1.2, 1.3) | 0.2 (−4.7, 4.7) |
| 20 | 0.2 (−0.2, 0.8) | 0.0 (−0.5,0.7) | −0.2 (−0.7, 0.4) | 0.2 (−0.7, 0.9) | 0.1 (−1.3, 1.2) |
| Average | −0.40 | −2.73 | −3.01 | −3.79 | −0.26 |
| Range | (−24.5, 9.8) | (−23.6, 1.1) | ( −23.6, 0.6) | (−27.3, 1.3) | (−6.1, 2.6) |
Table III.
The average difference and total range between the reported V50% [cc] and the analytically derived dose volume for each of the evaluated systems.
| Target size (mm) | TPS‐A Range [%] | TPS‐B Range [%] | TPS‐C Range [%] | TPS‐D Range [%] | TPS‐E Range [%] |
|---|---|---|---|---|---|
| 0.5‐mm slice spacing | |||||
| 3 | 0.0 (−0.7, 0.6) | −0.6 (−1.2, 0.2) | −0.9 (−1.3, −0.2) | −0.7 (−1.5, −0.3) | 0.3 (−0.6, 1.6) |
| 5 | 0.0 (−0.5, 0.5) | −0.3 (−0.9, 0.5) | −0.6 (−1.2, 0.2) | −0.3 (−0.6, 0.0) | 0.1 (−1.1, 0.9) |
| 7 | 0.0 (−0.3, 0.3) | −0.2 (−0.5, 0.4) | −0.4 (−0.7, 0.1) | −0.2 (−0.3, 0.1) | 0.1 (−0.2, 0.6) |
| 10 | 0.0 (−0.3, 0.3) | −0.2 (−0.5, 0.4) | −0.4 (−0.7, 0.1) | −0.2 (−0.4, 0.1) | 0.1 (−0.2, 0.6) |
| 15 | 0.0 (−0.3, 0.3) | −0.1 (−0.3, 0.1) | −0.3 (−0.4, −0.1) | 0.0 (−0.1, 0.2) | 0.1 (−0.4, 0.8) |
| 20 | 0.0 (−0.1, 0.2) | 0.0 (−0.1, 0.1) | −0.3 (−0.4, −0.1) | 0.2 (0.0, 0.4) | 0.1 (−0.2, 0.3) |
| 1‐mm slice spacing | |||||
| 3 | −0.2 (−0.8, 0.4) | −0.6 (−1.2, 0.1) | −0.8 (−1.4, −0.0) | −1.0 (−1.8, −0.8) | 0.2 (−1.1, 2.7) |
| 5 | −0.2 (−0.6, 0.4) | −0.3 (−0.7, 0.1) | −0.6 (−1.0, −0.1) | −0.5 (−0.8, −0.2) | 0.0 (−1.4, 1.1) |
| 7 | −0.1 (−0.4, 0.3) | −0.2 (−0.5, 0.5) | −0.4 (−0.7, 0.3) | −0.3 (−0.5, 0.1) | −0.0 (−0.7, 0.7) |
| 10 | −0.1 (−0.4, 0.3) | −0.2 (−0.5, 0.5) | −0.4 (−0.7, 0.3) | −0.3 (−0.6, 0.1) | 0.0 (−0.7, 0.7) |
| 15 | −0.1 (−0.3, 0.3) | −0.1 (−0.4, 0.3) | −0.3 (−0.6, −0.0) | 0.0 (−0.1, 0.3) | 0.0 (−0.6, 0.7) |
| 20 | 0.0 (−0.2, 0.2) | 0.0 (−0.1, 0.3) | −0.3 (−0.4, −0.1) | 0.2 (0.1, 0.5) | 0.0 (−0.5, 0.3) |
| Average | −0.05 | −0.18 | 0.44 | −0.26 | 0.09 |
| Range | (−0.8, 0.4) | (−1.2, 0.5) | ( −1.4, 0.3) | (−1.8, 2.6) | (−1.4, 2.7) |
Fig. 2.
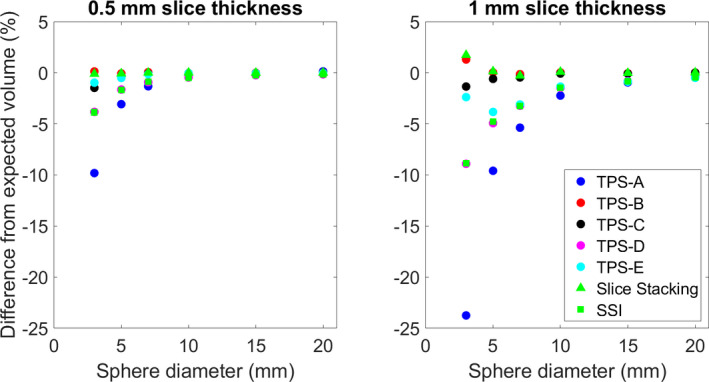
The average difference from the reported structure volume and the analytically derived volume for each of the evaluated systems.
Fig. 3.
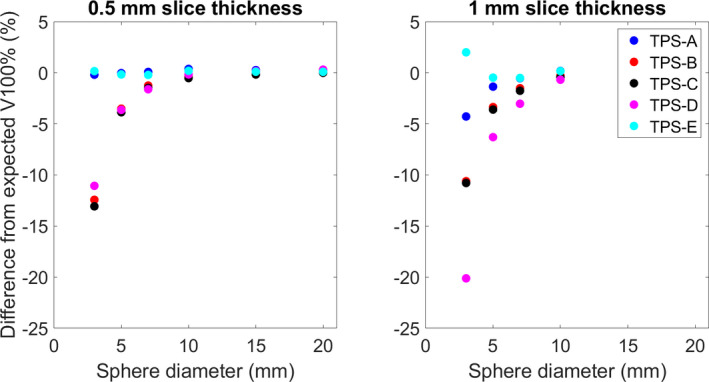
The average difference between the reported V100% [cc] and the analytically derived dose volume for each of the evaluated systems.
Fig. 4.
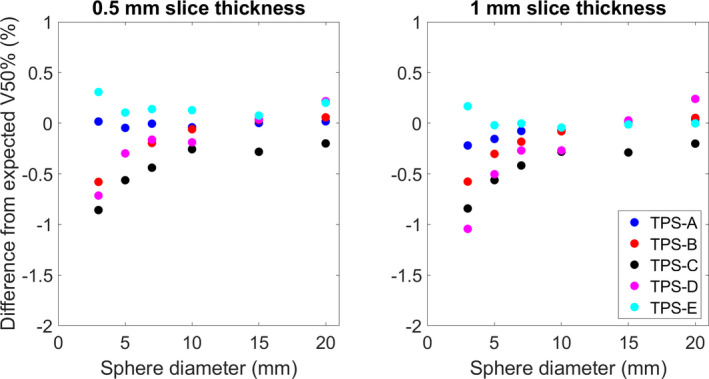
The average difference between the reported V50% [cc] and the analytically derived dose volume for each of the evaluated systems.
Fig. 5.
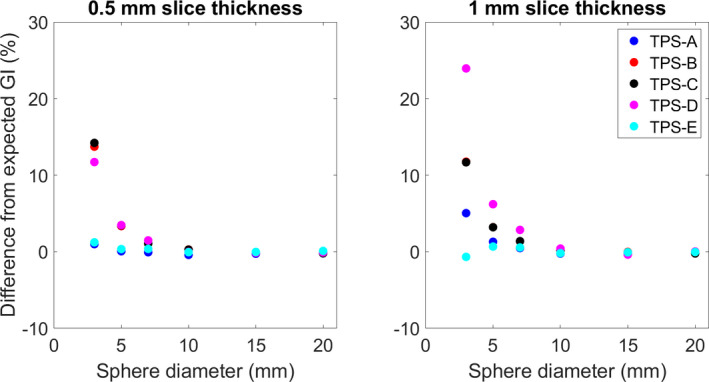
The difference between the average GI calculated in each TPS and the expected Paddick GI as a function of sphere diameter.
Fig. 6.
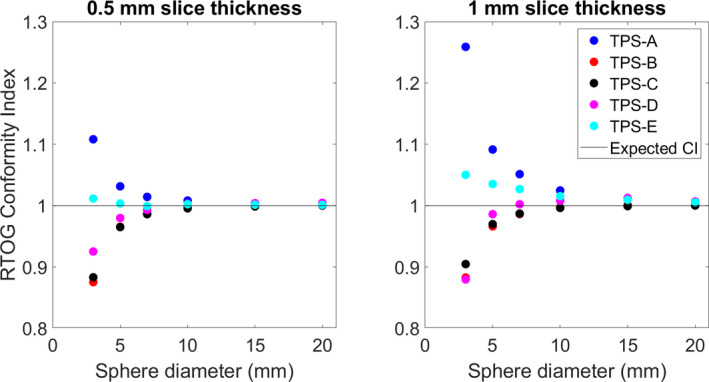
The calculated RTOG conformity index (CI) for each TPS vs the sphere diameter. The expected CI is also shown.
4. DISCUSSION
Evaluation of the accuracy of DVH metrics using analytical methods has been previously reported in the literature. In 2015, Nelms et al. 17 developed a process to create “simple geometrical objects at different orientations combined with dose grids of varying spatial resolution with linear 1D dose gradients” that could be used to analytically calculate “ground truth DVH curves” to create a set of applicable tests to serve as the basis of evaluation of DVH metrics for Task Group 53: quality assurance for clinical radiotherapy treatment planning. 4 Different shapes, grid resolutions, object orientations, and voxelation methods for two commercially available systems [Pinnacle (Philips Medical Systems) and iPlan (BrainLab)] were evaluated but volumes and dose gradients relevant to SRS were not included.
In 2012, Ma et al. 11 investigated the reliability of contour‐based volume calculations using spheres with sizes representative of SRS target volumes. High‐precision acrylic spheres were inserted into a phantom, imaged via CT and/or MR, and contoured within the Leksell GammaPlan (Elekta, Stockholm, Sweden). Structure sets were then exported into five treatment planning systems and the volumes were recalculated. 11 They reported significant variability of the reported volumes indicating the need for more transparency in methods for volume calculation and the need for a standard within treatment planning systems and radiotherapy contouring software.
The aforementioned studies have highlighted the need for further investigation into the accuracy of calculating volumes within the treatment planning system. Rather than using a physical model, which is vulnerable to inaccuracies in manufacturing and imaging reconstructions, this study utilized an analytical model created within MATLAB to have a ground truth for analysis. The analytical model was also directly imported into each system, rather than contoured in a single platform then exported, for analysis to avoid compounding of calculation and interpolation artifacts from one system to another.
The work presented here also includes the accurate calculation of commonly used DVH metrics, which are dependent on the accurate calculation of the target and dose volumes. These volumes and metrics are commonly reported in the literature 10 , 18 , 19 and are used to correlate plan quality when reporting patient outcomes. Without a standard for volume calculation within treatment planning systems, comparisons of metrics between systems are complicated and problematic, especially in the context of clinical trials, 20 , 21 , 22 , 23 and comparative planning studies. 24 , 25 , 26 , 27
Note that the results by Ma et al. 11 were published in 2012, and there has been no discernable improvement with regard to the transparency of volume calculation methodology. Calculations of volumes within the treatment planning system continue to be a black box. Understanding the cause of the differences between each of the systems is challenging because they arise from the implementation details which are not readily accessible to users. Additionally, this information is often proprietary or is out of the scope of a standard customer service representative. This leaves users without the knowledge to understand any software specific shortcomings or the means to accurately intercompare results between systems. This study provides an analytical set of structures and doses for users to validate their systems and form an understanding of the functionality of clinically utilized software. The comparisons here also give the radiotherapy community a baseline comparison for SRS DVH metrics between commonly used software tools.
5. CONCLUSION
This study expanded on the previously published literature to quantitatively compare the DVH analysis capabilities of software commonly used for SRS plan evaluation and provides a freely available and downloadable analytically derived set of ground truth DICOM dose and structure files for the use of radiotherapy clinics. The differences between systems highlight the need for standardization and transparency between systems, especially when evaluating plan quality for multi‐institutional clinical trials.
CONFLICT OF INTEREST
Dr. Popple and Dr. Fiveash report grants from Varian Medical Systems, personal fees from Varian Medical Systems, but these are outside the submitted work. Dr. Covington has received travel assistance from Varian Medical Systems for work unrelated to this submission. Dr. Liu has a grant from BrainLAB, outside of this submitted work. Dr. Cardan reports personal fees from Varian Medical Systems, outside the submitted work; In addition, Dr. Cardan has a patent PREDICTIVE COLLISION AVOIDANCE FOR RADIOTHERAPY (20160166856) pending to Varian Medical Systems, and a patent ASSESSING MACHINE TRAJECTORIES FOR COLLISION AVOIDANCE (Patent# 10073438) issued to Varian Medical Systems.
Dr. Stanley, Dr. Alexandrian and Dr. Bridges have no conflict of interest to disclose.
Supporting information
Data S1. A ground truth set of DICOM dose and structure set files that can be imported and evaluated.
REFERENCES
- 1. Chen GT. Dose volume histograms in treatment planning. Int J Radiat Oncol Biol Phys. 1988;14:1319–1320. [DOI] [PubMed] [Google Scholar]
- 2. Drzymala RE, Mohan R, Brewster L, et al. Dose‐volume histograms. Int J Radiat Oncol Biol Phys. 1991;21:71–78. [DOI] [PubMed] [Google Scholar]
- 3. Kessler ML, Ten Haken RK , Fraass BA, McShan DL. Expanding the use and effectiveness of dose‐volume histograms for 3‐D treatment planning. I: integration of 3‐D dose‐display. Int J Radiat Oncol Biol Phys. 1994;29:1125–1131. [DOI] [PubMed] [Google Scholar]
- 4. Fraass B, Doppke K, Hunt M, et al. American Association of Physicists in Medicine Radiation Therapy Committee Task Group 53: quality assurance for clinical radiotherapy treatment planning. Med Phys. 1998;25:1773–1829. [DOI] [PubMed] [Google Scholar]
- 5. Mayo CS, Moran JM, Bosch W, et al. American Association of Physicists in Medicine Task Group 263: standardizing nomenclatures in radiation oncology. Int J Radiat Oncol Biol Phys. 2018;100:1057–1066. [DOI] [PMC free article] [PubMed] [Google Scholar]
- 6. Panitsa E, Rosenwald JC, Kappas C. Quality control of dose volume histogram computation characteristics of 3D treatment planning systems. Phys Med Biol. 1998;43:2807–2816. [DOI] [PubMed] [Google Scholar]
- 7. Chung H, Jin H, Palta J, Suh T‐S, Kim S. Dose variations with varying calculation grid size in head and neck IMRT. Phys Med Biol. 2006;51:4841–4856. [DOI] [PubMed] [Google Scholar]
- 8. Ebert MA, Haworth A, Kearvell R, et al. Comparison of DVH data from multiple radiotherapy treatment planning systems. Phys Med Biol. 2010;55:N337–N346. [DOI] [PubMed] [Google Scholar]
- 9. Corbett JF, Jezioranski J, Crook J, Yeung I. The effect of voxel size on the accuracy of dose‐volume histograms of prostate 125I seed implants. Med Phys. 2002;29:1003–1006. [DOI] [PubMed] [Google Scholar]
- 10. Ma L, Sahgal A, Nie K, et al. Reliability of contour‐based volume calculation for radiosurgery. J Neurosurg. 2012;117:203–210. [DOI] [PubMed] [Google Scholar]
- 11. Paddick I. A simple scoring ratio to index the conformity of radiosurgical treatment plans. Technical note. J Neurosurg. 2000;93:219–222. [DOI] [PubMed] [Google Scholar]
- 12. Ma L, Chin LS, Shepard D, Amin P, Slawson S. The effect of user‐defined variables on dosimetry consistency in Gamma Knife planning. Phys Med Biol. 2000;45:N43–N47. [DOI] [PubMed] [Google Scholar]
- 13. Paddick I, Lippitz B. A simple dose gradient measurement tool to complement the conformity index. J Neurosurg. 2006;105:194–201. [DOI] [PubMed] [Google Scholar]
- 14. Suh TS, Bova FJ, Yoon SC, et al. Computer‐aided design optimization with the use of a fast dose model for linear‐accelerator‐based stereotactic radiosurgery. Phys Med Biol. 1996;41:675–696. [DOI] [PubMed] [Google Scholar]
- 15. Feuvret L, Noël G, Mazeron J‐J, Bey P. Conformity index: a review. Int J Radiat Oncol Biol Phys. 2006;64:333–342. [DOI] [PubMed] [Google Scholar]
- 16. Niranjan A. Conformity index for radiosurgery. Neurosurgery. 2010;67:E521. [DOI] [PubMed] [Google Scholar]
- 17. Nelms B, Stambaugh C, Hunt D, Tonner B, Zhang G, Feygelman V. Methods, software and datasets to verify DVH calculations against analytical values: twenty years late(r). Med Phys. 2015;42:4435–4448. [DOI] [PubMed] [Google Scholar]
- 18. Ma L, Peeti P, Wang B, et al. Apparatus dependence of normal brain tissue dose in stereotactic radiosurgery for multiple brain metastases. J Neurosurg. 2011;114:1580–1584. [DOI] [PubMed] [Google Scholar]
- 19. Thomas EM, Popple RA, Wu X, et al. Comparison of plan quality and delivery time between volumetric arc therapy (RapidArc) and Gamma Knife radiosurgery for multiple cranial metastases. Neurosurgery. 2014;75:409–417. [DOI] [PMC free article] [PubMed] [Google Scholar]
- 20. Minniti G, Clarke E, Lanzetta G, et al. Stereotactic radiosurgery for brain metastases: analysis of outcome and risk of brain radionecrosis. Radiat Oncol. 2011;6:48. [DOI] [PMC free article] [PubMed] [Google Scholar]
- 21. Minniti G, Scaringi C, Clarke E, et al. Frameless linac‐based stereotactic radiosurgery (SRS) for brain metastases: analysis of patient repositioning using a mask fixation system and clinical outcomes. Radiat Oncol. 2011;6:158. [DOI] [PMC free article] [PubMed] [Google Scholar]
- 22. Prendergast BM, Popple RA, Clark GM, et al. Improved clinical efficiency in CNS stereotactic radiosurgery using a flattening filter free linear accelerator. J Radiosurg SBRT. 2011;1:117–122. [PMC free article] [PubMed] [Google Scholar]
- 23. Lindquist C, Paddick I. The Leksell Gamma Knife Perfexion and comparisons with its predecessors. Neurosurgery. 2008;62:721–732. [DOI] [PubMed] [Google Scholar]
- 24. Clark GM, Popple RA, Prendergast BM, et al. Plan quality and treatment planning technique for single isocenter cranial radiosurgery with volumetric modulated arc therapy. Pract Radiat Oncol. 2012;2:306–313. [DOI] [PubMed] [Google Scholar]
- 25. Roberge D, Ruo R, Souhami L. Killing two birds with one stone: a dosimetric study of dual target radiosurgery using a single isocenter. Technol Cancer Res Treat. 2006;5:613–617. [DOI] [PubMed] [Google Scholar]
- 26. Kang J, Ford EC, Smith K, Wong J, McNutt TR. A method for optimizing LINAC treatment geometry for volumetric modulated arc therapy of multiple brain metastases. Med Phys. 2010;37:4146–4154. [DOI] [PubMed] [Google Scholar]
- 27. Novotny J, Bhatnagar JP, Niranjan A, et al. Dosimetric comparison of the Leksell Gamma Knife Perfexion and 4C. J Neurosurg. 2008;109:8–14. [DOI] [PubMed] [Google Scholar]
Associated Data
This section collects any data citations, data availability statements, or supplementary materials included in this article.
Supplementary Materials
Data S1. A ground truth set of DICOM dose and structure set files that can be imported and evaluated.


