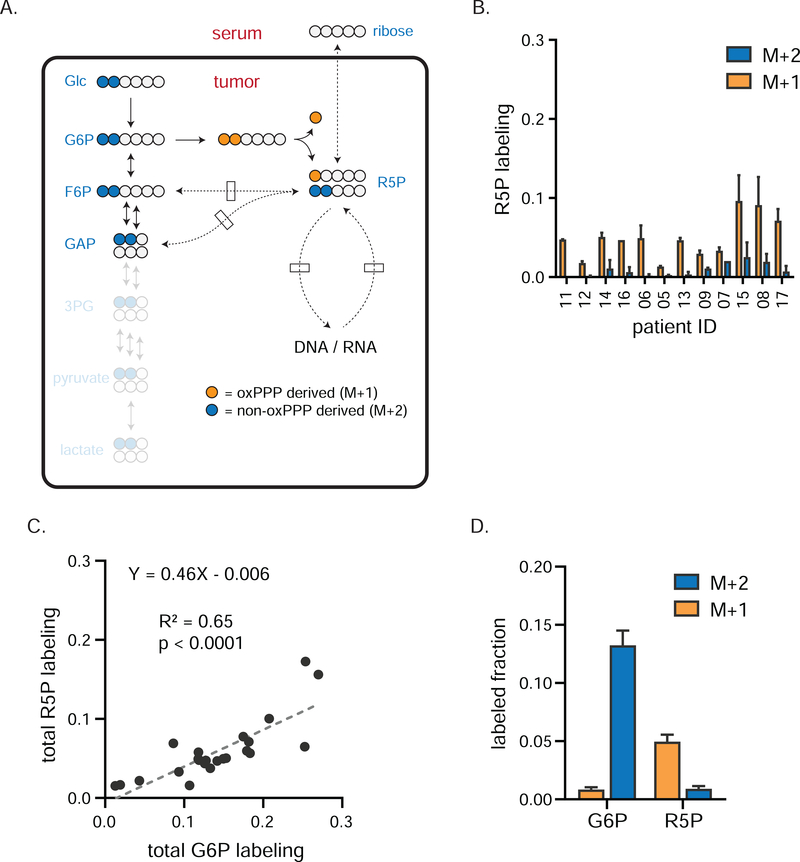
Figure 3. oxPPP is primary source of ribose phosphate in TNBCs.
a) Tracer strategy for comparing oxPPP and non-oxPPP activity using [1,2-13C]glucose. Blue circles depict the path tracer 13C carbons take to produce R5P via the non-oxPPP; orange circles depict the path taken via the oxPPP. Since one glucose carbon is lost as CO2 during oxPPP catabolism, M+1 labeling of R5P indicates oxPPP production, while M+2 labeling indicates non-oxPPP production. b) Individual patient labeling of R5P in TNBCs tumors (mean ± SEM, n = 2 biopsy samples per patient). c) Total labeling (the sum of M+1 and M+2) of R5P correlates with that of G6P. Fit using linear regression. d) Average tumor labeling of G6P and R5P (mean ± SEM, n = 24 total biopsy samples collected from twelve patients). Dominance of M+1 fraction indicates the oxPPP is the primary PPP arm for producing R5P. G6P, glucose-6-phosphate; R5P, ribose-5-phosphate and its isomers ribulose-5-phosphate and xyulose-5-phosphate.

