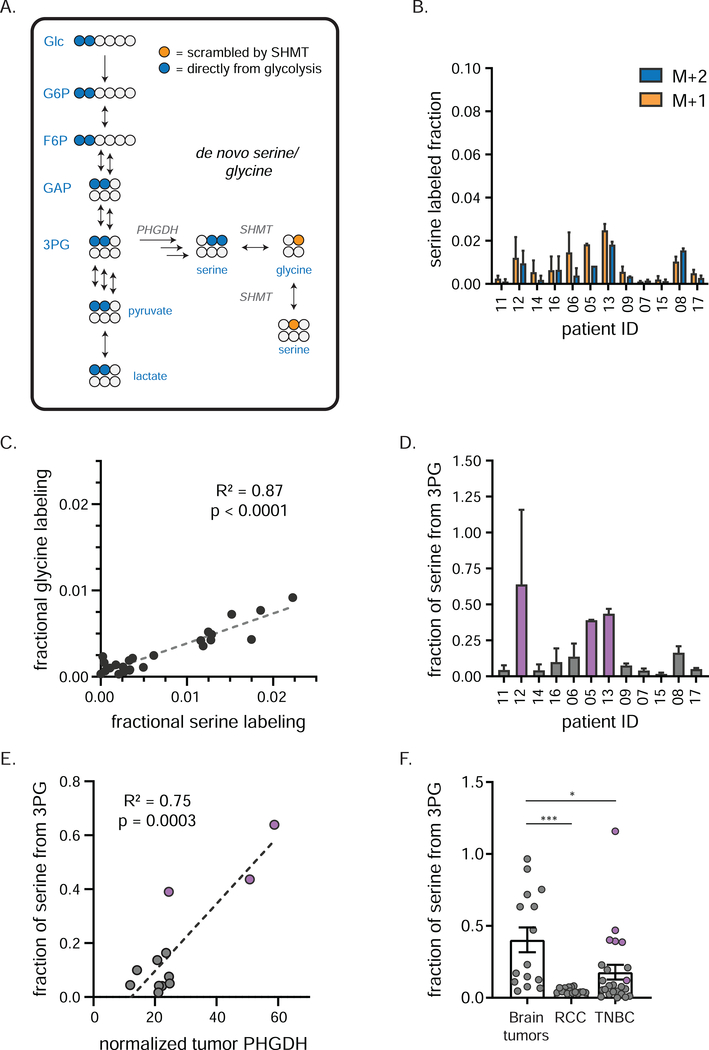
Figure 4. TNBCs produce serine and glycine from glucose.
a) Tracing of de novo serine/ glycine production using [1,2-13C]glucose. Blue circles (M+2 labeling) depict 13C carbons arising directly from [1,2-13C]glucose by de novo serine production; orange circles (M+1 labeling) depict labeled glycine and serine arising from subsequent reversible SHMT activity. b) Individual patient labeling of serine in TNBCs (mean ± SEM, n = 2 biopsy samples per patient). c) Fractional carbon labeling of tumor glycine correlates with that of tumor serine. d) Fractional carbon tumor serine labeling normalized to that of 3PG in individual patients (mean ± SEM, n = 2 biopsy samples per patient). This ratio serves as an estimate of de novo serine production; purple bars indicate patients designated as having “high” de novo serine production. e) PHGDH protein expression (as determined by RPPA analysis) correlates with de novo serine production (mean, n = 2 biopsy samples per patient). Purple dots represent same patients as purple bars in d). f) Fractional carbon tumor serine labeling normalized to that of 3PG in indicated cancers (mean ± SEM, each point represents a single tumor sample of several collected from each of 5 (brain tumors), 5 (RCC) or 12 (TNBC) patients; one-way ANOVA w/Tukey’s correction). 3PG, 3-phosphoglycerate; PHGDH, phosphoglycerate dehydrogenase; SHMT, serine hydroxymethyl transferase * = p < 0.05, *** = p < 0.001. See also Figure S3.

