

Abstract
Tumor-derived extracellular vesicles (EVs) play essential roles in intercellular communication during tumor growth and metastatic evolution. Currently, little is known about the possible roles of tumor-derived EVs in sarcoma because the lack of specific surface markers makes it technically challenging to purify sarcoma-derived EVs. In this study, a specific purification system is developed for Ewing sarcoma (ES)-derived EVs by coupling covalent chemistry-mediated EV capture/ release within a nanostructure-embedded microchip. The purification platform—ES-EV Click Chip—takes advantage of specific anti-LINGO-1 recognition and sensitive click chemistry-mediated EV capture, followed by disulfide cleavage-driven EV release. Since the device is capable of specific and efficient purification of intact ES EVs with high purity, ES-EV Click Chip is ideal for conducting downstream functional studies of ES EVs. Absolute quantification of the molecular hallmark of ES (i.e., EWS rearrangements) using reverse transcription Droplet Digital PCR enables specific quantification of ES EVs. The purified ES EVs can be internalized by recipient cells and transfer their mRNA cargoes, exhibiting their biological intactness and potential role as biological shuttles in intercellular communication.
Keywords: covalent chemistry, extracellular vesicles, microfluidics, nanostructured substrates, sarcoma
1. Introduction
Extracellular vesicles (EVs),[1,2] as a heterogeneous group of phospholipid bilayer-enclosed particles, can be released by all types of cells, especially tumor cells. Recently, the scientific community has begun to understand the importance of EVs as a mechanism and vehicle[3] for cellular interchange of bioactive molecules,[4] including proteins, DNA, and RNA.[5,6] Such interchanges can result in exchanges of genetic information and functional molecules,[7] leading to the subsequent reprogramming of the recipient cells.[8–10] Tumor-derived EVs are regarded as “biological shuttles”[11] capable of transporting biomolecules to mediate intercellular communication, microenvironment modulation, and cancer metastasis. Therefore, in addition to exploring the diagnostic value of tumor-derived EVs,[12–14] there is growing interest in performing functional studies of tumor-derived EVs in cellular communication,[15,16] (e.g., EV uptake and cargo transfer). Since tumor-derived EVs exist in a background of non-tumor-derived EVs, selective purification of tumor-derived EVs—while retaining the integrity of their enclosed biomolecular cargos—has been identified as a major technical barrier to conducting the functional studies of tumor-derived EVs.
Conventionally, EVs can be isolated from blood plasma or serum based on their physical properties by using enrichment methods, for example, ultracentrifugation,[17] precipitation,[18] filtrations,[19] size-based microfluidics,[20–22] and lipid-based nanoprobes.[23] However, these approaches are not suitable for specifically enriching tumor-derived EVs from EVs in the background. Significant research endeavors[24,25] have been devoted to exploring antibody or aptamer[26,27]-based techniques[28–30] to enrich and to analyze tumor-derived EVs. For instance, GPC1 antibody-coated beads have been used to isolate pancreatic cancer-derived exosomes;[31] a herringbone microfluidic device functionalized with EGFRvIII antibody has been demonstrated to enrich glioblastoma-derived exosomes.[32] Previously, our research team developed a “NanoVilli Chip,”[33] in which we engineered densely packed, anti-epithelial cell adhesion molecule-grafted silicon (Si) nanowire arrays to achieve efficient and reproducible immune-affinity capture of tumor-derived EVs. However, due to the meager number of antigens present on the surface of individual EVs, immune-affinity EV capture approaches, which are driven by the dynamic binding between a pair of antigens (on EVs) and antibodies (on the substrates), often suffer from poor EV capture performance and high background. Moreover, conducting functional studies of tumor-derived EVs requires the purification of tumor-derived EVs with biological intactness. Therefore, it is necessary to develop novel purification systems with the capacity of both sensitive and specific capture of tumor-derived EVs and their subsequent release.
Ewing sarcoma (ES) is a highly aggressive cancer that ranks as the second most frequent bone cancer during childhood and adolescence and is known for frequent metastases and poor prognoses.[34] Recently, ES EVs have been identified to be secreted by ES cells, actively participating in the tumorigenesis, progression, and metastasis of ES by not only reprogramming surrounding normal stromal cells but also promoting intercellular communication within the tumor cells themselves.[35,36] At present, few research efforts focus on isolating ES EVs, likely due to the lack of specific surface biomarkers to target. It is technically challenging to develop an efficient method for isolating ES EVs. As a result, only conventional methods—ultracentrifugation[37] and filtration[38]—have been adopted for their isolation. However, these are incapable of purifying ES EVs out of the non-ES EV background. Recently, an integrated microfluidic digital analysis chip with a dual-probe hybridization assay was developed for the detection of ES-EV mRNA,[39] demonstrating the presence of EWS-rearranged mRNA in ES EVs. However, this platform was not designed for the specific enrichment of ES EVs and is incapable of recovering intact ES EVs for downstream functional studies.
To pave the way for conducting functional studies of ES EVs, we introduced a novel ES-EV purification system (i.e., “ES-EV Click Chip”) by coupling covalent chemistry-mediated EV capture/release within a nanostructure-embedded microchip (Figure 1). In conjunction with the use of a newly identified ES-specific surface marker, that is, leucine-rich repeat and immunoglobulin-like domain-containing protein 1 (LINGO-1),[40] ES-EV Click Chip is capable of purifying ES EVs, which can be used for downstream functional studies, that is, EV uptake and cargo transfer. More specifically, the covalent chemistry-mediated EV capture/release is built upon the combined use of click chemistry[41]-mediated capture of EVs (tagged with anti-LINGO-1 antibody) and subsequent disulfide cleavage[42]driven EV release. Further, the nanostructures embedded in microchip dramatically increase the device surface area[43,44] contacting/interacting with ES EVs, and the microfluidic chaotic mixer made of polydimethylsiloxane (PDMS) facilitates repeated physical contact[45] between silicon nanowire substrates (SiNWS) and the flow-through ES EVs. In contrast to previous antibody-mediated EV capture,[33] a pair of highly reactive click chemistry motifs,[46] that is, tetrazine (Tz) and trans-cyclooctene (TCO), are grafted onto the embedded SiNWS (via surface modification) and ES EVs (via TCO-antibody conjugation), respectively. Subsequently, the inverse electron demand Diels-Alder (IEDDA) cycloaddition[47] between Tz and TCO with a rate constant[48] of ≈104 m−1 s−1 mediates the rapid, chemoselective, and irreversible capture of TCO-anti-LINGO-1grafted ES EVs onto Tz-grafted SiNWS with improved capture efficiency and reduced background. After click chemistry-mediated ES-EV capture, exposure to a disulfide cleavage agent—1,4-dithiothreitol (DTT)[49]—leads to the prompt release of ES EVs from the SiNWS by breaking the embedded disulfide bond. We utilized ES-EV Click Chips to purify ES EVs that are genetically characterized by harboring specific chromosomal translocations. These translocations generate fusions of EWSR1 to one of the ETS gene family members, including FLI1 (90–95%) and ERG (5–10%),[50] providing specific molecular markers for detecting ES EVs.[51] By using immunogold-transmission electron microscopy (TEM), we confirm that LINGO-1 is expressed on the surface of ES EVs. We thus exploit the anti-LINGO-1 antibody to recognize ES EVs in ES-EV Click Chip purification system. We show that ES-EV Click Chips are able to efficiently purify ES EVs without any size bias, including exosomes, microvesicles, and oncosomes. Moreover, we demonstrate that the recovered ES EVs have well-preserved viability and RNA cargo contents, and can be used in downstream functional studies, that is, EV uptake and RNA cargo transfer, which are essential for exploring their physiological and pathological functions in intercellular communication.
Figure 1.

Schematic illustration of “ES-EV Click Chip” and its working mechanism based on covalent chemistry-mediated purification of ES EVs. i) Click chemistry (between Tz and TCO)-mediated specific EV capture in the presence of the anti-LINGO-1 antibody; ii) disulfide cleavage-driven rapid EV release upon exposure to DTT; iii) subjecting the purified ES EVs to downstream functional studies, that is, EV uptake and RNA cargo transfer.
2. Results and Discussions
2.1. Identification of LINGO-1 as a Specific Surface Marker of ES EVs
To determine the specificity of LINGO-1 (a transmembrane signaling protein considered as a new marker and therapeutic target expressed on ES tumor surface[40]) as an ES cell surface marker, we used immunofluorescence staining to evaluate the expression of LINGO-1 on ES cell lines (e.g., A673, ES-5838, and SK-ES-1 cell lines), and white blood cells (WBCs) isolated from healthy donors’ blood. For comparison, we also evaluated the expression of CD99 (a transmembrane glycoprotein commonly used as an ES cell surface marker[52,53]) on ES cell lines and WBCs. The fluorescent images (Figure 2A) showed that LINGO-1 was a specific surface marker expressed on all the three ES cell lines but not on WBCs, while CD99 was not specific for ES cells as it was also expressed on WBCs (Figure 2B). Then, ES EVs were isolated from the serum-free medium of ES cells, that is, A673 cells (female origin, harboring EWS-FLI1 type 1 rearrangement), ES-5838 cells (male origin, harboring EWS-ERG rearrangement), and SK-ES-1 cells (male origin, harboring EWS-FLI1 type 2 rearrangement), by ultracentrifugation.[17] TEM characterization showed that ES EVs had cup or spherical-shaped morphologies (Figure 2C). They had a diameter range of 30–1150 nm, of which 89% ranged in diameter of 30–150 nm. Then, immunogold-TEM was employed to detect LINGO-1 expression on ES EVs. As shown in Figure 2D, A673 EVs, ES-5838 EVs, and SK-ES-1 EVs were all labeled with multiple 10 nm gold nanoparticles (AuNPs) via mouse anti-LINGO-1 and goat anti-mouse IgG H&L 10 nm AuNPs. These results demonstrate the expression of LINGO-1 on the surface of ES EVs.
Figure 2.
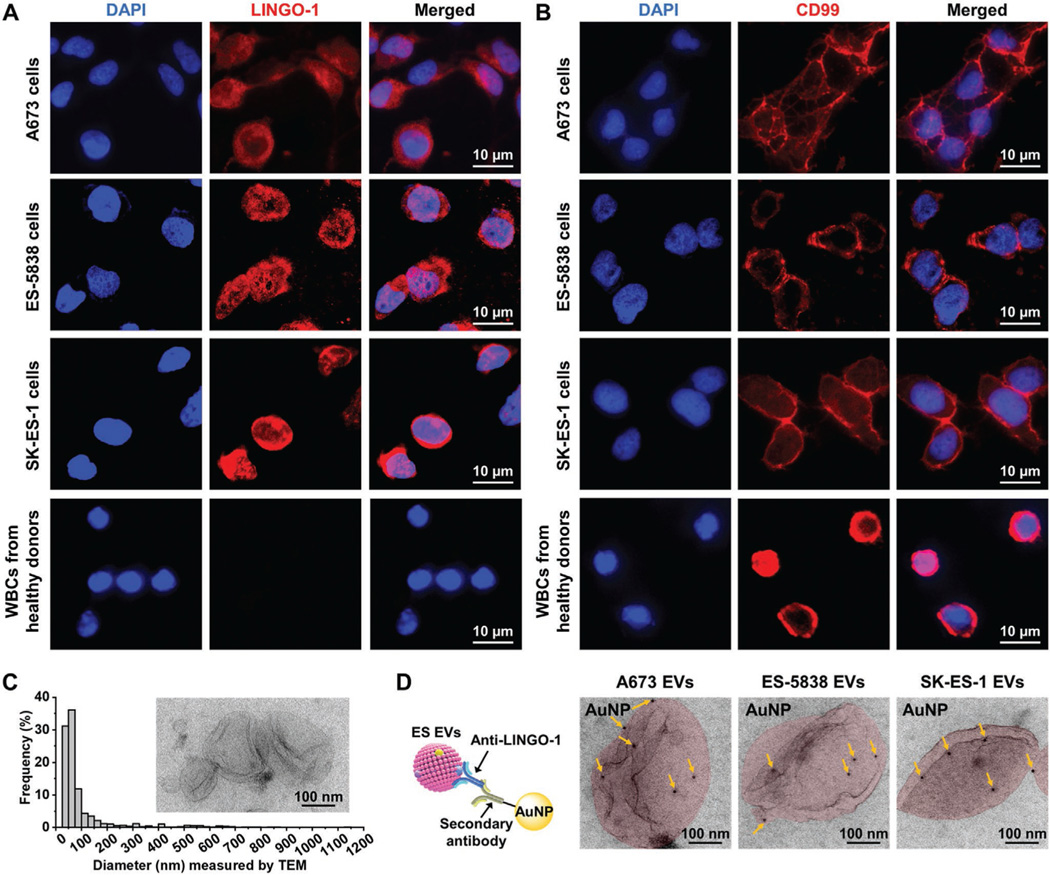
Detection of LINGO-1 expression on ES cell lines and ES EVs. A) Immunofluorescence images showing that LINGO-1 (red) was expressed on the cell plasma membrane of A673 cells, ES-5838 cells, and SK-ES-1 cells, with a granular pattern, but not on WBCs isolated from healthy donors’ blood. Nuclei of cells were stained with DAPI (blue). B) Immunofluorescence images showing that CD99 (red) was expressed on the cell membrane of A673 cells, ES-5838 cells, and SK-ES-1 cells, as well as WBCs, with a linear pattern. Nuclei of cells were stained with DAPI (blue). C) Size distribution of ES EVs (n = 886) measured by TEM. Inset is a TEM image of ES EVs. D) Schematic diagram (left) and TEM images (right) for detecting LINGO-1 expression on ES EVs, including A673 EVs, ES-5838 EVs, SK-ES-1 EVs (colored in red), using immunogold staining of LINGO-1. The yellow arrows point to the AuNPs labeled on the ES EVs.
2.2. Fabrication of ES-EV Click Chip Purification System
The ES-EV Click Chip is composed of two components: i) a Tz-grafted SiNWS and ii) a PDMS-based chaotic mixer with a serpentine microchannel. Si nanowires with diameters of 100–200 nm and lengths of 3–5 or 7–10 μm were fabricated via a combination of photolithographic patterning and silver (Ag) nanoparticle-templated wet etching.[54] The densely packed Si nanowires (spacings = 200–400 nm) provide large surface areas for immobilizing Tz moieties. Through a three-step modification process[55] (Figure S1, Supporting Information): i) vapor deposition of (3-mercaptopropyl) trimethoxysilane (MPS), ii) incorporation of a disulfide linker via ortho-pyridyl disulfide polyethylene glycol amine (OPSS-PEG-NH2), and iii) NHS ester reaction between Tz-sulfo-NHS ester and the terminal primary amine group on SiNWS, abundant Tz moieties were tethered onto the Si nanowires to generate the Tz-grafted SiNWS. PDMS-based chaotic mixers were fabricated with herringbone patterns by inductively coupled plasma-reactive ion etching (ICP-RIE).[45,56] The herringbone pattern spacings and microchannel widths/lengths/heights (2 mm × 60 mm × 70 μm) were configured to facilitate direct physical contact[56] between the functional SiNWS and EVs. Finally, a microfluidic chip holder was used to combine the PDMS-based chaotic mixer with the Tz-grafted SiNWS to make a complete ES-EV Click Chip, and an automated fluidic handler was employed to handle EV samples (Figure S2, Supporting Information).
Prior to EV capture studies, the complementary click chemistry moieties—TCO—were conjugated[57] onto goat antiLINGO-1 via the NHS ester reaction between TCO-PEG4-NHS ester and the primary amine groups on anti-LINGO-1 to produce TCO-anti-LINGO-1 conjugate. As a model system for testing the EV capture/release performance of ES-EV Click Chips, A673 EV samples were prepared by homogeneously re-suspending A673 EV pellets into serum-free medium and divided into several replicates (each 100 μL). The TCO-anti-LINGO-1 conjugate was pre-incubated with A673 EV samples to allow the specific antigen-antibody interaction. Then, the obtained TCO-anti-LINGO-1-grafted A673 EV sample was run through the ES-EV Click Chip, resulting in the efficient, chemo selective, and irreversible capture of A673 EVs on the Tz-grafted SiNWS via the IEDDA cycloaddition[46] between Tz and TCO moieties. Afterward, to release the captured EVs, DTT (50 mm, 50 μL) was injected into ES-EV Click Chip. DTT-mediated thiol-disulfide exchange reactions cause the reduction and cleavage of the disulfide bonds linking ES EVs or spare Tz moieties to SiNWS, resulting in the prompt release of captured ES EVs from the SiNWS.
2.3. Characterization of the ES-EV Capture and Release Process
To demonstrate the feasibility of click chemistry-mediated EV capture on SiNWS, we used PKH26 red-fluorescent dye to label A673 EVs (Figure 3A). The PKH26-labeled A673 EV samples were injected into the ES-EV Click Chips in the absence and presence of TCO-anti-LINGO-1 conjugate, respectively. After EV capture, SiNWS were disassembled from ES-EV Click Chips and observed by fluorescence microscopy. The dimmer appearance of SiNWS under fluorescence microscopy (Figure 3B) shows that the PKH26-labeled A673 EVs were unable to be captured on Tz-grafted SiNWS without TCO-anti-LINGO-1 conjugate. In comparison, numerous conspicuous red fluorescent spots, that is, PKH26-labeled A673 EVs, were captured on Tz-grafted SiNWS in the presence of TCO-anti-LINGO-1 conjugate and distributed evenly in a herringbone pattern. These results demonstrate that ES-EV Click Chips capture ES EVs in a TCO-anti-LINGO-1 dependent manner. Next, to observe the EV distribution on Tz-grafted SiNWS with higher resolution, scanning electron microscopy (SEM) was employed to characterize the tops and cross-sections of Si nanowire arrays. As shown in Figure 3C, both tips and sidewalls of Si nanowires had immobilized A673 EVs. Besides, Si nanowires with captured A673 EVs were mechanically detached from the substrate for TEM characterization. Figure 3D shows a TEM image of a single Si nanowire with various sizes of EVs captured on its tip and sidewalls. The results of EV distribution along the Si nanowires were consistent with the observation in our previous NanoVilli Chips.[33] Then, we used immunogold-TEM to detect the expression of CD63 (tetraspanins, a surface marker for EVs, preferentially small EVs[58]) on the captured A673 EVs. As shown in Figure 3E, EVs captured on a Si nanowire were successfully labeled with multiple 10 nm AuNPs. These results suggest that ES-EV Click Chips can effectively capture tumor-derived EVs without size bias and structural damage.
Figure 3.

Characterization of the ES-EV capture and release process. A) Schematic illustration showing that click chemistry-mediated capture of PKH26-labeled A673 EVs on ES-EV Click Chips in the presence of TCO-anti-LINGO-1 conjugate. B) Fluorescence images of PKH26-labeled A673 EVs (red fluorescent spots) that were immobilized on Tz-grafted SiNWS in the absence (left image) and presence (right image) of TCO-anti-LINGO-1 conjugate. C) SEM images displaying A673 EVs captured on the tips of Si nanowire arrays (left image) and the sidewalls of Si nanowires (right image). D) Schematic diagram (left) and TEM image (right) showing A673 EVs immobilized on a detached Si nanowire. E) Schematic representation (left) and TEM image (right) illustrating the immunogold staining for the detection of CD63 expression on the A673 EVs captured on a Si nanowire. F) Schematic diagram (left) and fluorescence image (right) showing the DTT-mediated release of PKH26-labeled EVs from the ES-EV Click Chip, resulting in the immediate diminution of PKH26-labeled A673 EVs (red fluorescent spots) on the SiNWS. G) Size distributions of A673 EVs (n = 615) purified by the ES-EV Click Chip. Inset is a TEM image of the purified A673 EVs. H) Immunogold-TEM image showing the expression of CD63 on the purified A673 EVs, indicating the integrity of the purified ES EVs.
To characterize the release process of ES EVs, DTT was injected into the ES-EV Click Chip, which had captured PKH26-labeled A673 EVs. As shown in Figure 3F, DTT resulted in the immediate diminution of the red fluorescence, indicating that the captured A673 EVs could be effectively released from the SiNWS. TEM characterization showed that the purified A673 EVs had cup- or spherical-shaped morphologies and diameters of 30–900 nm, of which 87% ranged in diameter of 30–150 nm (Figure 3G). The size distribution of the purified A673 EVs was also measured using dynamic light scattering (DLS). The recovered A673 EVs had a size distribution similar to that of A673 EVs before capture (Figure S3, Supporting Information). Moreover, the purified A673 EVs could also be labeled with multiple 10 nm AuNPs via immunogold staining of CD63 (Figure 3H), showing the integrity of the purified ES EVs.
2.4. Optimization of EV Capture/Release Performance of ES-EV Click Chips
To optimize the ES-EV capture performance of ES-EV Click Chips (Figure 4A), we injected TCO-anti-LINGO-1-grafted A673 EV samples into ES-EV Click Chips and extracted EV-derived RNA by introducing 700 μL of QIAzol lysis reagent (Qiagen, USA). Subsequently, RNA was purified with miRNeasy Micro Kits (Qiagen, USA) and quantified by Qubit RNA HS Assay using a Qubit 3.0 Fluorometer. The ES-EV capture efficiency was evaluated by calculating the mass fraction of the RNA extracted from the captured ES EVs (RNAcap) compared to the RNA extracted from the initially added ES EVs (RNAadd). We evaluated the effects of different experimental parameters, such as Si nanowire substrate, flow rate, pre-incubation time of TCO-anti-LINGO-1 and ES-EV samples, and concentration of TCO-anti-LINGO-1, on ES-EV capture efficiency. The influence of Si nanowire length (0, 3–5, and 7–10 μm) on ES-EV capture efficiency is shown in Figure 4B. With the increase of Si nanowire length, the ES-EV capture efficiency increased from 36% (Si nanowire = 0 μm) to 84% (Si nanowire = 7–10 μm) in the presence of 0.1 pmol of TCO-anti-LINGO-1 with a flow rate of 0.2 mL h−1. We used SEM characterization and dissipative particle dynamics simulation[59] in the previous development of NanoVilli Chips[33] to study the EV capture process by Si nanowire matrix and demonstrated that a total Si nanowire length of 10 μm was enough to enhance the capture of tumor-derived EVs. Therefore, we used the 7–10 μm Si nanowire in the subsequent studies. Next, we evaluated the effects of flow rates of 0.1, 0.2, 0.5, and 1.0 mL h−1 on ES-EV capture efficiency of ES-EV Click Chips. The results in Figure 4C show that the optimal flow rate was 0.2 mL h−1, consistent with the previously reported NanoVilli Chips.[33] We subsequently examined the pre-incubation time of TCO-anti-LINGO-1 conjugate and A673 EV samples and found that 20 min was enough to obtain a satisfactory capture efficiency (Figure 4D). Prolonging pre-incubation time to 30 min had no significant benefit. The effect of the TCOto-anti-LINGO-1 mole ratio on EV capture efficiency was also tested with a result of the optimal mole ratio of 4:1 (Figure 4E).
Figure 4.

Evaluation and optimization of EV capture/release performance of ES-EV Click Chips. A) Schematic diagram depicting that ES EVs (spiked into the serum-free medium) are subjected to a ES-EV Click Chip for evaluating the EV capture efficiency. B) EV capture efficiencies using different substrates. C) Effect of the flow rate on EV capture efficiency (Si nanowire length = 7–10 μm, TCO-anti-LINGO-1 = 0.1 pmol). D) Effect of the pre-incubation time of TCO-anti-LINGO-1 conjugate and EV samples on EV capture efficiency. E) Effect of TCO-to-anti-LINGO-1 mole ratio on EV capture efficiency. F) Schematic illustrating EV capture mechanisms of ES-EV Click Chips and NanoVilli Chips, respectively. G) EV capture efficiencies of ES-EV Click Chips and NanoVilli Chips with different amounts of TCO-anti-LINGO-1 and biotin-anti-LINGO-1, respectively. EV capture efficiency without any antibody was also evaluated on ES-EV Click Chips as a control. H) Schematic diagram illustrating that DTT is injected into ES-EV Click Chips for evaluating EV release efficiency. I) Effect of the flow rate on EV release efficiency with 50 μL of DTT (50 mm). J) Concentration optimization of DTT solution (50 μL) for EV release. K) The increase of DTT (50 mm) volume for improving the EV release efficiency.
Then, we compared the effects of different concentrations of anti-LINGO-1 conjugates on the capture efficiencies of ES-EV Click Chips and NanoVilli Chips. The schematic diagram of Figure 4F illustrates the different EV capture mechanisms of ES-EV Click Chips (i.e., click chemistry-mediated EV capture) and the previously reported NanoVilli Chips (i.e., immobilized antibody-mediated EV capture). According to the results shown in Figure 4G, only 27% of ES EVs were captured on ES-EV Click Chips in the absence of anti-LINGO-1, while 84% of ES EVs were captured on ES-EV Click Chips in the presence of 0.1 pmol of TCO-anti-LINGO-1. These results show that ES EVs are captured in a TCO-anti-LINGO-1 dependent manner. The EV capture efficiency of ES-EV Click Chips was up to maximum efficiency of 94% in the presence of 1 pmol of TCO-anti-LINGO-1. A higher quantity of TCO-anti-LINGO-1 did not further increase EV capture efficiency. Besides, ES-EV Click Chips had advantages of high efficiency and low antibody consumption over NanoVilli Chips, as NanoViili Chips need 500 times more biotin-anti-LINGO-1 (50 pmol) to achieve a capture efficiency of 78%. These can be attributed to the rapid, chemoselective, and irreversible click chemistry-mediated capture mechanism, as well as the significantly increased number of click reaction sites between TCO moieties grafted on EVs and Tz moieties functionalized on Si nanowire arrays, leading to the more efficient ES-EV immobilization on ES-EV Click Chips than NanoVilli Chips. Furthermore, the capture capacity of ES-EV Click Chips was examined by introducing different amounts of A673 EVs into the devices, followed by the quantification of EV-derived RNA. The ES-EV Click Chips were saturated after capturing a quantity of A673 EVs, which were lysed to obtain 200 ng of EV-derived RNA (Figure S4, Supporting Information).
After EV capture, DTT solution was injected into ES-EV Click Chips to release ES EVs from the SiNWS (Figure 4H). The EV release efficiency was calculated as the mass fraction of RNA extracted from the released ES EVs (RNArel) compared to the RNA extracted from the initially added ES EVs (RNAadd). We first used 50 μL of DTT (50 mm) to release ES EVs that were captured on the chips and evaluated the influence of flow rate (0.1, 0.2, and 0.5 mL h−1) on the EV release efficiency. As shown in Figure 4I, a flow rate of 0.2 mL h−1 enabled the captured EVs to be released in 15 min with a maximum efficiency of 68%. Neither a lower nor a higher flow rate increased EV release significantly. Next, we examined the effect of concentration (25, 50, and 70 mm) of DTT solution (50 μL) on EV release efficiency (Figure 4J). At a flow rate of 0.2 mL h−1, after DTT concentration increased to 50 mm, a more concentrated DTT solution (70 mm) with a defined DTT volume and exposure time did not significantly improve EV release efficiency. Then, we increased the volume of DTT (50 mm) solution in order to improve the EV release efficiency via the increase in DTT amount and exposure time. Results summarized in Figure 4K show that the ES-EV release efficiency increased gradually with the increasing volume of DTT, up to a maximum efficiency of 90% when 100 μL of DTT (50 mm) ran through ES-EV Click Chips. Overall, these results indicate that the ES EVs captured by ES-EV Click Chips can be effectively released by DTT-driven disulfide cleavage.
2.5. Detection of EWS Rearrangements in ES EVs by Coupling ES-EV Click Chips with Reverse Transcription Droplet Digital PCR
To demonstrate the feasibility of detecting EWS rearrangements using reverse transcription droplet digital PCR (RT-ddPCR) in ES EVs purified by the ES-EV Click Chips, artificial ES-EV plasma samples were prepared by homogeneously re-suspending ES EV pellets into healthy donors’ blood plasma (containing a significant quantity of normal cell-derived EVs) and divided into several replicates (each 100 μL). As illustrated in Figure 5A, ES-EV plasma samples were purified by ES-EV Click Chips, and RNA was extracted from the purified EVs and subjected to downstream RT-ddPCR for the quantification of EWS rearrangements (Figure S5 and Table S1, Supporting Information). The RNA extracted from the purified ES EVs (RNApur) was obtained by subtracting the RNA extracted from the background plasma (RNApla) from the total recovered RNA (RNArec). Then, the isolation efficiency was calculated as the mass fraction of RNApur compared to the RNA extracted from the initially added ES EVs (RNAadd). The specificity was evaluated through the copy number of EWS rearrangements, which are specific molecular markers of ES and have a linear correlation (y = 18.56x, R2 = 0.998) with the amount of ES EV-derived RNA (Figure S6, Supporting Information). Figure 5B shows that there is a positive linear correlation between the amount of artificial A673 EV plasma samples and the detected copy number of EWS-FLI1 type 1 rearrangement after ES-EV Click Chip purification.
Figure 5.

Detection of EWS rearrangements in ES EVs by coupling ES-EV Click Chips with RT-ddPCR. A) Schematic depicting the general workflow of ES-EV Click Chips to evaluate isolation efficiency and detect EWS rearrangements using artificial ES-EV plasma samples. B) Linear correlation between the amount of artificial A673 EV plasma samples and the detected copy number of EWS-FLI1 type 1 rearrangement after ES-EV Click Chip purification. C) Comparison of the isolation efficiency and specificity of ES-EV Click Chips using 1 pmol of TCO-anti-LINGO-1, TCO-anti-CD99, and TCO-anti-CD63 conjugates. D) Comparison of the isolation efficiency and specificity of ES-EV Click Chips, immunomagnetic beads, ultracentrifugation, and ExoQuick ULTRA EV Isolation Kit using artificial A673 EV plasma samples. E) The general applicability of ES-EV Click Chips for purifying different ES EVs, including A673 EVs (harboring EWS-FLI1 type 1 rearrangement), ES-5838 EVs (harboring EWS-ERG rearrangement), and SK-ES-1 EVs (harboring EWS-FLI1 type 2 rearrangement), from artificial plasma samples.
Then, we compared the isolation efficiency and specificity of ES-EV Click Chips using 1 pmol of TCO-anti-LINGO-1, TCO-anti-CD99, and TCO-anti-CD63 conjugates because CD99 had been used as an ES cell surface marker to isolate circulating tumor cells[52,53] and CD63 was used as a surface marker to isolate EVs (preferentially small EVs[58]). As shown in Figure 5C, TCO-anti-LINGO-1 had the highest isolation efficiency of 91% and detected 819 copies of EWS-FLI1 type 1 rearrangement in comparison with TCO-anti-CD99 (70%, 416 copies) and TCO-anti-CD63 (65%, 347 copies). Considering the fact that CD99 and CD63 are ubiquitously expressed on all EVs (i.e., ES EVs and background EVs in plasma samples), when the same quantity (1 pmol) of either TCO-anti-CD99 or TCO-anti-CD63 was added to the plasma sample, only a portion of ES EVs in the plasma sample was labeled with antibody, leading to the low recovery rates of ES EVs. In contrast, the small quantity (1 pmol) of TCO-anti-LINGO-1 (highly specific to ES EVs) is sufficient to label the ES EVs in the plasma sample, resulting in the high recovery rates of ES EVs. Therefore, anti-LINGO-1 is superior to anti-CD99 and anti-CD63 in the efficiency and specificity of purifying ES EVs with ES-EV Click Chips. The coefficient of variation (CV)% of isolation efficiency calculated from five independent tests was 4.0% (Table S2, Supporting Information), representing the ES-EV purification reproducibility of ES-EV Click Chips.
We further compared the isolation performance of ES-EV Click Chips with immunomagnetic beads[60] and ultracentrifugation[37] (two commonly used EV enrichment methods), as well as the ExoQuick ULTRA EV Isolation Kit for Serum and Plasma (non-specifically isolating total EVs using an EV precipitation mechanism). The results summarized in Figure 5D demonstrate that the efficiencies of isolating A673 EVs and copy numbers of EWS-FLI1 type 1 rearrangement of immunomagnetic beads (54%, 512 copies), ultracentrifugation (20%, 144 copies), and the ExoQuick Kit (26%, 156 copies) were significantly lower than that of ES-EV Click Chips (91%, 819 copies). Finally, we examined the general applicability of ES-EV Click Chips for purifying different ES EVs, including A673 EVs, ES-5838 EVs (harboring EWS-ERG rearrangement), and SK-ES-1 EVs (harboring EWS-FLI1 type 2 rearrangement). As summarized in Figure 5E, the chips achieved the efficient purification of ES-5838 EVs (90%, 762 copies) and SK-ES-1 EVs (86%, 731 copies). Altogether, these results show that ES-EV Click Chips have excellent performance for purifying ES EVs and enable the quantification of their specific molecular markers—EWS rearrangements. To demonstrate the potential clinical application of ES-EV Click Chips, we recruited four EWS rearrangement positive ES patients (confirmed by fluorescence in situ hybridization) and collected their plasma samples for this feasibility study. Control studies were performed on four healthy donors (HDs) in parallel. For each study, 0.3 mL of plasma sample was run through the ES-EV Click Chip under the optimal condition. After extracting RNA from the purified ES EVs, we successfully detected EWS rearrangements (copy number range from 35 to 216, Table S3, Supporting Information) using RT-ddPCR. All four HDs were negative for EWS rearrangements. These results showed that ES-EV Click Chips can potentially be used for non-invasive detection of EWS rearrangements for ES patients.
2.6. Downstream Functional Studies of the Recovered ES EVs
The recovered ES EVs can be co-cultured with recipient cells and studied for EV uptake and RNA cargo transfer (Figure 6A). Several studies[61,62] have shown that DTTox (i.e., trans-4,5-dihydroxy-1,2-dithiane, a nontoxic intramolecular disulfide form) has no apparent cytotoxicity. Before conducting the EV uptake study, we examined the influence of DTTox effluent on cell viability. DTT (50 mm) was oxidized into nontoxic DTTox by running through an ES-EV Click Chip without performing EV capture. Subsequently, DTTox effluent was added into the cell culture medium of A673 cells and incubated at 37 °C for 24 h. As a negative control group, DPBS solution was added into the cell culture medium of A673 cells. Afterward, the Cell Counting Kit-8 (CCK-8) assay was used to test cell viability. As shown in Figure 6B, DTTox effluent has a negligible effect on cell viability within 24 h.
Figure 6.

Downstream functional studies using the ES EVs purified by ES-EV Click Chips. A) Schematic illustrating the functional study by co-culturing the purified ES-5838 EVs and A673 cells, resulting in the ES-5838 EV uptake and mRNA cargo transfer into A673 cells. B) Effect of DTTox effluent on cell viability (%), which was calculated as the ratio of the OD450 value of the DTTox effluent-added group (deducting the blank OD450 value) to that of the negative control group (deducting the blank OD450 value). C) Representative fluorescence micrograph images of A673 cells co-cultured with the purified PKH26-labeled ES-5838 EVs (red) for 0, 1, 2, and 4 h. Nuclei of A673 cells were stained with DAPI (blue). D) Box plots showing the number of red fluorescence spots per A673 cell with internalized ES-5838 EVs after co-culturing for 0, 1, 2, and 4 h. The upper and lower box borders indicate the 25th and 75th percentiles, the horizontal line going through the box is the median, and the small solid square in the box (■) is the mean. The red line is the linear fitting curve made by the mean value. E) Copy number of EWS-ERG rearrangement (a specific molecular marker of ES-5838 EVs) detected within A673 cells after co-culturing with ES-5838 EVs for 0, 1, 2, and 4 h. F) Copy number of SRY transcript (a specific molecular marker of ES-5838 EVs) detected within A673 cells after co-culturing with ES-5838 EVs for 0, 1, 2, and 4 h.
To visualize the EV uptake process, PKH26-labeled ES-5838 EVs were purified by ES-EV Click Chips and co-cultured with A673 cells at 37 °C for 1, 2, and 4 h, respectively. A673 cells alone served as the negative controls (0 h). In parallel, the PKH26 negative control samples (without ES-5838 EVs) were also purified by ES-EV Click Chips and co-cultured with A673 cells. For static fluorescence imaging, A673 cells were washed with DPBS three times, fixed with 4% paraformaldehyde (PFA), stained with 4′,6-diamidino-2-phenylindole (DAPI), and imaged using a 40× objective lens on a Nikon Eclipse Ti fluorescence microscope under bright field, lasers 405 nm (DAPI) and 561 nm (PKH26). As shown in Figure 6C, after co-culturing for 1 h, red fluorescent spots had bound to the surface of A673 cells and appeared inside the cells, indicating that the recovered PKH26-labeled ES-5838 EVs were taken up and internalized by A673 cells. With the extension of co-culturing time to 4 h, accumulating red fluorescent spots were observed inside A673 cells. In contrast, there was no red fluorescent signal in A673 cells of the corresponding negative control groups at 1, 2, and 4 h (Figure S7, Supporting Information). We calculated the number of red fluorescent spots that were internalized by A673 cells after co-culturing for 1, 2, and 4 h. As summarized in Figure 6D, the medians of spots per A673 cell with internalization were 3, 8, and 16 spots for 1, 2, and 4 h groups, respectively. The linear fitting curve (y = 4.29x, R2 = 0.998) indicated an increasing trend of EV uptake over time. The dynamic process of EV uptake and internalization by live A673 cells was also photographed once every 15 min for 90 min using a 40× objective lens on the Nikon Eclipse Ti fluorescence microscope under bright field and laser 561 nm (Video S1, Supporting Information).
Furthermore, it has been recognized that EVs are able to transfer their RNA cargoes to recipient cells both in vitro and in vivo.[8] Because the male ES-5838 cell-derived EVs harbor unique EWS-ERG rearrangement and sex-determining region of the Y-chromosome (SRY) transcripts, which are not present in female A673 cells, the EWS-ERG rearrangement and SRY expression could be used as specific molecular markers for quantification of ES-5838 EVs that were internalized by A673 cells. Therefore, after co-culturing with ES-5838 EVs for 1, 2, and 4 h, A673 cells in wells were washed with DPBS three times, treated with 0.25% trypsin-EDTA at 37 °C for 1 min and washed thoroughly with the citric acid buffer to remove the unbound EVs and cell surface-bound EVs. After centrifugation at 300 g for 10 min, A673 cell pellets were lysed by 700 μL of QIAzol lysis reagent and purified with miRNeasy Mini Kits (Qiagen). The purified RNA was subjected to RT-ddPCR quantification. Both EWS-ERG rearrangement and SRY transcript were detectable in A673 cells with ES-5838 EV uptake. As summarized in Figure 6E,F, the average copy numbers of EWS-ERG rearrangement and SRY transcript were (35 copies, 25 copies), (74 copies, 49 copies), (145 copies, 95 copies) for 1, 2, and 4 h groups, respectively. The linear fitting curves showed that the accumulation of EWS-ERG rearrangement (y = 36.35x, R2 = 0.999) and SRY transcript (y = 23.88x, R2 = 0.999) in the recipient cells occurred in a time-dependent manner. Altogether, these results demonstrate that the ES EVs recovered from ES-EV Click Chips exhibit well-preserved viability and can successfully transfer their RNA cargo contents to recipient cells.
3. Conclusion
We have developed and demonstrated a novel ES-EV purification system—ES-EV Click Chip—by coupling covalent chemistry-mediated EV capture/release within a nanostructure-embedded microchip. This device exploits specific anti-LINGO-1 recognition, sensitive click chemistry-mediated EV capture, and disulfide cleavage-driven EV release on a SiNWS-embedded microfluidic platform, realizing the highly efficient purification of ES EVs while maintaining their well-preserved integrity and biological activity. We used fluorescence microscopy, TEM, SEM, and DLS characterization to demonstrate the EV capture and release features of ES-EV Click Chips. The ES-EV Click Chip platform has several distinct advantages. i) ES-EV Click Chips were optimized to have higher capture efficiency and lower antibody consumption compared with the previously reported NanoVilli Chips.[33] This improvement is attributed to the rapid, chemoselective, and irreversible click chemistry-mediated capture mechanism, as well as the significantly increased number of click reaction sites between TCO moieties grafted on EVs and Tz moieties functionalized on Si nanowire arrays. ii) Compared to other potential capture agents, such as anti-CD99 and anti-CD63, the use of anti-LINGO-1 in ES-EV Click Chips significantly improves the efficiency and specificity of ES-EV enrichment. iii) Furthermore, the mild reagent DTT-mediated disulfide bond cleavage enables the subsequent release of ES EVs with high efficiency. Compared with other EV capture and release strategies on nanostructured substrates (e.g., the immune-affinity EV capture/proteinase K and temperature-responsive dual EV release strategy[32] and the non-specific exosome trapping/porous silicon nanowire dissolving strategy[63]), ES-EV Click Chips could purify ES EVs under milder conditions with high specificity and isolation efficiency, enhanced reproducibility, reduced cost and time consumptions, as well as recovering tumor-derived EVs with well-preserved integrity for downstream functional studies. We demonstrated that ES-EV Click Chip could purify ES EVs without any size bias and recover them with well-preserved viability and RNA cargo contents. The recovered ES EVs can be rapidly internalized and shuttle their RNA cargoes to recipient cells, which can be leveraged to explore their physiologic and potential pathologic roles in intercellular communication.
4. Experimental Section
Fabrication of ES-EV Click Chip Devices:
ES-EV Click Chip device consists of i) a Tz-grafted SiNWS and ii) a PDMS-based chaotic mixer. First, SiNWS with densely packed Si nanowires (diameters = 100–200 nm, spacings = 200–400 nm, lengths of 3–5 or 7–10 μm) were prepared by a combination of photolithographic patterning and AgNP-templated wet etching[54] according to the following procedures: i) (100) p-type Si wafers (Silicon Quest International) were spin-coated with a thin-film photoresist (AZ 5214, AZ Electronic Materials USA Corp.) and exposed to ultraviolet light; ii) the wafers were immersed into etching solution with hydrofluoric acid (4.6 m, Sigma-Aldrich) and silver nitrate (0.2 m, Sigma-Aldrich); and iii) the wafers were treated with boiling aqua regia (i.e., hydrochloric acid/nitric acid, 3:1 v/v, Sigma-Aldrich) to remove the silver film. The resultant SiNWS were incubated with a piranha solution (sulfuric acid/hydrogen peroxide, 2:1 v/v, Sigma-Aldrich). Next, Tz moieties with disulfide linkers were functionalized onto the SiNWS via a 3-step chemical modification[55] process: i) exposing the SiNWS to silane vapor of MPS (95%, 200 μL, Sigma-Aldrich) in a sealed vacuum desiccator for 45 min; ii) incubating the SiNW with 200 μL of dimethyl sulfoxide (DMSO) solution containing OPSS-PEG-NH2 (3.8 mm, Nanocs Inc.) for 2 h at room temperature; and iii) further incubating the SiNW with 200 μL of PBS solution containing Tz-sulfo-NHS ester (3.8 mm; Click Chemistry Tools) for 1 h at room temperature. Thus, Tz-grafted SiNWS were produced and ready to use.
Second, PDMS-based microfluidic chaotic mixers[45] were prepared by ICP-RIE.[56] Briefly, i) a master wafer was photolithographically prepared by spin-coating a layer of negative photoresist (MicroChem Corp.) with a thickness of 100 μm onto a silicon wafer; ii) after exposure to UV light with a photomask containing a 2.0-mm-width serpentine rectangular microfluidic channel, the second layer of negative photoresist was spin-coated with a thickness of 40 μm; iii) using a Mask Aligner (Karl Suss America Inc.), the second photomask containing herringbone ridges was aligned between the former pattern and the one to be imprinted; iv) the Si master was exposed to trimethylchlorosilane (99%, Sigma-Aldrich) vapor for 1 min and transferred to a petri dish; v) for replica molding, well-mixed PDMS precursor (RTV 615 A and B in a 10:1 ratio; GE Silicones) was filled into the petri dish, degassed, and incubated in an oven at 80 °C to make a 5-mm-thick PDMS-based chaotic mixer; and vi) the produced PDMS-based chaotic mixer was peeled off and punched with two through-holes at the ends of the serpentine rectangular microfluidic channel for insertion of tubing. Finally, the above Tz-grafted SiNWS and PDMS-based chaotic mixer were combined in a custom-designed chip holder to give an ES-EV Click chip device. Then, ES-EV Click chip device was placed in an automated digital fluidic handler to control the loading and flow of reagents and EV samples.
Preparation of TCO-Antibody Conjugates:
The TCO-anti-LINGO-1 conjugate was produced by incubating TCO-PEG4-NHS ester (4 μm, Click Chemistry Tools) with polyclonal goat IgG human LINGO-1 antibody (1 μm, R&D Systems Inc.) in PBS solution (pH 7.4) at room temperature for 30 min. TCO-anti-CD99 and TCO-anti-CD63 conjugates were prepared accordingly by incubating TCO-PEG4-NHS ester (4 μm, Click Chemistry Tools) with polyclonal goat IgG human CD99 antibody (1 μm, R&D Systems Inc.) and monoclonal mouse IgG1 human CD63 antibody (1 μm, R&D Systems Inc.), respectively. The resultant TCO-antibody conjugates (1 μm) in PBS solution were stored at −20 °C until use.
Culture of ES Cell Lines:
ES cell lines, that is, A673 cells (female origin, harboring EWS-FLI1 type 1 rearrangement) and SK-ES-1 cells (male origin, harboring EWS-FLI1 type 2 rearrangement) were obtained from the American Type Culture Collection (ATCC) and regularly tested negative for mycoplasma contamination. ES-5838 cells (male origin, harboring EWS-ERG rearrangement) were provided by Dr. James S. Tomlinson’s Lab (UCLA). These cells were grown in 18 Nunc EasYDish dishes (150 mm, Thermo Fisher Scientific) with Dulbecco’s Modified Eagle’s Medium (Thermo Fisher Scientific), fetal bovine serum (10% v/v, Thermo Fisher Scientific), GlutaMAX-I (1% v/v, Thermo Fisher Scientific), and penicillin–streptomycin (100 U mL−1, Thermo Fisher Scientific) in a humidified incubator with 5% CO2 at 37 °C for 3 days.
Immunofluorescence Characterization of LINGO-1 and CD99 Expression on Cells:
To demonstrate the specificity of LINGO-1 expression on ES cells, WBCs were isolated from the peripheral venous blood sample of a healthy donor with approval from UCLA Institutional Review Board (IRB, #00000173) and served as the control group of ES cells. A673 cells, ES-5838 cells, SK-ES-1 cells, and WBCs on glass coverslips were detected with the following immunocytochemistry (ICC) protocol. First, cells were fixed with 4% PFA fixative solution (Electron Microscopy Sciences) for 20 min and subsequently incubated with 0.1% Triton X-100 for 10 min at room temperature. Next, these cells were incubated overnight at 4 °C with the primary antibody, that is, polyclonal goat IgG human LINGO-1 antibody (1:100 v/v) or polyclonal goat IgG human CD99 antibody (1:40 v/v), in 200 μL of PBS containing 2% donkey serum (Jackson ImmunoResearch). After washing with PBS, these cells were incubated with the secondary antibody, that is, donkey anti-goat IgG (H+L) (Alexa Fluor 647, 1:500 v/v; Invitrogen) in 200 μL of PBS containing 2% donkey serum at room temperature for 1 h. After washing with PBS, these cells were treated with DAPI solution (1:1000 v/v, Invitrogen). Thereafter, these cells were imaged using a 40× objective lens on a Nikon Eclipse 90i fluorescence microscope.
Isolation and Preparation of ES-EV Samples:
ES cells were cultured in serum-free medium for 24 h. A total of 234 mL of medium was collected in six Falcon 50 mL conical centrifuge tubes (Thermo Fisher Scientific) and centrifuged at 4 °C and 300 g for 10 min to remove cells and cellular debris. The supernatant was centrifuged at 4 °C and 4600 g for 30 min to eliminate large particles. Thereafter, the supernatant was transferred to six Ultra-Clear Tubes (38.5 mL, Beckman Coulter, Inc., USA) and centrifuged at 4 °C and 100 000 g for 2 h using Optima L-100 XP Ultracentrifuge (Beckman Coulter, Inc, USA). For making model EV samples, the resultant EV pellet was resuspended in 2 mL of serum-free medium and divided into 20 equal parts (each 100 μL). For making artificial EV plasma samples, the EV pellet was resuspended in 2 mL of blood plasma collected from a female healthy donor with approval from the UCLA Institutional Review Board (IRB, #00000173), and divided into 20 aliquots (each 100 μL). These ES-EV samples were stored at −80 °C for future use.
EV Labeling with PKH26 Red-Fluorescent Dye:
ES EVs were labeled with PKH26 red fluorescent cell linker kit (Sigma-Aldrich) according to the instructions with some modifications.[64] Briefly, EV pellets were resuspended in 500 μL of Diluent C. Separately, 500 μL Diluent C was mixed with 2 μL of PKH26 red-fluorescent dye (1 mm) to prepare a 2× dye (4 μm) solution. After mixing the EV and PKH26 solution for 5 min at 4 °C, 1 mL of 1% bovine serum albumin (BSA, Sigma-Aldrich) was added to bind excess dye. Then, the PKH26-labeled EVs were washed with PBS through ultracentrifugation at 4 °C and 100 000 g for 2 h to remove the free PKH26 dye. The pellet was resuspended in PBS and divided into several replicates. Meanwhile, as a negative control, PKH26 dye alone (without ES EVs) was also washed with PBS by ultracentrifugation and diluted in PBS to make the PKH26 negative control sample.
ES-EV Capture and Release by ES-EV Click Chips:
Prior to capture, the ES-EV sample (100 μL) was pre-incubated with the TCO-anti-LINGO-1 conjugate for 20 min at room temperature. Meanwhile, 200 μL of PBS was injected into ES-EV Click Chip at a flow rate of 1 mL h−1 to test leaks. The resultant TCO-grafted EV sample was then introduced into ES-EV Click Chip at an optimal flow rate of 0.2 mL h−1 and captured on the Tz-grafted SiNWS via the click chemistry-mediated EV capture. Afterward, to release the EVs captured on chips, a DPBS solution (50–100 μL) containing DTT (50 mm) was injected into ES-EV Click Chip at an optimal flow rate of 0.2 mL h−1. The released EVs were collected into a 1.5-mL ribonuclease (RNase)-free Eppendorf tube.
TEM Characterization:
The ES EVs in solution or on Si nanowires mechanically detached from the SiNWS after EV capture/release were fixed in 4% PFA for 30 min at room temperature. Next, 5 μL of samples were placed onto formvar and carbon-coated copper grids (200-mesh) and incubated for 5 min. After blotting the excess samples with filter paper, grids were negatively stained with 2% uranyl acetate for 10 min. After rinsing with deionized water three times, samples were dried and imaged using a JEM1200-EX (JEOL USA Inc.) at 80 kV.
For immunogold-TEM, 5 μL of samples were placed onto formvar and carbon-coated nickel grids (200-mesh) and incubated for 5 min. After wiping off the excess samples, grids were blocked in a blocking solution containing 0.4% BSA for 30 min and rinsed with deionized water three times. Then samples were incubated with monoclonal mouse IgG1 human LINGO-1 antibody (clone # 332237, 1:1000 v/v, R&D Systems Inc.) or monoclonal mouse anti-CD63 (1:500 v/v, Abcam) for 1 h. Meanwhile, samples were incubated with the blocking solution as negative controls. After rinsing with deionized water three times, the samples were incubated with goat anti-mouse IgG H&L 10-nm gold (1:40 v/v, Abcam) for 1 h. Thereafter, grids were rinsed and negatively stained with 2% uranyl acetate, followed by drying and TEM imaging.
SEM Characterization:
To characterize the distribution of EVs on Si nanowire arrays after capture/release, SiNWS were cut to expose the cross-sections of Si nanowire arrays and incubated with 4% PFA for 1 h at room temperature. Next, the substrates were dehydrated by sequentially immersing in 30%, 50%, 75%, 85%, 95%, and 100% ethanol solutions for 10 min per solution. After drying, the substrates were sputter-coated with gold and imaged under a ZEISS Supra 40VP SEM at an accelerating voltage of 10 keV.
DLS Characterization:
The size distributions of EVs before capture and after release were measured using Malvern Zetasizer Nano ZS. EV samples were diluted 1:10 or 1:20 in the cuvette and analyzed by Malvern Zetasizer Nano ZS to give the size distribution.
Extraction and Quantification of RNA from ES EVs:
For EVs captured on ES-EV Click Chips, RNA was extracted by introducing 700 μL of QIAzol lysis reagent at a flow rate of 0.5 mL h−1 for 200 μL and then 60 mL h−1 for the leftover 500 μL. The outflow was collected in a 1.5-mL ribonuclease (RNase)-free Eppendorf tube. For EVs before capture and after release in solution, 700 μL of QIAzol lysis reagent was added to lyse EVs in 1.5-mL ribonuclease (RNase)-free Eppendorf tubes. The extracted EV-derived RNA was purified with miRNeasy Micro Kits (Qiagen), according to the manufacturer’s protocol. During the RNA purification process, DNase I (RNase-free, Thermo Fisher Scientific) was used to digest DNA for 15 min at room temperature. Finally, RNA was dissolved in DNase/RNase-free water and centrifuged off the RNeasy MinElute Spin Columns into 1.5-mL ribonuclease (RNase)-free collection tubes. The RNA was quantified with Qubit 3.0 Fluorometer (Thermo Fisher Scientific, USA) and Qubit RNA HS Assay according to the manufacturer’s instructions.
RT-ddPCR Detection:
RNA was reverse-transcribed to cDNA with a Maxima H Minus Reverse Transcriptase Kit (Thermo Fisher Scientific, USA) according to the manufacturer’s protocol. The reverse transcription reaction was performed at 55 °C for 30 min and 85 °C for 5 min. Thereafter, cDNA was detected with ddPCR Supermix for Probes (No dUTP, Bio-Rad). EWS rearrangements were detected using self-designed primers and probes (Table S1, Supporting Information). SRY transcript was detected using a commercial primer/probe kit (Catalog# 4331182; Assay ID: Hs00976796_s1, Thermo Fisher Scientific). Droplets containing ddPCR reaction were transferred into a 96-well plate and sealed. ddPCR reaction was performed at 96 °C for 10 min, followed by 40 cycles (94 °C for 30 s and 60 °C for 60 s) and 98 °C for 10 min. The DNA amplicons contained in droplets were detected by a QX200 Droplet Reader in combination with a QuantaSoft software package.
Comparison with Immunomagnetic Beads, Ultracentrifugation, and ExoQuick ULTRA EV Isolation Kit:
For immunomagnetic bead separation, Tz-grafted magnetic beads were prepared by incubating 2.8 μm Dynabeads M-270 Amine (2 × 10⁸ beads, 100 μL, Thermo Fisher Scientific) with Tz-sulfo-NHS ester (0.32 mg, Click Chemistry Tools, USA) in PBS buffer for 1 h at room temperature. Each artificial A673 EV plasma sample was pre-incubated with the TCO-anti-LINGO-1 conjugate (1 pmol) for 20 min and incubated with Tz-grafted magnetic beads (2 × 10⁷ beads) at room temperature for 30 min to isolate A673 EVs. For ultracentrifugation, each artificial A673 EV plasma sample was centrifuged at 100 000 g for 2 h using Optima L-100 XP Ultracentrifuge. For the commercially used EV isolation assay, each artificial A673 EV plasma sample was isolated and purified using the ExoQuick ULTRA EV Isolation Kit (System Biosciences) according to the manufacturer’s protocol. For all the methods, RNA was extracted from the isolated EVs and quantified using Qubit 3.0 Fluorometer (Thermo Fisher Scientific), followed by quantification of EWS-FLI1 type 1 rearrangement using RT-ddPCR detection. Healthy-donor plasma samples without A673 EVs were processed in parallel to give the systems’ RNA background.
CCK-8 Cell Viability Assay:
A673 cells (5 × 10³ cell/well) were evenly plated into a sterile 96-well cell culture plate with the cell culture medium (250 μL per well) and pre-incubated in a humidified incubator with 5% CO2 at 37 °C for 24 h. For the DTTox effluent-added group, 50 μL of DTTox effluent was added into the culture medium of each well and incubated with A673 cells for 24 h. For the negative control, 50 μL of DPBS solution was added and incubated with A673 cells for 24 h. Thereafter, CCK-8 (Sigma-Aldrich) assay was used to test the effect of DTTox effluent on cell viability. The cell culture medium of A673 cells in each well was replaced with 10 μL of CCK-8 solution and 100 μL of serum-free medium. Meanwhile, a blank well without A673 cells was also added with 10 μL of CCK-8 solution and 100 μL of serum-free medium to serve as the blank of CCK-8 assay. After incubating for 4 h, the solution of each well was transferred to a Costar 96 Flat Transparent plate and placed into the Tecan Infinite 200 PRO. The optical density (OD, absorbance) at 450 nm was measured with an i-control Microplate Reader. The cell viability (%) was calculated as the ratio of the OD450 value of the DTTox effluent-added group (deducting the blank OD450 value) to that of the negative control group (deducting the blank OD450 value).
Downstream Functional Studies:
A673 cells (5 × 10³ cell/well) were evenly plated into a sterile 96-well cell culture plate with the cell culture medium (250 μL per well) and pre-incubated in a humidified incubator with 5% CO2 at 37 °C for 24–48 h. Then, the cell culture medium was replaced with serum-free medium (250 μL per well) to study EV uptake. Before the addition of ES-5838 EVs, the wells with A673 cells alone served as the negative controls (0 h). After being released from ES-EV Click Chip, PKH26-labeled ES-5838 EVs (50 μL) were added to the wells and co-cultured with A673 cells at 37 °C for 1, 2, and 4 h, respectively. In parallel, the PKH26 negative control sample was also purified by ES-EV Click Chips and co-cultured with A673 cells at 37 °C for 1, 2, and 4 h, respectively.
Fluorescence Imaging of Uptake Process of ES EVs into Recipient Cells:
For static fluorescence imaging, A673 cells were washed with DPBS three times, fixed with 4% PFA for 10 min, stained with DAPI [1:1000 v/v] for 10 min, and imaged using a 40× objective lens on a Nikon Eclipse Ti fluorescence microscope under bright field, lasers 405 nm (DAPI) and 561 nm (PKH26). For dynamic monitoring of the ES-5838 EV uptake and internalization process by live A673 cells, the 96-well cell culture plate was placed on the 3D automatic objective table and photographed once every 15 min for 90 min using a 40× objective lens on the Nikon Eclipse Ti fluorescence microscope under bright field and laser 561 nm (PKH26).
Detection of Gene Transcripts in Recipient Cells after EV Uptake:
For detecting the EWS-ERG rearrangement and SRY transcript of ES-5838 EVs internalized by A673 cells after co-culturing, A673 cells were washed with DPBS three times and treated with 0.25% trypsin-EDTA (Thermo Fisher Scientific) at 37 °C for 1 min and washed thoroughly with the citric acid buffer to remove the unbound EVs and cell surface-bound EVs. A673 cells were centrifuged at 300 g for 10 min. The cell pellets were lysed by 700 μL of QIAzol lysis reagent and purified with miRNeasy Mini Kits (Qiagen) according to the manufacturer’s protocol. The purified RNA was subjected to RT-ddPCR detection.
Supplementary Material
Acknowledgements
This work was supported by the National Institutes of Health (U01CA198900, U01EB026421, R01CA218356, R21CA235340, R01CA246304, R01CA253651, and R21CA240887).
Footnotes
Supporting Information
Supporting Information is available from the Wiley Online Library or from the author.
Conflict of Interest
The authors declare no conflict of interest.
Contributor Information
Jiantong Dong, California NanoSystems Institute Crump Institute for Molecular Imaging Department of Molecular and Medical Pharmacology University of California Los Angeles (UCLA) 570 Westwood Plaza, Los Angeles, CA 90095, USA; Beijing National Laboratory for Molecular Sciences MOE Key Laboratory of Bioorganic Chemistry and Molecular Engineering College of Chemistry and Molecular Engineering Peking University 202 Chengfu Road, Haidian District, Beijing 100871, China.
Ryan Y. Zhang, California NanoSystems Institute Crump Institute for Molecular Imaging Department of Molecular and Medical Pharmacology University of California Los Angeles (UCLA) 570 Westwood Plaza, Los Angeles, CA 90095, USA
Na Sun, California NanoSystems Institute Crump Institute for Molecular Imaging Department of Molecular and Medical Pharmacology University of California Los Angeles (UCLA) 570 Westwood Plaza, Los Angeles, CA 90095, USA.
Junhui Hu, Department of Molecular and Medical Pharmacology David Geffen School of Medicine UCLA 650 Charles E Young Dr., Los Angeles, CA 90095, USA.
Matthew D. Smalley, California NanoSystems Institute Crump Institute for Molecular Imaging Department of Molecular and Medical Pharmacology University of California Los Angeles (UCLA) 570 Westwood Plaza, Los Angeles, CA 90095, USA
Anqi Zhou, California NanoSystems Institute Crump Institute for Molecular Imaging Department of Molecular and Medical Pharmacology University of California Los Angeles (UCLA) 570 Westwood Plaza, Los Angeles, CA 90095, USA.
Hua Yue, California NanoSystems Institute Crump Institute for Molecular Imaging Department of Molecular and Medical Pharmacology University of California Los Angeles (UCLA) 570 Westwood Plaza, Los Angeles, CA 90095, USA.
Winston Rothermich, California NanoSystems Institute Crump Institute for Molecular Imaging Department of Molecular and Medical Pharmacology University of California Los Angeles (UCLA) 570 Westwood Plaza, Los Angeles, CA 90095, USA.
Mengxiang Chen, California NanoSystems Institute Crump Institute for Molecular Imaging Department of Molecular and Medical Pharmacology University of California Los Angeles (UCLA) 570 Westwood Plaza, Los Angeles, CA 90095, USA.
Jiayuan Chen, California NanoSystems Institute Crump Institute for Molecular Imaging Department of Molecular and Medical Pharmacology University of California Los Angeles (UCLA) 570 Westwood Plaza, Los Angeles, CA 90095, USA.
Jinglei Ye, California NanoSystems Institute Crump Institute for Molecular Imaging Department of Molecular and Medical Pharmacology University of California Los Angeles (UCLA) 570 Westwood Plaza, Los Angeles, CA 90095, USA.
Pai-Chi Teng, California NanoSystems Institute Crump Institute for Molecular Imaging Department of Molecular and Medical Pharmacology University of California Los Angeles (UCLA) 570 Westwood Plaza, Los Angeles, CA 90095, USA.
Dongping Qi, California NanoSystems Institute Crump Institute for Molecular Imaging Department of Molecular and Medical Pharmacology University of California Los Angeles (UCLA) 570 Westwood Plaza, Los Angeles, CA 90095, USA.
Jeffrey A. Toretsky, Departments of Oncology and Pediatrics Georgetown University 3970 Reservoir Rd NW, Washington, DC 20057, USA
James S. Tomlinson, Department of Surgery UCLA 200 Medical Plaza, Los Angeles, CA 90024, USA
Mengyuan Li, Beijing National Laboratory for Molecular Sciences MOE Key Laboratory of Bioorganic Chemistry and Molecular Engineering College of Chemistry and Molecular Engineering Peking University 202 Chengfu Road, Haidian District, Beijing 100871, China.
Paul S. Weiss, California NanoSystems Institute Departments of Chemistry and Biochemistry Bioengineering, and Materials Science and Engineering UCLA 570 Westwood Plaza, Los Angeles, CA 90095, USA
Steven J. Jonas, Department of Pediatrics Ronald Reagan UCLA Medical Center UCLA Mattel Children’s Hospital 10833 Le Conte Ave, Los Angeles, CA 90095, USA
Noah Federman, Department of Pediatrics Ronald Reagan UCLA Medical Center UCLA Mattel Children’s Hospital 10833 Le Conte Ave, Los Angeles, CA 90095, USA.
Lily Wu, Department of Molecular and Medical Pharmacology David Geffen School of Medicine UCLA 650 Charles E Young Dr., Los Angeles, CA 90095, USA.
Meiping Zhao, Beijing National Laboratory for Molecular Sciences MOE Key Laboratory of Bioorganic Chemistry and Molecular Engineering College of Chemistry and Molecular Engineering Peking University 202 Chengfu Road, Haidian District, Beijing 100871, China.
Hsian-Rong Tseng, California NanoSystems Institute Crump Institute for Molecular Imaging Department of Molecular and Medical Pharmacology University of California Los Angeles (UCLA) 570 Westwood Plaza, Los Angeles, CA 90095, USA.
Yazhen Zhu, California NanoSystems Institute Crump Institute for Molecular Imaging Department of Molecular and Medical Pharmacology University of California Los Angeles (UCLA) 570 Westwood Plaza, Los Angeles, CA 90095, USA.
References
- [1].Raposo G, Stoorvogel W, Cell Biol J. 2013, 200, 373. [DOI] [PMC free article] [PubMed] [Google Scholar]
- [2].van Niel G, D’Angelo G, Raposo G, Nat. Rev. Mol. Cell Biol 2018, 19, 213. [DOI] [PubMed] [Google Scholar]
- [3].Maas SLN, Breakefield XO, Weaver AM, Trends Cell Biol. 2017, 27, 172. [DOI] [PMC free article] [PubMed] [Google Scholar]
- [4].Maacha S, Bhat AA, Jimenez L, Raza A, Haris M, Uddin S, Grivel JC, Mol. Cancer 2019, 18, 55. [DOI] [PMC free article] [PubMed] [Google Scholar]
- [5].Das S, Ansel KM, Bitzer M, Breakefield XO, Charest A, Galas DJ, Gerstein MB, Gupta M, Milosavljevic A, McManus MT, Patel T, Raffai RL, Rozowsky J, Roth ME, Saugstad JA, Van Keuren-Jensen K, Weaver AM, Laurent LC, Cell 2019, 177, 231.30951667 [Google Scholar]
- [6].Huang L, Gu N, Zhang X-E, Wang D-B, Adv. Funct. Mater 2019, 29, 1807189. [Google Scholar]
- [7].Hong Y, Nam G-H, Koh E, Jeon S, Kim GB, Jeong C, Kim D-H, Yang Y, Kim I-S, Adv. Funct. Mater 2018, 28, 1703074. [Google Scholar]
- [8].Raposo G, Stahl PD, Nat. Rev. Mol. Cell Biol 2019, 20, 509. [DOI] [PubMed] [Google Scholar]
- [9].Zhang Y, Jin X, Liang J, Guo Y, Sun G, Zeng X, Yin H, Sci. Adv 2019, 5, eaav1564. [DOI] [PMC free article] [PubMed] [Google Scholar]
- [10].Jin Y, Lee JS, Min S, Park H-J, Kang TJ, Cho S-W, Adv. Funct. Mater 2016, 26, 5804. [Google Scholar]
- [11].Raimondo S, Giavaresi G, Lorico A, Alessandro R, Int. J. Mol. Sci 2019, 20, 1848. [DOI] [PMC free article] [PubMed] [Google Scholar]
- [12].Rahbarghazi R, Jabbari N, Sani NA, Asghari R, Salimi L, Kalashani SA, Feghhi M, Etemadi T, Akbariazar E, Mahmoudi M, Rezaie J, Cell Commun. Signal 2019, 17, 73. [DOI] [PMC free article] [PubMed] [Google Scholar]
- [13].Hu J, Sheng Y, Kwak KJ, Shi J, Yu B, Lee LJ, Nat. Commun 2017, 8, 1683. [DOI] [PMC free article] [PubMed] [Google Scholar]
- [14].Zhao J, Liu C, Li Y, Ma Y, Deng J, Li L, Sun J, J. Am. Chem. Soc 2020, 142, 4996. [DOI] [PubMed] [Google Scholar]
- [15].Tkach M, Thery C, Cell 2016, 164, 1226. [DOI] [PubMed] [Google Scholar]
- [16].Mathieu M, Martin-Jaular L, Lavieu G, Théry C, Nat. Cell Biol 2019, 21, 9. [DOI] [PubMed] [Google Scholar]
- [17].Tauro BJ, Greening DW, Mathias RA, Ji H, Mathivanan S, Scott AM, Simpson RJ, Methods 2012, 56, 293. [DOI] [PubMed] [Google Scholar]
- [18].Rekker K, Saare M, Roost AM, Kubo A-L, Zarovni N, Chiesi A, Salumets A, Peters M, Clin. Biochem 2014, 47, 135. [DOI] [PubMed] [Google Scholar]
- [19].Heinemann ML, Ilmer M, Silva LP, Hawke DH, Recio A, Vorontsova MA, Alt E, Vykoukal J, J. Chromatogr. A 2014, 1371, 125. [DOI] [PubMed] [Google Scholar]
- [20].Kanwar SS, Dunlay CJ, Simeone DM, Nagrath S, Lab Chip 2014, 14, 1891. [DOI] [PMC free article] [PubMed] [Google Scholar]
- [21].Wunsch BH, Smith JT, Gifford SM, Wang C, Brink M, Bruce RL, Austin RH, Stolovitzky G, Astier Y, Nat. Nanotechnol 2016, 11, 936. [DOI] [PubMed] [Google Scholar]
- [22].Liu C, Guo J, Tian F, Yang N, Yan F, Ding Y, Wei J, Hu G, Nie G, Sun J, ACS Nano 2017, 11, 6968. [DOI] [PubMed] [Google Scholar]
- [23].Wan Y, Cheng G, Liu X, Hao S-J, Nisic M, Zhu C-D, Xia Y-Q, Li W-Q, Wang Z-G, Zhang W-L, Rice SJ, Sebastian A, Albert I, Belani CP, Zheng S-Y, Nat. Biomed. Eng 2017, 1, 0058. [DOI] [PMC free article] [PubMed] [Google Scholar]
- [24].Wang W, Luo J, Wang S, Adv. Healthcare Mater 2018, 7, 1800484. [Google Scholar]
- [25].Li W, Wang H, Zhao Z, Gao H, Liu C, Zhu L, Wang C, Yang Y, Adv. Mater 2019, 31, 1805344. [DOI] [PubMed] [Google Scholar]
- [26].Liu C, Zhao J, Tian F, Chang J, Zhang W, Sun J, J. Am. Chem. Soc 2019, 141, 3817. [DOI] [PubMed] [Google Scholar]
- [27].Liu C, Zhao J, Tian F, Cai L, Zhang W, Feng Q, Chang J, Wan F, Yang Y, Dai B, Cong Y, Ding B, Sun J, Tan W, Nat. Biomed. Eng 2019, 3, 183. [DOI] [PubMed] [Google Scholar]
- [28].Li W, Shao B, Liu C, Wang H, Zheng W, Kong W, Liu X, Xu G, Wang C, Li H, Zhu L, Yang Y, Small Methods 2018, 2, 1800122. [Google Scholar]
- [29].Jauregui R, Srinivasan S, Vojtech LN, Gammill HS, Chiu DT, Hladik F, Stayton PS, Lai JJ, ACS Appl. Mater. Interfaces 2018, 10, 33847. [DOI] [PMC free article] [PubMed] [Google Scholar]
- [30].Qiu G, Thakur A, Xu C, Ng S-P, Lee Y, Wu C-ML, Adv. Funct. Mater 2019, 29, 1806761. [Google Scholar]
- [31].Melo SA, Luecke LB, Kahlert C, Fernandez AF, Gammon ST, Kaye J, LeBleu VS, Mittendorf EA, Weitz J, Rahbari N, Reissfelder C, Pilarsky C, Fraga MF, Piwnica-Worms D, Kalluri R, Nature 2015, 523, 177. [DOI] [PMC free article] [PubMed] [Google Scholar]
- [32].Reátegui E, van der Vos KE, Lai CP, Zeinali M, Atai NA, Aldikacti B, Floyd FP, Khankhel AH, Thapar V, Hochberg FH, Sequist LV, Nahed BV, Carter BS, Toner M, Balaj L, Ting DT, Breakefield XO, Stott SL, Nat. Commun 2018, 9, 175. [DOI] [PMC free article] [PubMed] [Google Scholar]
- [33].Dong J, Zhang RY, Sun N, Smalley M, Wu Z, Zhou A, Chou SJ, Jan YJ, Yang P, Bao L, Qi D, Tang X, Tseng P, Hua Y, Xu D, Kao R, Meng M, Zheng X, Liu Y, Vagner T, Chai X, Zhou D, Li M, Chiou SH, Zheng G, Di Vizio D, Agopian VG, Posadas E, Jonas SJ, Ju SP, et al. , ACS Appl. Mater. Interfaces 2019, 11, 13973. [DOI] [PMC free article] [PubMed] [Google Scholar]
- [34].Grünewald TGP, Cidre-Aranaz F, Surdez D, Tomazou EM, de Álava E, Kovar H, Sorensen PH, Delattre O, Dirksen U, Nat. Rev. Dis. Primers 2018, 4, 5. [DOI] [PubMed] [Google Scholar]
- [35].Villasante A, Marturano-Kruik A, Ambati SR, Liu Z, Godier-Furnemont A, Parsa H, Lee BW, Moore MA, Vunjak-Novakovic G, Theranostics 2016, 6, 1119. [DOI] [PMC free article] [PubMed] [Google Scholar]
- [36].De Feo A, Sciandra M, Ferracin M, Felicetti F, Astolfi A, Pignochino Y, Picci P, Care A, Scotlandi K, Cell Death Dis. 2019, 10, 471. [DOI] [PMC free article] [PubMed] [Google Scholar]
- [37].Miller IV, Raposo G, Welsch U, da Costa OP, Thiel U, Lebar M, Maurer M, Bender HU, von Luettichau I, Richter GHS, Burdach S, Grunewald TGP, Biol. Cell 2013, 105, 289. [DOI] [PubMed] [Google Scholar]
- [38].Tsugita M, Yamada N, Noguchi S, Yamada K, Moritake H, Shimizu K, Akao Y, Ohno T, PLoS One 2013, 8, e77416. [DOI] [PMC free article] [PubMed] [Google Scholar]
- [39].Zhang P, Crow J, Lella D, Zhou X, Samuel G, Godwin AK, Zeng Y, Lab Chip 2018, 18, 3790. [DOI] [PMC free article] [PubMed] [Google Scholar]
- [40].Town J, Pais H, Harrison S, Stead LF, Bataille C, Bunjobpol W, Zhang J, Rabbitts TH, Proc. Natl. Acad. Sci. U. S. A 2016, 113, 3603. [DOI] [PMC free article] [PubMed] [Google Scholar]
- [41].Devaraj NK, ACS Central Sci. 2018, 4, 952. [DOI] [PMC free article] [PubMed] [Google Scholar]
- [42].Witt D, Synthesis 2008, 2008, 2491. [Google Scholar]
- [43].Wang S, Wang H, Jiao J, Chen KJ, Owens GE, Kamei K, Sun J, Sherman DJ, Behrenbruch CP, Wu H, Tseng HR, Angew. Chem., Int. Ed 2009, 48, 8970. [DOI] [PMC free article] [PubMed] [Google Scholar]
- [44].Dong J, Chen J-F, Smalley M, Zhao M, Ke Z, Zhu Y, Tseng H-R, Adv. Mater 2020, 32, 1903663. [DOI] [PMC free article] [PubMed] [Google Scholar]
- [45].Wang S, Liu K, Liu J, Yu ZT, Xu X, Zhao L, Lee T, Lee EK, Reiss J, Lee YK, Chung LW, Huang J, Rettig M, Seligson D, Duraiswamy KN, Shen CK, Tseng HR, Angew. Chem., Int. Ed 2011, 50, 3084. [DOI] [PMC free article] [PubMed] [Google Scholar]
- [46].Blackman ML, Royzen M, Fox JM, J. Am. Chem. Soc 2008, 130, 13518. [DOI] [PMC free article] [PubMed] [Google Scholar]
- [47].Oliveira BL, Guo Z, Bernardes GJL, Chem. Soc. Rev 2017, 46, 4895. [DOI] [PubMed] [Google Scholar]
- [48].Karver MR, Weissleder R, Hilderbrand SA, Bioconjug. Chem 2011, 22, 2263. [DOI] [PMC free article] [PubMed] [Google Scholar]
- [49].Smith EA, Wanat MJ, Cheng Y, Barreira SVP, Frutos AG, Corn RM, Langmuir 2001, 17, 2502. [Google Scholar]
- [50].Toki S, Wakai S, Sekimizu M, Mori T, Ichikawa H, Kawai A, Yoshida A, Histopathology 2018, 73, 645. [DOI] [PubMed] [Google Scholar]
- [51].Zhang P, Samuel G, Crow J, Godwin AK, Zeng Y, Transl. Res 2018, 201, 136. [DOI] [PMC free article] [PubMed] [Google Scholar]
- [52].Benini S, Gamberi G, Cocchi S, Garbetta J, Alberti L, Righi A, Gambarotti M, Picci P, Ferrari S, Cancer Manag. Res 2018, 10, 49. [DOI] [PMC free article] [PubMed] [Google Scholar]
- [53].Tellez-Gabriel M, Brown HK, Young R, Heymann MF, Heymann D, Front. Oncol 2016, 6, 202. [DOI] [PMC free article] [PubMed] [Google Scholar]
- [54].Peng KQ, Yan YJ, Gao SP, Zhu J, Adv. Mater 2002, 14, 1164. [Google Scholar]
- [55].Dong J, Jan YJ, Cheng J, Zhang RY, Meng M, Smalley M, Chen PJ, Tang X, Tseng P, Bao L, Huang TY, Zhou D, Liu Y, Chai X, Zhang H, Zhou A, Agopian VG, Posadas EM, Shyue JJ, Jonas SJ, Weiss PS, Li M, Zheng G, Yu HH, Zhao M, Tseng HR, Zhu Y, Sci. Adv 2019, 5, eaav9186. [DOI] [PMC free article] [PubMed] [Google Scholar]
- [56].Sheng W, Ogunwobi OO, Chen T, Zhang J, George TJ, Liu C, Fan ZH, Lab Chip 2014, 14, 89. [DOI] [PMC free article] [PubMed] [Google Scholar]
- [57].Haun JB, Devaraj NK, Hilderbrand SA, Lee H, Weissleder R, Nat. Nanotechnol 2010, 5, 660. [DOI] [PMC free article] [PubMed] [Google Scholar]
- [58].Kowal J, Arras G, Colombo M, Jouve M, Morath JP, Primdal-Bengtson B, Dingli F, Loew D, Tkach M, Théry C, Proc. Natl. Acad. Sci. U. S. A 2016, 113, E968. [DOI] [PMC free article] [PubMed] [Google Scholar]
- [59].Groot RD, Warren PB, J. Chem. Phys 1997, 107, 4423. [Google Scholar]
- [60].Kalra H, Adda CG, Liem M, Ang CS, Mechler A, Simpson RJ, Hulett MD, Mathivanan S, Proteomics 2013, 13, 3354. [DOI] [PubMed] [Google Scholar]
- [61].Halleck MM, Liu H, North J, Stevens JL, J. Biol. Chem 1997, 272, 21760. [DOI] [PubMed] [Google Scholar]
- [62].Asmellash S, Stevens JL, Ichimura T, Toxicol. Sci 2005, 88, 576. [DOI] [PubMed] [Google Scholar]
- [63].Wang Z, Wu H.-j., Fine D, Schmulen J, Hu Y, Godin B, Zhang JXJ, Liu X, Lab Chip 2013, 13, 2879. [DOI] [PMC free article] [PubMed] [Google Scholar]
- [64].Franzen CA, Simms PE, Van Huis AF, Foreman KE, Kuo PC, Gupta GN, Biomed Res. Int 2014, 2014, 619829. [DOI] [PMC free article] [PubMed] [Google Scholar]
Associated Data
This section collects any data citations, data availability statements, or supplementary materials included in this article.