

Abstract
Most brain microstructure models are dedicated to the quantification of white matter microstructure, using for example sticks, cylinders, and zeppelins to model intra- and extra-axonal environments. Gray matter presents unique micro-architecture with cell bodies (somas) exhibiting diffusion characteristics that differ from axons in white matter. In this paper, we introduce a method to quantify soma microstructure, giving measures such as volume fraction, diffusivity, and kurtosis. Our method captures a spectrum of diffusion patterns and scales and does not rely on restrictive model assumptions. We show that our method yields unique and meaningful contrasts that are in agreement with histological data. We demonstrate its application in the mapping of the distinct spatial patterns of soma density in the cortex.
1. Introduction
Biophysical models utilizing diffusion magnetic resonance imaging (dMRI) are powerful tools for mapping brain microstructure, affording insights into tissue architecture [1–5] and revealing pathological and developmental patterns [6]. The focus of most microstructure models is white matter, where water molecules diffuse directionally. In gray matter, the microstructure is more heterogeneous, involving somas (cell bodies), dendrites, glial cells, unmyelinated axons, etc. Models dichotomizing gray matter signal as either extra-neurite or intra-neurite suffer from model simplification and are bound to bias microstructure estimates.
It has been shown for the first time in [7] that intra-soma diffusion can be modeled as a separate compartment distinct from intra-neurite and extra-neurite compartments. The soma and neurite density imaging (SANDI) [7] model relies on the assumptions that extra-neurite diffusion is isotropic and that intra-soma diffusivity is similar to that of free water. These assumptions do not hold in practice as extra-neurite diffusion are shown to be anisotropic [2,4,5] and intra-soma diffusion is isotropic and restricted [8]. In this paper, we demonstrate that spherical mean spectrum imaging (SMSI) [1,2] can be extended to quantify intra-soma diffusion. SMSI captures a spectrum of diffusion patterns from coarse to fine scales. We extended SMSI for quantification of soma microstructure, giving measures such as volume fraction, diffusivity, and kurtosis. Our method captures a spectrum of diffusion patterns and scales and does not rely on restrictive assumptions, such as fixed compartment number and diffusivity. We show that our method yields unique and meaningful contrasts that are in agreement with histological data. We demonstrate its application in mapping the distinct spatial patterns of soma density in the cortex.
2. Method
2.1. Soma Compartment Model
As observed in the spherical mean technique (SMT) [3], the spherical mean of the dMRI signal only depends on b-value and diffusivity but not the fiber orientation distribution. For a micro-environment with diffusion that can be represented using a tensor model, the spherical mean is defined as
| (1) |
| (2) |
where λ∥ is the parallel diffusivity and λ⊥ is the perpendicular diffusivity [3]. SMSI [1] views the spherical mean as a linear combination of contributions from multiple micro-environments, i.e.,
| (3) |
The i-th micro-environment is associated with parallel diffusivity λ∥[i], perpendicular diffusivity λ⊥[i], and volume fraction ν[i]. Different sub-spectra can be derived from the spherical mean spectrum as follows:
The intra-neurite (neu) diffusion sub-spectrum with high parallel and low to no perpendicular diffusion, typical in neurites (axons and dendrites) and commonly represented as “sticks” or cylinders with τ−2λ∥[i] ≥ λ⊥[i] ≥ 0 where τ is the geometric tortuosity [9].
The extra-cellular (ec) diffusion sub-spectrum with high parallel and mod-erate perpendicular diffusion, typical in extra-cellular space and commonly represented as zeppelins with λ∥[i] > λ⊥[i] > τ−2λ∥[i]. Unlike SANDI [7], this condition allows the extra-cellular compartment to be anisotropic, as widely shown in [1,4,5].
The intra-soma (is) diffusion sub-spectrum with slow isotropic diffusion, represented as spheres with diffusion that is more restricted than free water [7], i.e., λ∥[i] > λ⊥[i] ≤ 1 μm2/ms. This range covers typical diffusivity within cell bodies [8].
The fast-isotropic (fi) diffusion sub-spectrum including free-water diffusion, represented by spheres with 2 μm2/ms ≤ λ∥[i] > λ⊥[i] ≤ 3 μm2/ms.
Figure 1 illustrates the model.
Fig. 1. Model.
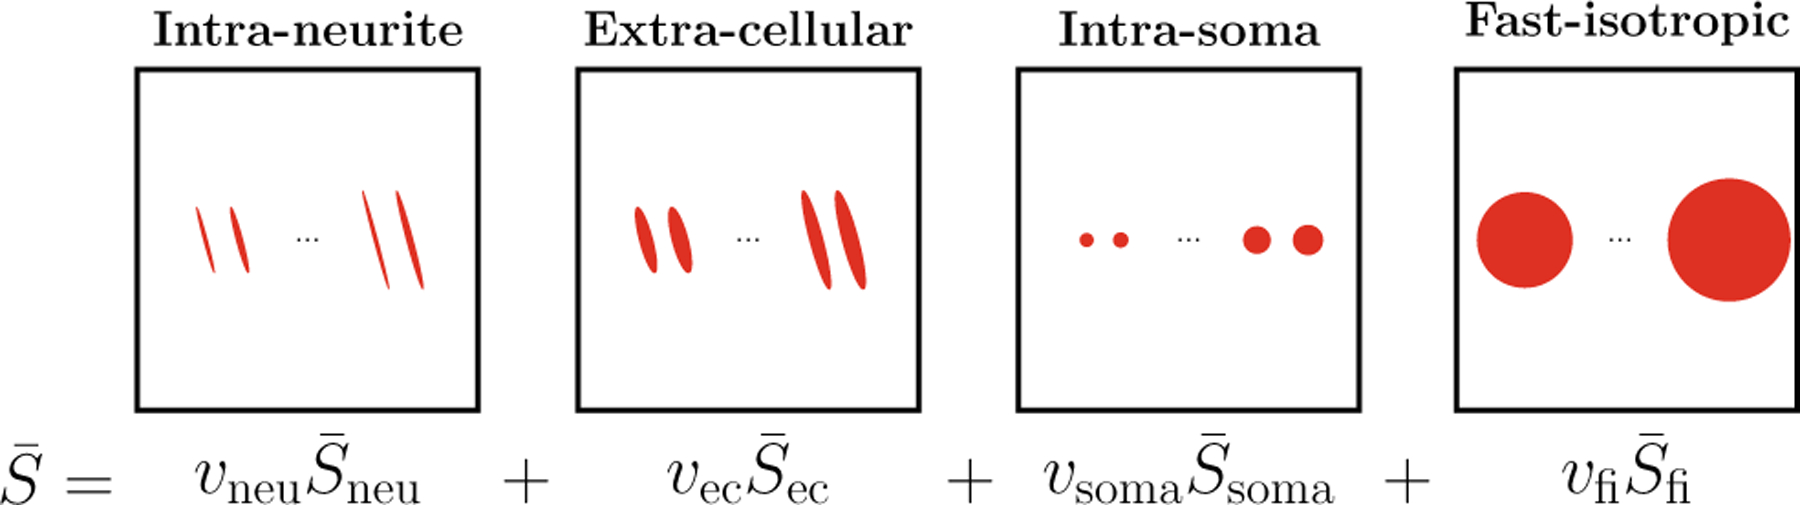
The spherical mean signal is contributed by the intra-neurite (neu), extra-cellular (ec), intra-soma (soma), and fast-isotropic (fi) diffusion compartments. SMSI represents each compartment with atoms of multiple diffusivity values.
2.2. Implementation Details
SMSI solves for the volume fraction ν[i] via elastic net
| (4) |
where is a dictionary with atoms representing spherical mean signals of micro-environments covering the different sub-spectra as described above. n is the number of b-shells and p is the number of atoms. w is a weight vector and γ1 and γ2 are tuning parameters that control the contributions of the ℓ1 and ℓ2 regularization terms, respectively.
It has been reported that the spherical mean signal from linear encoding dMRI can be ambiguous [10]. That is, within the typical range of b-values (b ≤ 3000 s/mm2), the spherical mean signal of an anisotropic tensor can be indistinguishable from the spherical mean signal of a combination of multiple isotropic tensors with different diffusivity values. We address this problem by using the full direction-sensitized diffusion signal to disambiguate between anisotropic and isotropic diffusion.
Weighting with Full Signal Spectrum (FSS):
The full diffusion signal S can be represented as the spherical convolution between the fiber orientation distribution function (fODF) and the kernel h. Using spherical harmonics (SHs), S can be expressed as the product of rotational SHs, H, the SH of even order up to order L, , and the SH coefficients of the fODF, φ. In line with [9] and the spirit of SMSI, let be the matrix of rotational SHs of h(g|ω, λ∥[i], λ⊥[i]), and φi be the SH coefficients of the fODF corresponding to h(g|ω, λ∥[i], λ⊥[i]), the full signal can be discretized as [11]
| (5) |
can be seen as a dictionary matrix and Φ, a matrix containing φi, ∀i, can be solved with Tikhonov regularization [9]
| (6) |
To ensure that the fODF of anisotropic atoms does not degenerate to become isotropic, we first solve (6) with weight vector w′ set to one for all atoms and reapply (6) with w′ set to a higher value for any atom with GFA < 0.3. This approach penalizes low GFA anisotropic fODF and disambiguates anisotropic and isotropic diffusion in case of degeneracy [1]. From the final solution, a set of weights, νFSS, is calculated as the 0-th order SH coefficient from Φ.
Weighting with Spherical Mean Spectrum (SMS):
Similar to [1], we first use the spherical mean signals of shells with b ≤ 1000 s/mm2 in solving (4) with w set to one for all atoms. This will help improve the estimates of the volume fractions of fast isotropic diffusion atoms as the associated signals decay rapidly and become trivial at higher b value. The solution to this step results in a set of weights, νSMS.
Iterative Estimation:
We then solve for the volume fractions using all b-shells via iterative re-weighted elastic net, where in the j-th iteration we have
| (7) |
where with ξ being a constant and ν0 is computed as the element-wise geometric mean of νFSS and νSMS. Regularization parameters γs are determined via grid search as in [1].
2.3. Intra-soma Diffusion Properties
From ν, the volume fraction of the intra-soma compartment can be determined. Note that intra-soma diffusion can be characterized by multiple slow isotropic diffusion atoms with different diffusivity values and hence deviates from Gaussianity. To characterize diffusional non-Gaussianity, we derive a soma kurtosis model from [12]
| (8) |
where is the normalized spherical mean signal contribution from the soma compartment, λsoma is the soma diffusivity, and Ksoma is the soma kurtosis.
3. Experiments
For evaluation, we used the dMRI data of 4 healthy adults, each with 12, 24, and 48 diffusion-weighted images respectively for b = 1000, 2000, 3000 s/mm2 and 6 B0 images. Each diffusion-weighted image has an isotropic resolution of 1.5mm. The images were corrected for motion and off-resonance artifacts [13]. SMSI parameters were set according to [1].
3.1. Microstructure
Figure 2 presents the parametric maps for a representative subject. In white matter, the intra-neurite volume fraction (vneu) is high, in line with previous observations that these regions contain mostly myelinated axons [2,4,14], giving a clear contrast for major fiber bundles such as forceps major, forceps minor, cortical spinal tract. The extra-cellular volume fraction (vec) is higher in superficial white matter and some gray matter regions. The fast-isotropic diffusion volume fraction (vfi) is high in the ventricles and peripheral regions where there is little to no microscopic barriers to water diffusion.
Fig. 2. Tissue Microstructure.
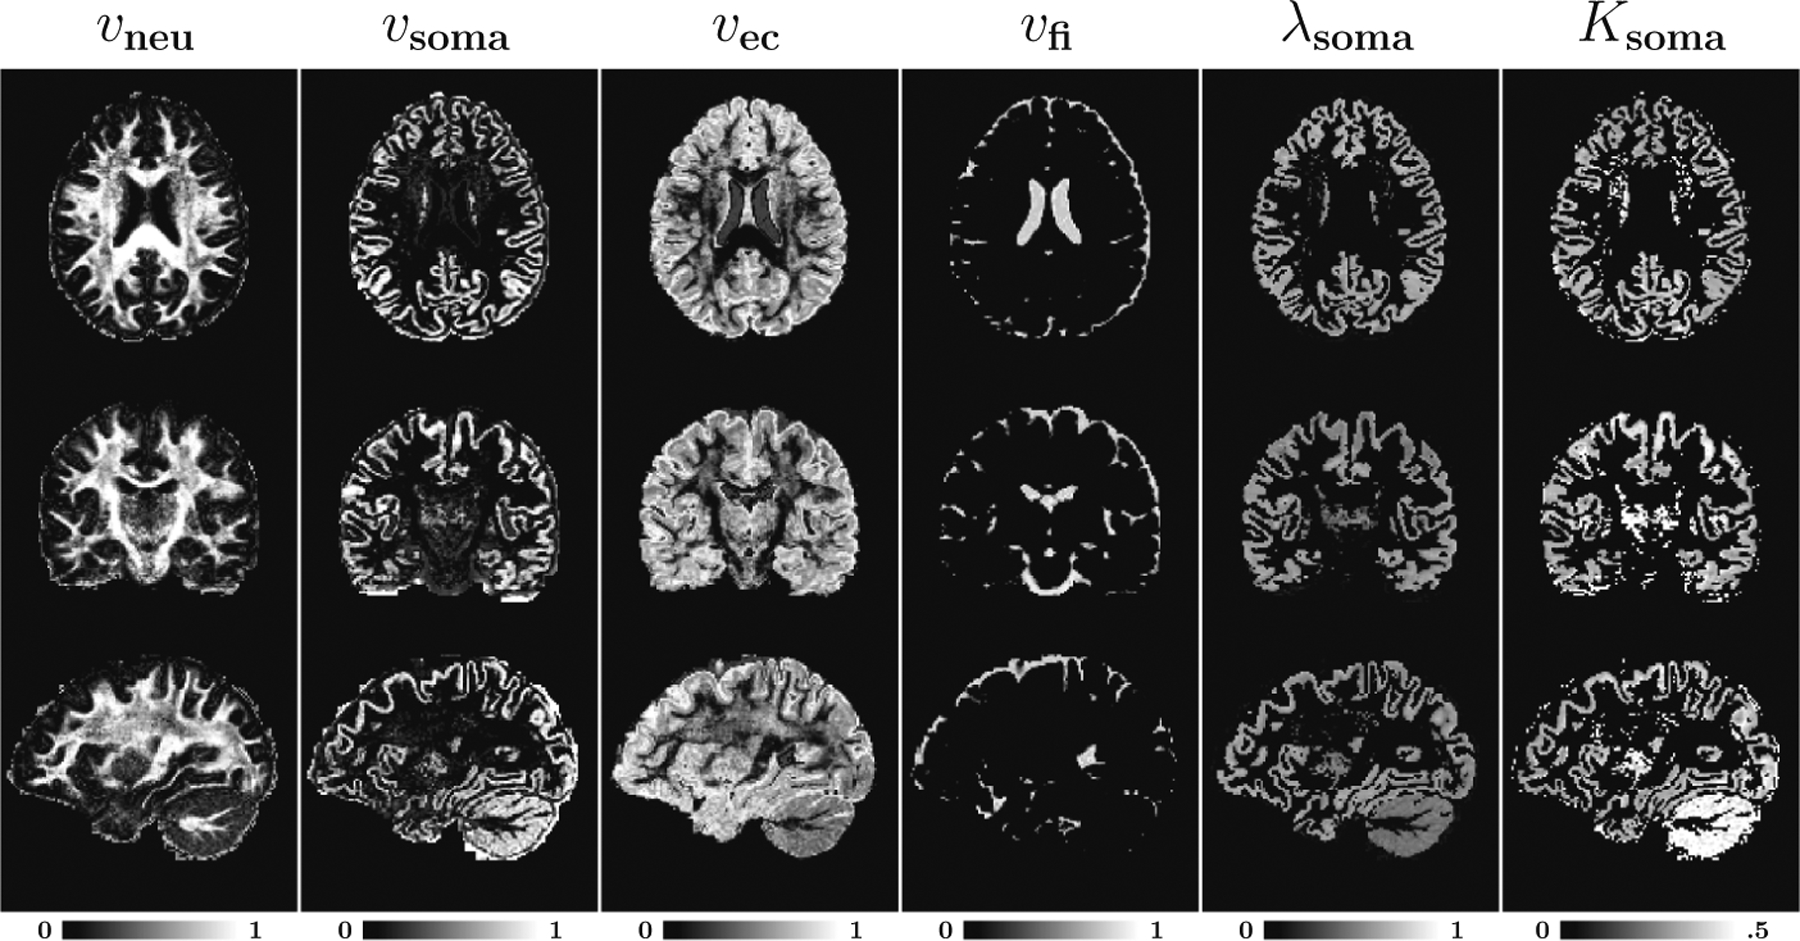
Microstructural properties of a representative subject: Intra-neurite volume fraction (vneu), intra-soma volume fraction (vsoma), extra-cellular volume fraction (vec), fast-isotropic diffusion volume fraction (vfi), soma diffusivity (λsoma), and soma kurtosis (Ksoma).
The intra-soma volume fraction (vsoma) is higher in the cortical ribbon. The typical value is between 0.1–0.2, which are in line with observations in [7,15]. The soma diffusivity (λsoma) is mostly around 0.6 μm2/ms in the cortex and is slightly lower in the cerebellum. The soma kurtosis (Ksoma), although small, is non-zero and is highest in the cerebellar gray matter. This could be due to the unique structure of the cerebellar cortex with a dense layer of granule cells and Purkinje cells with complex dendritic spines [8].
3.2. Histology
Figure 3 illustrates the similarity between our results and ex-vivo histological images. The intra-neurite volume fraction map is strikingly similar to myelin stain. The intra-soma volume fraction map is similar to cell nuclei stain, with higher values in the cerebral and cerebellar gray matter. These results demonstrate that our method provides biologically meaningful contrasts resembling ex-vivo stains. This also underscores the importance of dMRI as an in vivo histology tool that can avoid the limitations of ex-vivo staining, such as distortions caused by the slicing and staining processes.
Fig. 3. Resemblance to Stained Sections.
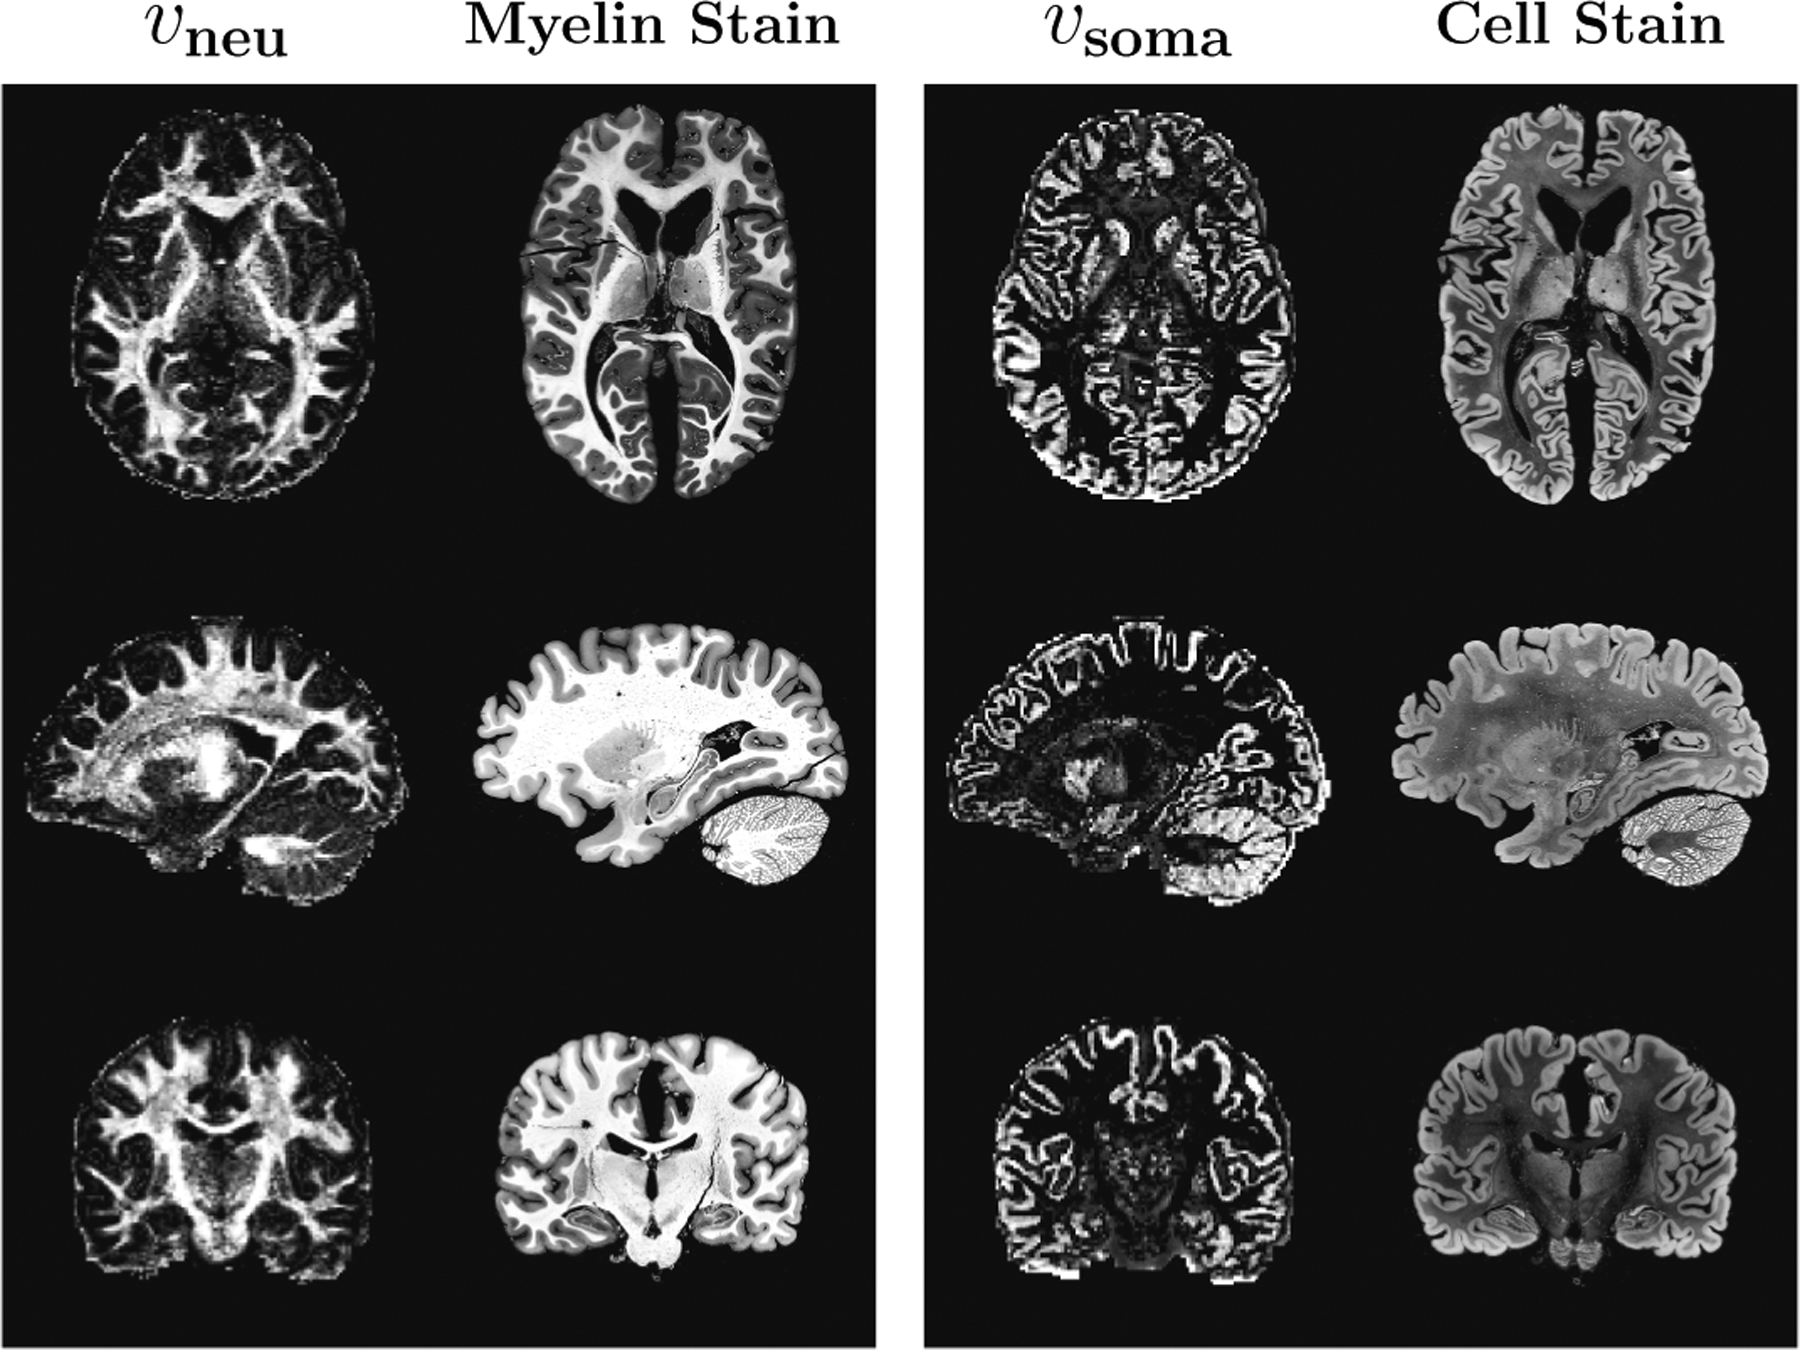
Intra-neurite volume fraction (vneu), which provides contrast related to neurite density, poses striking similarity with myelin stain. Intra-soma volume fraction (vsoma), which provides information related to soma density, shows remarkable resemblance with cell stain. Stained sections were obtained from https://msu.edu/~brains/brains/human/index.html.
3.3. Cortical Patterns
We constructed the cortical surfaces from the T1- and T2-weighted images as described in [16,17] and mapped the parametric maps onto the cortical surface as described in [18]. Figure 4 shows the average maps of 4 healthy adults. The intra-neurite volume fraction is higher in the motor and somatosensory areas, confirming the pattern observed in [19]. On the other hand, the soma maps reveal distinct patterns, with relatively low values in the motor area, but higher values in the occipital and temporal lobes.
Fig. 4. Cortical Patterns.
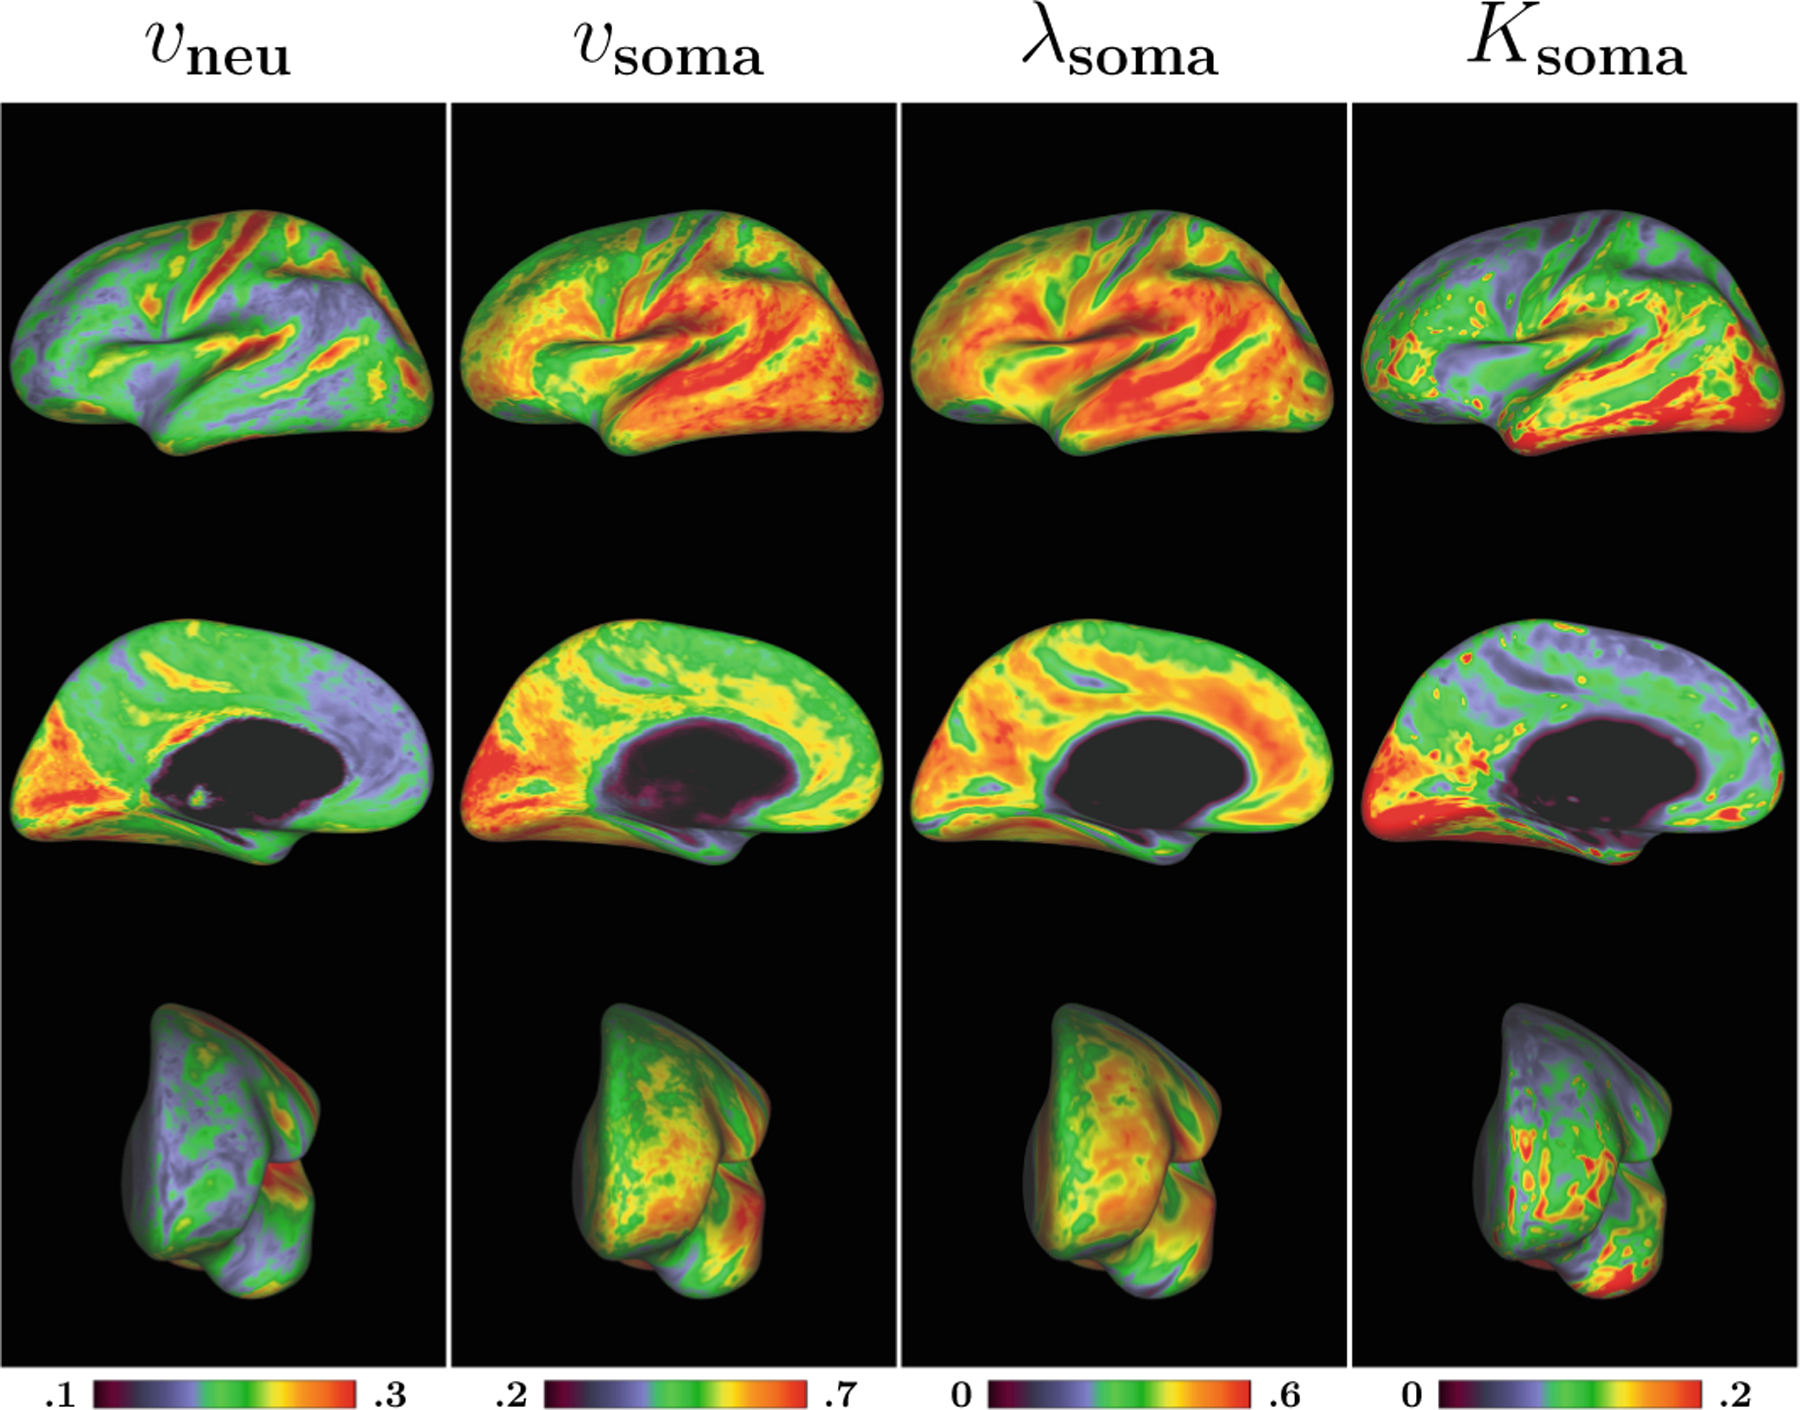
Average cortical maps of intra-neurite volume fraction (vneu), intra-soma volume fraction (vsoma), soma diffusivity (λsoma), and soma kurtosis (Ksoma) of 4 healthy adults.
3.4. Number of Shells
To evaluate the effect of the number of b-shells on microstructure estimation using our model, we acquired a 21-shell data of a healthy adult with b-values ranging from 500 s/mm2 to 3000 s/mm2 with step size 125 s/mm2. There are 4 to 24 diffusion-weighted (DW) images in each shell, and 13 non-DW images, resulting in a total of 307 volumes. We fitted our model to 4 different sampling schemes:
The 21-shell dataset consisting of all volumes;
The 11-shell dataset with b-values from 500 s/mm2 to 3000 s/mm2 with step size 250 s/mm2;
The 6-shell dataset with b-values from 500 s/mm2 to 3000 s/mm2 with step size 500 s/mm2;
The 3-shell-1000 with b-values from 1000 s/mm2 to 3000 s/mm2 with step size 1000 s/mm2; and
The 3-shell-500 dataset with b-values from 500 s/mm2 to 2500 s/mm2 with step size 1000 s/mm2.
In Fig. 5, indices from different schemes were compared with those from the reference (21-shell). The higher number of shells, the closer the results to the reference. However, even at only 3 b-shells, almost all indices are comparable to the reference with correlation coefficient (R) greater than 0.95. The only exception is vfi from the 3-shell-1000 scheme, showing slightly lower R due to the lack of a lower b-shell for effective estimation of the fast isotropic diffusion compartment. Nevertheless, the correlation coefficient R > 0.89 is still sufficiently high for most practical situations. The results demonstrate that our method is suitable for datasets with at least 3 b-shell, such as the Human Connectome Project (HCP) [20] and the Baby Connectome Project (BCP) [21].
Fig. 5. Number of b-Shells.
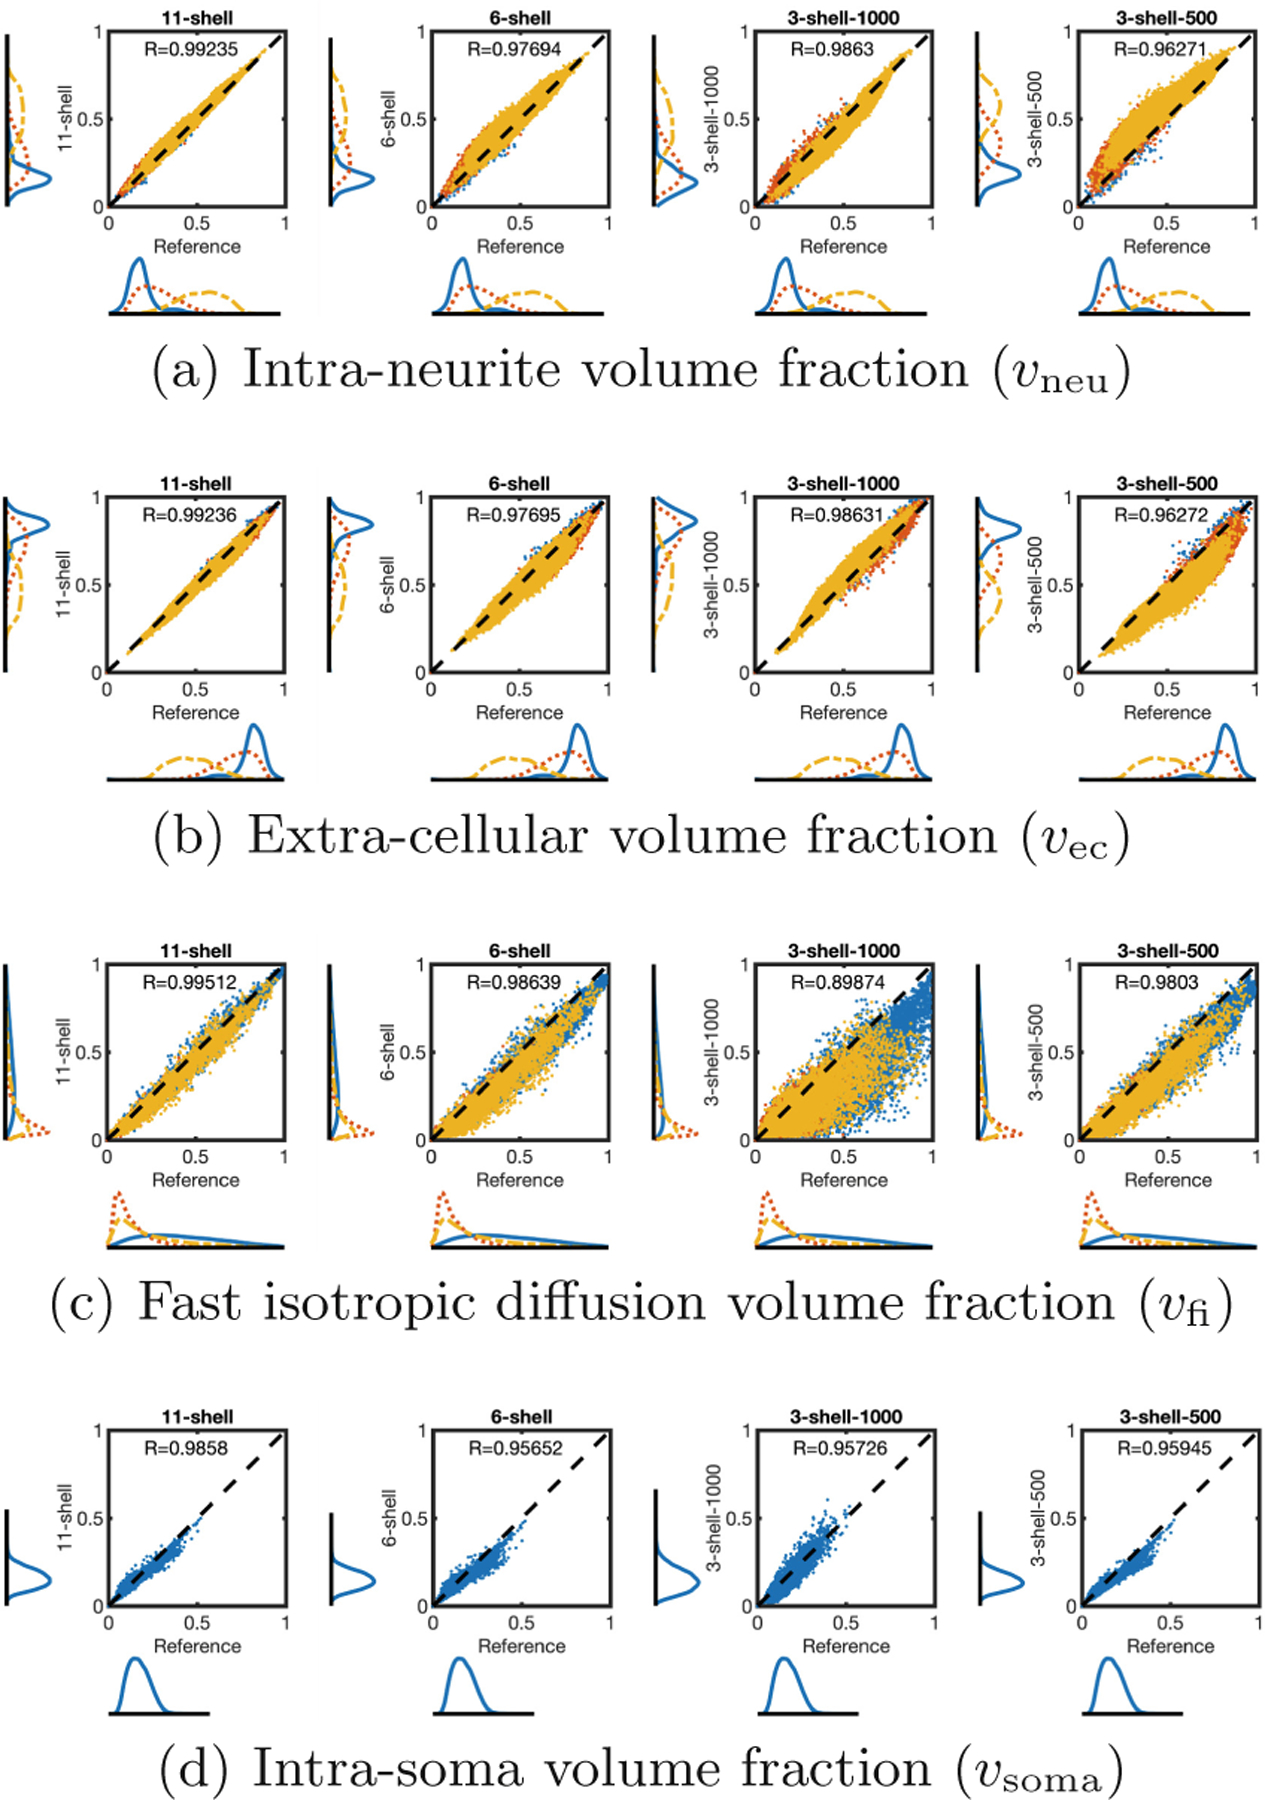
Scatter plots and histograms of representative indices given by sampling schemes 11-shell, 6-shell, 3-shell-1000, and 3-shell-500 with 21-shell as the reference. Voxels are classified as CSF (red), gray matter (blue), or white matter (yellow). For better visibility, only one in every six voxels is shown. Since intra-soma volume fraction is negligible in white matter and CSF, only gray matter voxels are shown in (d).
4. Conclusions
We have presented a method to characterize soma diffusion properties and have shown that biologically meaningful contrasts resembling histological data can be produced. Future work entails applying our method to investigating changes in the cerebral cortex in relation to development, aging, and diseases.
Acknowledgments
This work was supported in part by NIH grants (NS093842 and EB022880).
References
- 1.Huynh KM, et al. : Probing tissue microarchitecture of the baby brain via spherical mean spectrum imaging. IEEE Trans. Med. Imaging 1 (2020) [DOI] [PMC free article] [PubMed] [Google Scholar]
- 2.Huynh KM, et al. : Probing brain micro-architecture by orientation distribution invariant identification of diffusion compartments. In: Shen D, et al. (eds.) MICCAI 2019. LNCS, vol. 11766, pp. 547–555. Springer, Cham: (2019). 10.1007/978-3-030-32248-961 [DOI] [PMC free article] [PubMed] [Google Scholar]
- 3.Kaden E, Kruggel F, Alexander DC: Quantitative mapping of the per-axon diffusion coefficients in brain white matter. Magnet. Reson. Med 75(4), 1752–1763 (2016) [DOI] [PMC free article] [PubMed] [Google Scholar]
- 4.Kaden E, Kelm ND, Carson RP, Does MD, Alexander DC: Multi-compartment microscopic diffusion imaging. NeuroImage 139, 346–359 (2016) [DOI] [PMC free article] [PubMed] [Google Scholar]
- 5.Zhang H, Schneider T, Wheeler-Kingshott CA, Alexander DC: NODDI: practical in vivo neurite orientation dispersion and density imaging of the human brain. Neuroimage 61(4), 1000–1016 (2012) [DOI] [PubMed] [Google Scholar]
- 6.Alexander DC, Dyrby TB, Nilsson M, Zhang H: Imaging brain microstructure with diffusion MRI: practicality and applications. NMR Biomed. 32, e3841 (2017) [DOI] [PubMed] [Google Scholar]
- 7.Palombo M, et al. : SANDI: a compartment-based model for non-invasive apparent soma and neurite imaging by diffusion MRI. NeuroImage 245, 116835 (2020) [DOI] [PMC free article] [PubMed] [Google Scholar]
- 8.Tax CM, Szczepankiewicz F, Nilsson M, Jones DK: The dot-compartment revealed? Diffusion MRI with ultra-strong gradients and spherical tensor encoding in the living human brain. NeuroImage 210, 116534 (2020) [DOI] [PMC free article] [PubMed] [Google Scholar]
- 9.White NS, Leergaard TB, D’Arceuil H, Bjaalie JG, Dale AM: Probing tissue microstructure with restriction spectrum imaging: histological and theoretical validation. Hum. Brain Map 34(2), 327–346 (2013) [DOI] [PMC free article] [PubMed] [Google Scholar]
- 10.Szczepankiewicz F: Imaging diffusional variance by MRI: the role of tensor-valued diffusion encoding and tissue heterogeneity. Ph.D. thesis, Lund University; (2016) [Google Scholar]
- 11.Tournier JD, Calamante F, Gadian DG, Connelly A: Direct estimation of the fiber orientation density function from diffusion-weighted MRI data using spherical deconvolution. NeuroImage 23(3), 1176–1185 (2004) [DOI] [PubMed] [Google Scholar]
- 12.Huynh KM, et al. : Characterizing non-gaussian diffusion in heterogeneously oriented tissue microenvironments. In: Shen D, et al. (eds.) MICCAI 2019. LNCS, vol. 11766, pp. 556–563. Springer, Cham: (2019). 10.1007/978-3030-32248-9_62 [DOI] [PMC free article] [PubMed] [Google Scholar]
- 13.Andersson JL, Sotiropoulos SN: An integrated approach to correction for off-resonance effects and subject movement in diffusion MR imaging. Neuroimage 125, 1063–1078 (2016) [DOI] [PMC free article] [PubMed] [Google Scholar]
- 14.Mori S, Oishi K, Faria AV: White matter atlases based on diffusion tensor imaging. Curr. Opin. Neurol 22(4), 362 (2009) [DOI] [PMC free article] [PubMed] [Google Scholar]
- 15.Lampinen B, et al. : Searching for the neurite density with diffusion MRI: Challenges for biophysical modeling. Hum. Brain Mapp 40(8), 2529–2545 (2019) [DOI] [PMC free article] [PubMed] [Google Scholar]
- 16.Ahmad S, et al. : Surface-volume consistent construction of longitudinal atlases for the early developing brain. In: Shen D, et al. (eds.) MICCAI 2019. LNCS, vol. 11765, pp. 815–822. Springer, Cham: (2019). 10.1007/978-3-030-32245-8_90 [DOI] [PMC free article] [PubMed] [Google Scholar]
- 17.Li G, Wang L, Shi F, Gilmore JH, Lin W, Shen D: Construction of 4D high-definition cortical surface atlases of infants: Methods and applications. Med. Image Anal 25(1), 22–36 (2015) [DOI] [PMC free article] [PubMed] [Google Scholar]
- 18.Glasser MF, Van Essen DC: Mapping human cortical areas in vivo based on myelin content as revealed by T1-and T2-weighted MRI. J. Neurosci 31(32), 11597–11616 (2011) [DOI] [PMC free article] [PubMed] [Google Scholar]
- 19.Fukutomi H, et al. : Neurite imaging reveals microstructural variations in human cerebral cortical gray matter. Neuroimage 182, 488–499 (2018) [DOI] [PMC free article] [PubMed] [Google Scholar]
- 20.Van Essen DC, et al. : The WU-Minn human connectome project: an overview. Neuroimage 80, 62–79 (2013) [DOI] [PMC free article] [PubMed] [Google Scholar]
- 21.Howell BR, et al. : The UNC/UMN baby connectome project (BCP): an overview of the study design and protocol development. NeuroImage 185, 891–905 (2018) [DOI] [PMC free article] [PubMed] [Google Scholar]