

Abstract
Most cancer chemotherapeutic agents are ineffective in a subset of patients; thus, it is important to consider the role of genetic variation in drug response. Lymphoblastoid cell lines (LCLs) in 1000 Genomes Project populations of diverse ancestries are a useful model for determining how genetic factors impact the variation in cytotoxicity. In our study, LCLs from three 1000 Genomes Project populations of diverse ancestries were previously treated with increasing concentrations of eight chemotherapeutic drugs, and cell growth inhibition was measured at each dose with half-maximal inhibitory concentration (IC50) or area under the dose–response curve (AUC) as our phenotype for each drug. We conducted both genome-wide association studies (GWAS) and transcriptome-wide association studies (TWAS) within and across ancestral populations. We identified four unique loci in GWAS and three genes in TWAS to be significantly associated with the chemotherapy-induced cytotoxicity within and across ancestral populations. In the etoposide TWAS, increased STARD5 predicted expression associated with decreased etoposide IC50 (P = 8.5 × 10⁻⁸). Functional studies in A549, a lung cancer cell line, revealed that knockdown of STARD5 expression resulted in the decreased sensitivity to etoposide following exposure for 72 (P = 0.033) and 96 h (P = 0.0001). By identifying loci and genes associated with cytotoxicity across ancestral populations, we strive to understand the genetic factors impacting the effectiveness of chemotherapy drugs and to contribute to the development of future cancer treatment.
Introduction
Cancer is a complex disease with genetic-, environmental- and lifestyle-based risk factors, and in recent years, it has become a leading cause of death globally (1). The most common cancer types worldwide are prostate and lung cancers in men and breast cancer in women (1). Chemotherapeutics, while a widely effective treatment for various cancer types, have limitations, as patient responses are varied and a subset of patients’ tumors develop drug resistance, causing them to require combination chemotherapy or other treatment types, which have varying degrees of success depending on the tumor progression (2–4). Metastatic cancers have remained more challenging to treat despite recent developments in cancer immunology and targeted therapies; thus, there is a need for more personalized approaches to cancer medicine, which requires the identification of genetic variants and biological mechanisms impacting drug response (2,5,6). Lymphoblastoid cell lines (LCLs) from International HapMap and 1000 Genomes Project serve as one effective model for determining the genetic factors contributing to chemotherapeutic cytotoxicity because they have extensive genetic information, are derived from related individuals and, as with all cell cultures, environmental factors can be controlled (7). There are also LCLs derived from a multitude of ancestral populations making them particularly useful for studying how drug response varies across ancestral populations (7–9). In addition, genetic variation acting through its effect on gene expression is known to impact chemotherapeutic drug response (10–18).
As of 2018, more than 3000 genome-wide association studies (GWAS) have been published; however, more than 80% of individuals studied have been of European ancestries (19). To develop a deeper understanding of how genetic differences impact disease and treatment, studies must be conducted on more diverse populations, as many common variants in the human genome have been demonstrated to be population-specific (19,20). In addition to the lack of representation of individuals of non-European ancestries in past studies, GWAS also have limitations in and of themselves. While GWAS identify associations on a genomic level, they do not provide insight into the underlying biological mechanisms that regulate traits (21). Transcriptome-wide association studies (TWAS) are another method for analyzing the factors impacting phenotype, as they employ statistical modeling to predict the transcript expression levels from genotypes and to determine the associations between predicted gene expression and phenotype (21–24). This aids in implicating GWAS results in gene regulation because the direction of effect for each association is provided (21–24).
In this study, we conducted both GWAS and TWAS on drug-response phenotypes from eight chemotherapeutics measured in HapMap LCLs derived from three ancestral populations consisting of individuals with African, Asian and European ancestries. By including individuals of diverse backgrounds in this study, we identified associations both within and across ancestral populations. Previous GWAS were conducted on the subsets of these individuals before the 1000 Genomes Project was complete, and thus at that time, many individuals had been genotyped through the HapMap Project but were not sequenced (8,9,11–18,25–27). In this study, all individuals were either sequenced or imputed to 1000 Genomes, allowing more single nucleotide polymorphisms (SNPs) to be analyzed. We also performed TWAS on these data for the first time to discover gene-based associations and gained further insight into the underlying mechanisms involved in regulating drug response. Moreover, for the most significant gene identified, STARD5, we validated our results by performing knockdown experiments in a lung cancer cell line treated with the associated chemotherapeutic, etoposide. By conducting GWAS and TWAS, confirming our results experimentally and incorporating diverse ancestral populations, we aimed to cultivate a deeper understanding of the genomic factors and biological mechanisms impacting chemotherapy drug response and to contribute to the development of future precision cancer treatment. All scripts used can be found on GitHub: https://github.com/ashleymulford/chemotherapy_toxicity.
Results
Population chemotherapy phenotypes
In order to investigate the genetic and transcriptomic effects on chemotherapeutic toxicity, we gathered previously published dose–response data from LCLs in diverse ancestral populations (11–18,25–27). The LCLs were derived from individuals from the Yoruba population in Ibadan, Nigeria (YRI), individuals with European ancestries from Utah, USA (CEU) and individuals from a combined population of Han Chinese from Beijing, China, and Japanese from Tokyo, Japan (ASN). Both the YRI and CEU populations included parent–child trios. We used phenotypes from eight chemotherapy drugs in our study. Depending on the drug, the cytotoxicity phenotype from each individual’s LCL was calculated either with the half-maximal inhibitory concentration (IC50) or the area under the dose--response curve (AUC) (Table 1). We rank-normalized (RN) these measurements for use in our genetic analyses. The total counts for individuals with both genotype and phenotype data varied for each drug and ancestral population (Table 1). An overview of the data analysis can be seen in Figure 1.
Table 1.
Number of individuals with both genotype and phenotype data in each ancestral population for each drug
| Pop. | Ara-C (RN AUC) | Capecitabine (RN AUC) | Carboplatin (RN IC50) | Cisplatin (RN IC50) | Daunorubicin (RN IC50) | Etoposide (RN IC50) | Paclitaxel (RN AUC) | Pemetrexed (RN AUC) |
|---|---|---|---|---|---|---|---|---|
| CEU | 165 | 165 | 168 | 166 | 86 | 84 | 77 | 84 |
| YRI | 177 | 175 | 172 | 175 | 173 | 171 | 87 | 176 |
| ASN | 90 | 84 | 90 | 90 | 0 | 0 | 0 | 0 |
| ALL | 432 | 424 | 430 | 431 | 259 | 255 | 164 | 260 |
Populations: Yoruba from Ibadan, Nigeria (YRI); individuals with European ancestries from Utah, USA (CEU); Japanese from Tokyo, Japan, and Han Chinese from Beijing, China (ASN) and a combined population with all individuals from YRI, CEU and ASN (ALL). Drugs: measured with either half-maximal inhibitory concentration (IC50) or the area under the dose-response curve (AUC), all rank-normalized (RN).
Figure 1 .
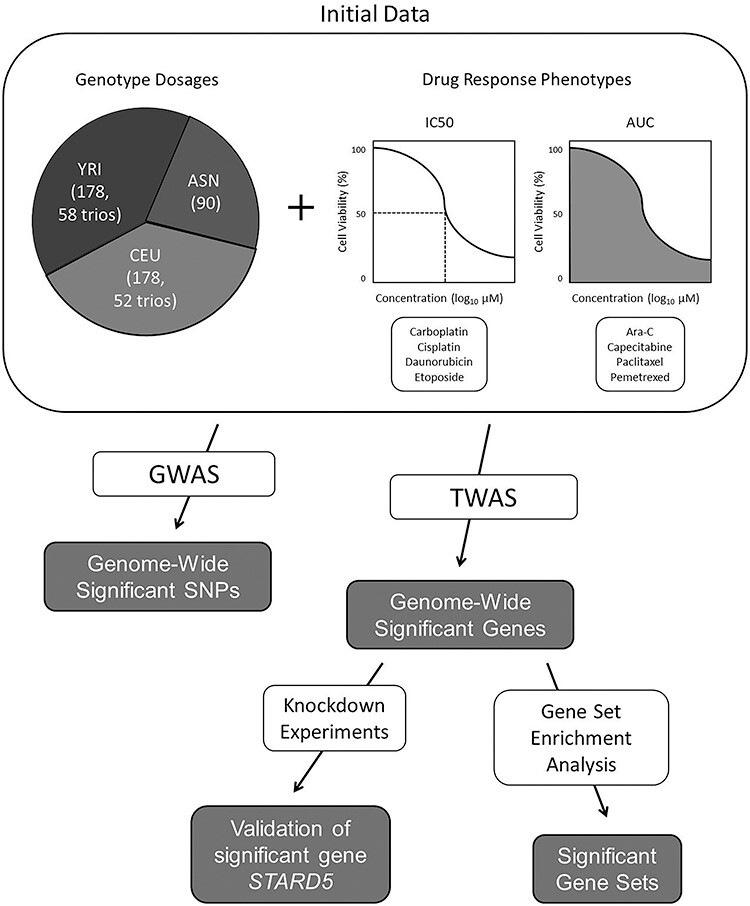
Overview of data and analysis methods. Genotype dosages are from three ancestral populations: Yoruba individuals from Nigeria (YRI), individuals with European ancestries from Utah (CEU), and Japanese individuals from Tokyo and Han Chinese individuals from Beijing (ASN). Sample sizes and parent–child trio counts are listed in parentheses. Drug concentration measurements were taken as either IC50 or AUC. GWAS were conducted with GEMMA for all ancestral populations and drug response phenotypes. TWAS were conducted with PrediXcan and MultiXcan for all ancestral populations and drug response phenotypes; GTEx v7 and MESA prediction models were used. Gene set enrichment analyses, which utilized significant gene results, were conducted with FUMA. Knockdown experiments were performed in the A549 lung cancer cell line to validate the most significant gene-based association.
GWAS reveals four new loci associated with chemotherapy-induced cytotoxicity
We conducted GWAS using 1000 Genomes Project sequenced and imputed genotypes to identify genome-wide significant associations between SNPs and the cytotoxicity of each drug for each ancestral population and in all three ancestral populations combined (ALL) (9). We used GEMMA to perform univariate linear mixed model GWAS while accounting for relatedness in each ancestral population and population stratification in the ALL population using covariates generated with principal components analysis (PCA) (28). PCA plots can be found in the supplement (Supplementary Material, Fig. S1). We used a threshold P-value = 5 × 10⁻⁸ to determine genome-wide significance. We found 12 unique SNPs at four independent loci to be significantly associated with the cytotoxicity of four distinct chemotherapeutics, all of which were not previously implicated in any other GWAS as they do not appear in the GWAS catalog (29).
We found two SNPs located in a non-coding region of chromosome 4, rs61079639 (P = 2.3 × 10⁻⁹) and rs60507300 (P = 2.3 × 10⁻⁹), to be associated with daunorubicin cytotoxicity in the YRI population (Fig. 2). We found three SNPs on chromosome 9, rs2100011 (P = 4.7 × 10⁻⁹), rs2254812 (P = 4.7 × 10⁻⁹) and rs2254813 (P = 4.7 × 10⁻⁹), to be associated with carboplatin cytotoxicity in the ASN population (Fig. 3). These SNPs are located in the gene PPP1R26; rs2100011 is an intron variant and rs2254812 and rs2254813 are 5′ untranslated region variants. Additionally, we found six SNPs located in a non-coding region of chromosome 12, led by rs7971310 (P = 1.1 × 10⁻⁸), to be associated with etoposide cytotoxicity in the YRI population (Table 2). Two of these SNPs, rs2711729 (P = 4.9 × 10⁻⁸) and rs2711728 (P = 4.9 × 10⁻⁸), were also found to be associated with etoposide cytotoxicity in the ALL population (Fig. 4). We found one SNP located on chromosome 3, rs10510241 (P = 4.7 × 10⁻⁸), to be associated with cisplatin cytotoxicity in the YRI population. This SNP is an intron variant in the gene CNTN4 (Supplementary Material, Fig. S2). No genome-wide significant associations were found for CEU. Through conditional analysis, we found that the SNPs in each chromosomal region were not independent; thus, each set of SNPs represents one association between the corresponding cytotoxicity phenotype and locus. None of the significant SNPs identified in one ancestral population replicated in another ancestral population (Supplementary Material, Table S1).
Figure 2 .
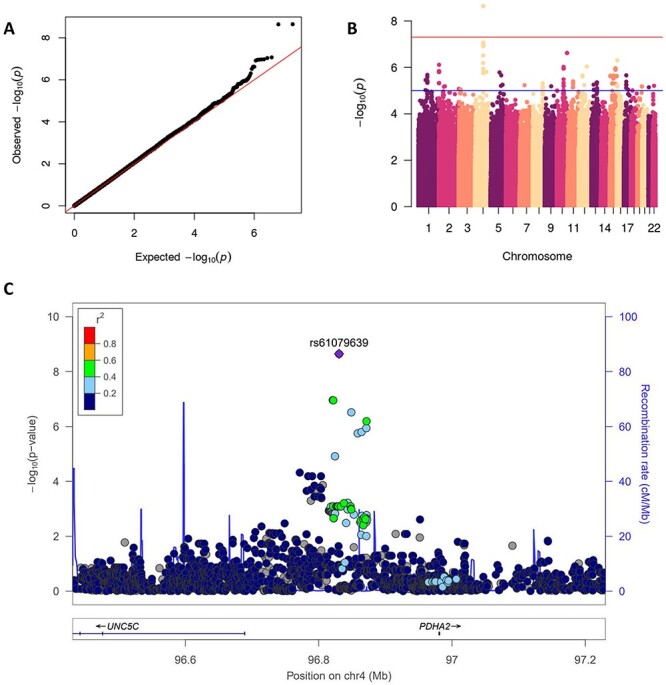
GWAS results for the YRI population and Daunorubicin cytotoxicity phenotype. QQ plot of GWAS results showing expected versus observed P-values, red line at x = y. Manhattan plot of GWAS results, red line at genome-wide significance threshold. LocusZoom plot of rs61079639 (P = 2.3 × 10⁻⁹), the blue line measures the recombination rate at a certain position and each point is colored to indicate linkage disequilibrium (r2) with rs61079639 in the 1000 Genomes November 2014 AFR population. AFR, African; UNC5C, Unc-5 Netrin Receptor C; PDHA2, Pyruvate Dehydrogenase E1 Subunit Alpha 2.
Figure 3 .
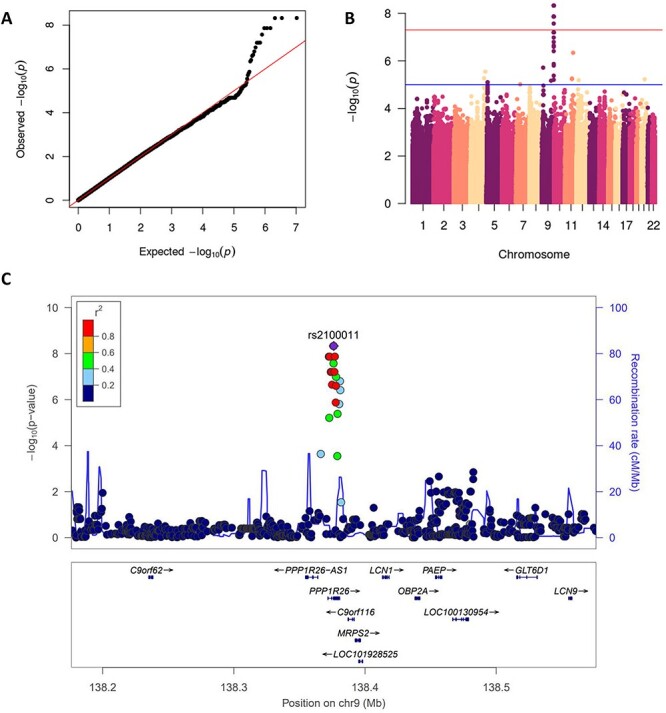
GWAS results for the ASN population and carboplatin cytotoxicity phenotype. QQ plot of GWAS results showing expected versus observed P-values, red line at x = y. Manhattan plot of GWAS results, red line at genome-wide significance threshold. LocusZoom plot of rs2100011 (P = 4.7 × 10⁻⁹), the blue line measures the recombination rate at a certain position and each point is colored to indicate linkage disequilibrium (r2) with rs2100011 in the 1000 Genomes November 2014 ASN population. ASN, Asian; C9orf62, Chromosome 9 Open Reading Frame 62; PPP1R26-AS1, PPP1R26 Antisense RNA 1; PPP1R26, Protein Phosphatase 1 Regulatory Subunit 26; C9orf116, Chromosome 9 Open Reading Frame 116; MRPS2, Mitochondrial Ribosomal Protein S2; LOC101928525, Uncharacterized LOC101928525; LCN1, Lipocalin 1; OBP2A, Odorant Binding Protein 2A; PAEP, Progestagen Associated Endometrial Protein; LOC100130954, Uncharacterized LOC100130954; GLT6D1, Glycosyltransferase 6 Domain Containing 1; LCN9, Lipocalin 9.
Table 2.
Genome-wide significant SNPs (Genome Build 37) from all GWAS performed
| Pop. | Drug | SNP | Chr. | Position | Non-effect allele | Effect allele | P-value | Beta |
|---|---|---|---|---|---|---|---|---|
| YRI | Daunorubicin | rs61079639 | 4 | 96611494 | T | A | 2.3 × 10⁻⁹ | 0.79 |
| YRI | Daunorubicin | rs60507300 | 4 | 96611493 | T | G | 2.3 × 10⁻⁹ | 0.79 |
| ASN | Carboplatin | rs2100011 | 9 | 138376145 | A | G | 4.7 × 10⁻⁹ | 0.77 |
| ASN | Carboplatin | rs2254812 | 9 | 138375872 | C | G | 4.7 × 10⁻⁹ | 0.77 |
| ASN | Carboplatin | rs2254813 | 9 | 138375861 | G | A | 4.7 × 10⁻⁹ | 0.77 |
| YRI | Etoposide | rs7971310 | 12 | 47428174 | G | A | 1.1 × 10⁻⁸ | −0.85 |
| YRI | Etoposide | rs7960974 | 12 | 47424034 | A | G | 1.1 × 10⁻⁸ | −0.85 |
| YRI | Etoposide | rs7979399 | 12 | 47424033 | G | T | 1.3 × 10⁻⁸ | −0.85 |
| YRI | Etoposide | rs2711729 | 12 | 47409824 | A | G | 1.5 × 10⁻⁸ | 0.88 |
| YRI | Etoposide | rs2711728 | 12 | 47411926 | C | A | 1.5 × 10⁻⁸ | 0.88 |
| YRI | Etoposide | rs11183699 | 12 | 47426533 | A | G | 2.6 × 10⁻⁸ | −0.79 |
| YRI | Cisplatin | rs10510241 | 3 | 2907097 | A | G | 4.7 × 10⁻⁸ | 0.65 |
| ALL | Etoposide | rs2711729 | 12 | 47409824 | A | G | 4.9 × 10⁻⁸ | 0.80 |
| ALL | Etoposide | rs2711728 | 12 | 47411926 | C | A | 4.9 × 10⁻⁸ | 0.80 |
Chr, chromosome.
Figure 4 .
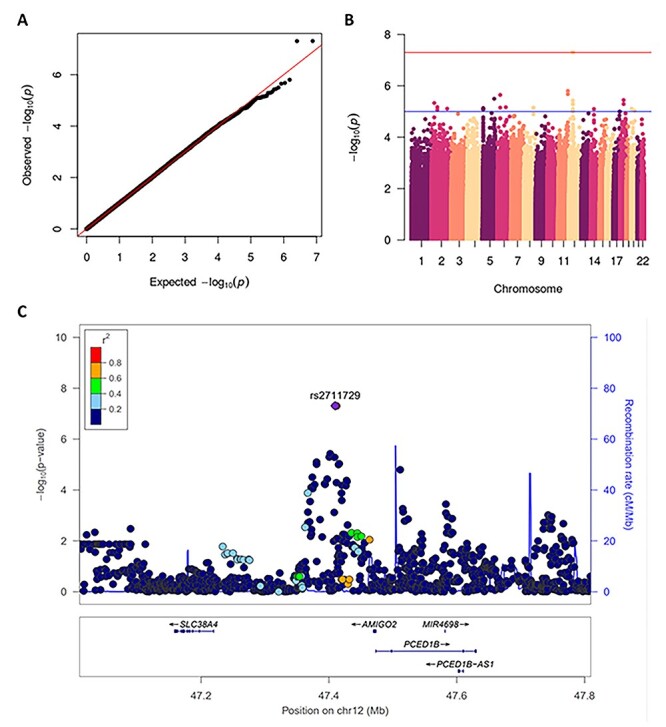
GWAS results for the ALL population and etoposide cytotoxicity phenotype. QQ plot of GWAS results showing expected versus observed P-values, red line at x = y. Manhattan plot of GWAS results, red line at genome-wide significance threshold. LocusZoom plot of rs2711729 (P = 4.9 × 10⁻⁸), the blue line measures the recombination rate at a certain position and each point is colored to indicate linkage disequilibrium (r2) with rs2711729 in the 1000 Genomes November 2014 AFR population. SLC38A4, Solute Carrier Family 38 Member 4; AMIGO2, Adhesion Molecule With Ig Like Domain 2; PCED1B, PC-Esterase Domain Containing 1B; MIR4698, MicroRNA 4698; PCED1B-AS1, PCED1B Antisense RNA 1.
TWAS predicts expression levels for three genes to be associated with chemotherapy-induced cytotoxicity
Following GWAS, we conducted TWAS using both PrediXcan and MultiXcan to identify significant associations between predicted gene expression levels and the cytotoxicity of each drug for each ancestral population (21,22). PrediXcan and MultiXcan utilize prediction models to calculate the predicted expression levels for various genes and to identify the associations between the predicted gene expression levels and phenotype (21,22). Both PrediXcan and MultiXcan calculate the predicted gene expression levels for each gene using each model individually, but while PrediXcan then finds model-specific associations between the predicted gene expression and phenotype, MultiXcan aggregates the expression to find overall associations and identifies models with the best and worst performances (21,22). We used the 48 GTEx version 7 tissue-based prediction models, which each contain approximately 10 000 genes, to run PrediXcan and MultiXcan (21,22). Additionally, for PrediXcan only, we used the five MESA population-based prediction models, which each contain approximately 8000 genes (23). To obtain the PrediXcan results, we used PrediXcan to calculate the predicted gene expression levels and GEMMA to conduct the association tests, as this accounted for relatedness within each ancestral population (21,28). To obtain the MultiXcan results, we used the same predicted gene expression levels and conducted the association tests with MultiXcan, as this produced aggregate associations (22). For the ALL population, we accounted for population stratification with the same covariates as in GWAS.
We found three significant associations (Bonferroni adjusted P-value < 0.05) between gene expression and cytotoxicity, two from PrediXcan and one from MultiXcan. Using PrediXcan, we determined increased predicted expression of STARD5 in the brain cortex tissue to be associated with a decrease in the concentration of etoposide required for cytotoxicity (IC50) in the ALL population (P = 8.5 × 10⁻⁸) (Fig. 5A). Additionally, we found increased predicted expression of USF1 in the liver tissue to be associated with an increase in the concentration of capecitabine required for cytotoxicity (AUC) in the ALL population (P = 8.7 × 10⁻⁸) (Fig. 5B). Using MultiXcan, we found increased predicted expression of CCAR1 to be associated with a decrease in the concentration of capecitabine required for cytotoxicity (AUC) in the YRI population (P = 4.2 × 10⁻⁶) (Fig. 5C). We examined the STARD5 results for the YRI population and etoposide phenotype derived from the other GTEx version 7 and MESA models and found consistent negative directions of effect across all nominally associated tissue models (P < 0.05, Supplementary Material, Table S2).
Figure 5 .
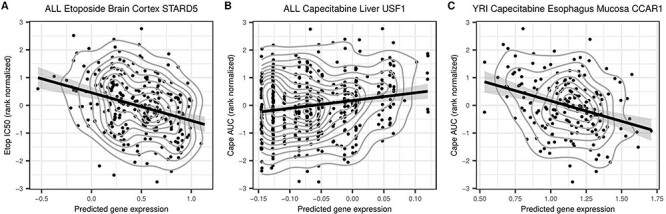
Predicted Expression of significant TWAS gene hits versus drug measured drug cytotoxicity levels. (A) Predicted expression of STARD5 in the ALL population as determined by PrediXcan using the GTEx v7 Brain Cortex prediction model plotted against RN etoposide IC50 levels as measured in LCLs from the ALL population. (B) Predicted expression of USF1 in the ALL population as determined by PrediXcan using the GTEx v7 Liver prediction model plotted against RN Capecitabine AUC levels as measured in LCLs from the ALL population. (C) Predicted expression of CCAR1 in the YRI population as determined by MultiXcan plotted against RN Capecitabine AUC levels as measured in LCLs from the YRI population. CCAR1 expression was best predicted by the GTEx v7 Esophagus Mucosa prediction model. Each point represents an individual, the curved gray lines convey density in regard to the distribution of the black points and the straight black line is the best fit determined by linear regression, which shows the direction of effect.
FUMA identifies enrichment in oncogenic signatures
We performed functional mapping and annotation (FUMA) gene set enrichment analysis on top PrediXcan results for each ancestral population and drug and found 12 significant gene sets (Supplementary Material, Table S3) (30). For the CEU population and cisplatin, we identified one significant gene set WNT_UP.V1_UP (P = 1.2 × 10⁻⁵). This gene set is an oncogenic signature, denoting upregulation of the listed genes as a result of the overexpression of WNT1 in mammary epithelial cells (31). The genes making up this set were all found to have predicted expression levels associated with cisplatin IC50. Cisplatin is often used to treat a variety of cancers, including lung, colon, testicular and ovarian cancers (32,33). Additionally, for the CEU population and cytarabine arabinoside (ara-C), we identified the gene set P53_DN.V1_DN to be significant (P = 1.1 × 10⁻⁴). This is another oncogenic signature, characterized by the downregulation of the genes listed in cancer cell lines with mutated TP53 from the NCI-60 collection (34). The genes in the set are impacted by mutations in TP53, a known tumor suppressor gene that, when mutated, can lead to malignancy (34). The predicted expression levels of these genes are associated with ara-C AUC. We also performed FUMA gene set enrichment analysis on top MultiXcan results for each ancestral population and drug, the results of which can be found in the supplement (Supplementary Material, Table S4).
Knockdown experiments validate reduced STARD5 expression is associated with reduced etoposide-induced cytotoxicity
After conducting GWAS and TWAS, we followed up on our results by performing functional experiments for STARD5, as this gene had the most significant predicted expression levels from the TWAS results. The predicted expression plot for STARD5 showed a negative correlation between STARD5 predicted expression and etoposide IC50. Therefore, for our functional experiments, we hypothesized that the knockdown of STARD5 expression levels would result in a higher etoposide IC50, which corresponds to the lower cellular sensitivity to etoposide. We selected the lung cancer cell line A549 for the knockdown experiments, as etoposide is often used to treat lung cancer (35).
After knocking down STARD5 with siRNA, we treated A549 cells with increasing concentrations of etoposide and then measured relative viability at 72 and 96 h after treatment (Fig. 6A). siRNA reduced STARD5 expression to less than 25% of control at 0, 72 and 96 h (Fig. 6B). At both 72 and 96 h, reduced STARD5 expression significantly increased cell viability (Fig. 6C and D; P = 0.034 for 72 h, P = 0.0001 for 96 h), validating our TWAS results that higher expression of STARD5 is correlated with greater sensitivity to etoposide.
Figure 6 .
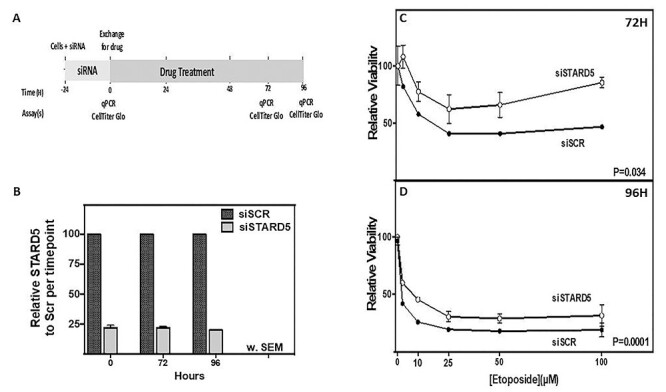
Evaluation of the effect of STARD5 knockdown on sensitivity of A549 lung cancer cells to etoposide. (A) Experimental scheme for knockdown of STARD5 in A549 and treatment with etoposide. (B) STARD5 expression was reduced <25% for cells treated with siSTARD5 (gray bars) compared with expression in siSCR (black bars) at time of drug treatment (0 h) and at 72 and 96 h as determined by qRT-PCR. (C, D) Relative viability, determined by CellTiter-Glo 2.0 assay, for A549 cells treated with increasing concentrations of etoposide at (C) 72 h and (D) 96 h after treatment with siSTARD5 (open circle) or siSCR control (closed circle). Data represent two independent experiments, including at least three replicates analyzed by two-way ANOVA showing the SEM.
Discussion
We conducted GWAS and TWAS for eight chemotherapeutic cytotoxicity phenotypes measured in LCLs from individuals in three ancestral populations (YRI, CEU and ASN) and one combined population (ALL). We identified 12 SNPs at four unique loci and three novel genes to be significantly associated with the chemotherapy-induced cytotoxicity. For the most significant gene, STARD5, we performed knockdown experiments to follow up on our finding that increased STARD5 expression associates with decreased etoposide IC50. These functional experiments validated this result, as knockdown of STARD5 increased the viability of A549 lung cancer cell lines treated with etoposide, demonstrating the positive correlation between STARD5 expression and cellular sensitivity to etoposide.
The TWAS we conducted identified an association between increased predicted expression of STARD5 and decreased etoposide IC50, implying a greater cellular sensitivity to etoposide. This finding was then validated through the knockdown experiments we performed, which demonstrated that a reduction of STARD5 expression to 25% of that of unaltered expression results in increased viability in A549 lung cancer cell lines treated with etoposide. Etoposide is a chemotherapeutic and antineoplastic drug that targets topoisomerase II, an enzyme that plays an essential role in DNA replication, recombination and transcription, by cutting and pasting double-stranded DNA (36). By interfering in topoisomerase II function in malignant cells, etoposide disrupts the necessary biological processes, leading to an increase in DNA breakage that ultimately induces apoptosis (36). Etoposide is commonly used to treat lung cancer; this informed our selection of the A549 lung cancer cell line for use in the knockdown experiments to test how etoposide IC50 would be impacted by a reduction in STARD5 expression (37). Additionally, previous projects have used A549 cell lines to study factors contributing to etoposide-induced cell death (38,39).
STARD5 encodes a steroidogenic acute regulatory related lipid transfer domain protein (40). Studies have found STARD5 to become more highly expressed as a response to endoplasmic reticulum (ER) stress, which leads to the relocation of the protein encoded by STARD5 from the nucleus to the cytosol and cell membrane (41). Etoposide, while disrupting normal topoisomerase II function, often induces ER stress in the process (42). This could contribute to increased STARD5 expression in cancer cells. Additionally, increased STARD5 expression in hepatocytes has been linked to increased cholesterol levels (40). STARD5 protein binds and transports cholesterol and other sterol-derived molecules in the liver and thus helps regulate lipid homeostasis and metabolism (40). The mechanisms for cholesterol homeostasis and drug metabolism have been found to rely on the same cellular receptors, including pregnane X receptor (PXR) (43). PXR binds etoposide as well as other chemotherapeutics to activate CYP3A4, a key enzyme involved in drug metabolism (44). The role of STARD5 in regulating metabolism and other liver functions could be one explanation for the association between etoposide-induced cytotoxicity and increased STARD5 expression. Etoposide metabolism occurs primarily in the liver, where STARD5 is highly expressed (40,45). Overall, increased expression of STARD5, whether preexisting or prompted by ER stress, may facilitate etoposide metabolism in the liver, in turn, promoting etoposide-induced cytotoxicity.
The GWAS we conducted revealed four unique loci associated with cellular sensitivity to either carboplatin, cisplatin, daunorubicin or etoposide. In the ASN population, we found three SNPs on chromosome 9 located within PPP1R26 to be associated with carboplatin-induced toxicity. PPP1R26 has been associated with tumor formation and is upregulated in breast carcinomas, promoting metastasis through the degradation of retinoblastoma protein, a tumor suppressor protein (46,47). In the YRI population, we found one SNP on chromosome 3 located within CNTN4 to be associated with cisplatin-induced toxicity. CNTN4 encodes a contactin 4, an immunoglobulin that regulates cellular interactions and axonal growth in the nervous system (48,49). Overexpression of CNTN4 has been found to be associated with malignancy in nerve tissue and with cisplatin-induced nephrotoxicity (48,49). In the ALL population, we found two SNPs on chromosome 12 in proximity to AMIGO2 to be associated with etoposide-induced toxicity. AMIGO2 is a scaffold protein that binds to PDK1 to regulate the phosphoinositide 3-kinase–Akt signaling pathway, which plays a role in many biological mechanisms, including cell proliferation and metabolism (50). Overexpression of AMIGO2 has been found to induce abnormal Akt signaling, which contributes to the onset and progression of various cancers (50). Additionally, AMIGO2 overexpression is a common characteristic of metastatic tissue, particularly when metastasis occurs in the liver, as AMIGO2 regulates cell adhesion in liver cells (51).
Additionally, we performed FUMA gene set enrichment analysis on the top genes identified with TWAS (30). For CEU and ara-C, we identified enrichment in the oncogenic signature gene set P53_DN.V1_DN, which consists of genes that are downregulated in cell lines with mutated TP53 (34). Mutations in TP53, which encodes a tumor suppressor protein, are linked to various cancer types, and the genes in this set are often downregulated in cancers where TP53 is also mutated (34). TP53 mutations are known to confer resistance to ara-C (52,53). We also found enrichment in the oncogenic signature WNT_UP.V1_UP for CEU and cisplatin. This gene set consists of upregulated genes in the Wnt signaling pathway, which is involved in cell proliferation (31). Abnormal activation of this pathway can result in tumor formation and progression (54). For CEU and paclitaxel, enrichment was found in a GWAS Catalog Reported gene set, containing genes associated with liver enzyme levels. GGT1 encodes gamma-glutamyl transferase, the main enzyme featured in this set, which cleaves extracellular glutathione and transfers its components—glutamic acid, cysteine and glycine—for intracellular use (55). Upregulation of GGT1 is a feature of a variety of cancer types, including kidney and ovarian carcinomas (3,55). Ovarian carcinomas often are treated with combination chemotherapy using cisplatin and paclitaxel, as these drugs use different mechanisms to induce cell death; however, a subset of patients develop resistance to one or both of these drugs (3). Upregulation of GGT1 was found to be associated with paclitaxel resistance in ovarian cancer cell lines already resistant to cisplatin (3). Thus, the enrichment of genes in this set, which are associated with paclitaxel, and the association with GGT1 in particular, may be understood in the context of this prior finding.
This study has limitations, as the functional follow-up to the TWAS we conducted utilized the lung cancer cell line A549 rather than patients with lung cancer or another replication population. However, the functional studies we performed validated the association between increased STARD5 expression and increased etoposide-induced cytotoxicity which we ascertained through TWAS. To fully understand how STARD5 expression impacts the mechanisms through which etoposide induces cell death, further mechanistic studies are required. Association studies conducted with proteomic data could enhance these findings further, as well as additional functional studies that explore links between STARD5 and drug metabolism. Moreover, if strides toward precision medicine are to continue, studies must promote greater diversity within participating populations, as currently the majority of human genome-wide studies are conducted on individuals of European ancestries (19,56). By studying diseases and drug response in populations with diverse ancestries, data will become more representative of the global population and the knowledge of genetic variants and their role in disease and drug response will be expanded (56). In summary, this project successfully identified novel genetic variants involved in chemotherapy-induced cytotoxicity in diverse ancestral populations through GWAS, TWAS, gene set enrichment analysis and functional gene knockdown experiments.
Materials and Methods
Chemotherapy cytotoxicity phenotypes
We procured cytotoxicity phenotypes measured in HapMap LCLs from previous studies of eight chemotherapy drugs, including ara-C, capecitabine, carboplatin, cisplatin, daunorubicin, etoposide, paclitaxel and pemetrexed (11–18,25–27). These LCLs were derived from 178 individuals from the Yoruba population in Ibadan, Nigeria (YRI), 178 individuals with European ancestries from Utah, USA (CEU), and 90 individuals from a combined population of Han Chinese from Beijing, China, and Japanese from Tokyo, Japan (ASN). The YRI population contained 58 parent–child trios and the CEU population contained 52 parent–child trios, which we accounted for when conducting our genetic analyses. The numbers of LCLs with measured phenotypes varied for each drug (Table 1). Cellular sensitivity to each drug was recorded as the AUC for ara-C, capecitabine, paclitaxel and pemetrexed, and as the IC50 for carboplatin, cisplatin, daunorubicin and etoposide. These concentrations were all measured after 72 h of exposure to the corresponding chemotherapeutic. We rank-normalized the AUC or IC50 for use in our subsequent genetic analyses. Additionally, once phenotypic data were collected for each ancestral population and drug, genotypic data were imputed using BEAGLE; all genotypes were in Genome Build 37 and only autosomal variants were analyzed.
GWAS with ancestral populations
Some individuals with HapMap LCLs used in this study were sequenced in the 1000 Genomes Project and some had genotypes only. Individuals genotyped in HapMap r28, but not sequenced, were previously imputed to 1000 Genomes (25). Phased genotype data of the 186 ASN, 85 CEU and 88 YRI samples sequenced in the 1000 Genomes Project phase I version 3 were downloaded from the BEAGLE website (http://faculty.Washington.edu/browning/beagle/beagle.html). An additional 15 ASN, 93 CEU and 90 YRI samples genotyped in HapMap r28 were imputed to 1000 Genomes using BEAGLE version 3.3.2, which considers the relatedness of the trios in the imputation (57,58). We used SNPs with imputation r2 > 0.8, population minor allele frequency (MAF) > 0.05 and in Hardy–Weinberg equilibrium (P > 1 × 10⁻⁶) in our studies.
Prior to conducting GWAS, we created a relatedness matrix for each of the ancestral populations, YRI, CEU and ASN, using GEMMA. For each ancestral population we used the genotype dosages, with a minimum MAF of 0.05, to calculate the centered relatedness matrix. We then used GEMMA version 0.98.1 to conduct GWAS using the linear mixed model Wald test for each ancestral population and corresponding phenotypes (Table 1) (28). After conducting GWAS, we created QQ, Manhattan and LocusZoom plots to aid in visualizing our results. We made the QQ and Manhattan plots in R using the package qqman and created the LocusZoom plots with the single plot service on http://locuszoom.org/ (59,60). We made LocusZoom plots for all SNPs with genome-wide significance (P < 5 × 10⁻⁸), and we used the corresponding 1000 Genomes November 2014 ancestral population when generating the LocusZoom plots. Additionally, we performed a conditional analysis of the genome-wide significant loci using linear regression with the top SNP as a covariate to determine independence for the SNPs that were identified at each chromosomal region.
GWAS with combined population
To organize data for the ALL population, we combined the BIMBAM files for both the genotype and phenotype data from each ancestral population into single files. We then used a subset of 100 000 SNPs to convert the BIMBAM files into PLINK files, which we needed to conduct PCA with KING (61,62). We used the covariates calculated by KING to account for population stratification in the ALL population. We also plotted the first three principal components to demonstrate that they accounted for population-based variation. Once these covariates were obtained, we generated a relatedness matrix for ALL and then conducted GWAS using the same methods as described for the ancestral populations, with the only difference being the inclusion of the covariates generated with PCA when conducting GWAS. We generated QQ, Manhattan and LocusZoom plots as well, using the same methods. As the ALL population does not correspond to a single 1000 Genomes November 2014 population, we made multiple LocusZoom plots for each genome-wide significant SNP, one with each ancestral population included in the ALL population.
TWAS with ancestral and combined populations
We conducted TWAS with PrediXcan on both the ancestral and combined populations for all applicable phenotypes, using the GTEx v7 and MESA prediction models (21,23,24). PrediXcan was used to calculate the predicted expression levels for each gene. We then used GEMMA to perform a total of 7 487 956 association tests, as this enabled us to account for relatedness within the populations with the matrices created previously. To use GEMMA for this purpose, we reformatted the predicted expression matrices outputted by PrediXcan into a readable format for GEMMA, so the association tests could be performed. This produced results specific to each prediction model for each population and phenotype combination. Additionally, we conducted TWAS with MultiXcan for the same populations and phenotypes, using the GTEx v7 prediction models only (22). We did not use GEMMA to conduct these association tests, as MultiXcan aggregates across prediction models to find overall associations and GEMMA does not conduct the association tests in this manner. Using MultiXcan, we performed 727 944 association tests and produced a single set of results for each population and phenotype combination, containing overall rather than model-specific associations. For the ALL population, we included the covariates generated from PCA when performing the association tests with both GEMMA and MultiXcan to account for population stratification. We then adjusted the P-values derived from both GEMMA and MultiXcan using Bonferroni correction to determine which genes had significant predicted expression levels associated with drug cytotoxicity. For each significant gene, we then created predicted expression plots in R using the package ggplot2, which plot the gene’s predicted expression level against the chemotherapy phenotype (either IC50 or AUC) for each individual (63).
FUMA gene set enrichment analysis
After performing TWAS on each population and cytotoxicity phenotype, we used the FUMA tool GENE2FUNC to perform gene set enrichment analysis of the results from PrediXcan and MultiXcan (30). One GENE2FUNC query was made for each ancestral population and phenotype combination. We submitted two lists of genes for each query, one for background genes, which contained all the genes analyzed during TWAS, and one for genes of interest, which contained a significant subset of genes based on either the PrediXcan or MultiXcan results we generated previously. To achieve a subset of approximately 100 genes in each genes of interest list, we used a significance threshold of unadjusted P-value < 0.0005 for all the PrediXcan results and unadjusted P-value < 0.005 for all the MultiXcan results. The PrediXcan results, which were derived from multiple prediction models, were combined so that the top genes across all models were selected for each ancestral population and phenotype. For the GENE2FUNC optional parameters, we used all the default options except for gene expression data sets, for which we selected GTEx v7: 53 tissue types and GTEx v7: 30 general tissue types, as these correspond to the prediction models we used when conducting TWAS. We report significant gene sets that are enriched in each run of PrediXcan or MultiXcan for each ancestral population and phenotype with adjusted P (Benjamini-Hochberg FDR) < 0.05.
Cancer cell lines
We obtained non-small cell lung cancer line A549 (CCL-185) from ATCC (Manassas, VA). IDEXX BioResearch (Columbia, MO) performed authentication of the cancer cell line, Case # 12135-2020 by using the Promega CELL ID System (Madison, WI) with eight short tandem repeat markers (CSF1PO, D13S317, D16S539, D5S818, D7S820, TH01, TPOX and vWA) and amelogenin (for sex).
Compound preparations
We dissolved etoposide (Sigma-Aldrich, St. Louis, MO) in DMSO to obtain a stock solution of 10 mm and filtered using a 0.22 μm solvent-resistant filter (EMD Millipore, Billerica, MA) for sterility. We serially diluted the stock in media for final concentrations of 5–100 μm for treatment of the A549 cancer cell line. Vehicle control was 0.1% DMSO in media.
Cellular assay with STARD5 knockdown
We maintained A549 cells in F-12 K media (Life Technologies, Carlsbad, CA) supplemented with 10% FBS (Hyclone, Fisher Scientific, Hanover Park, IL) and 1% penicillin–streptomycin (Life Technologies). We incubated cultures in a humidified incubator at 37°C with 5% CO2. We performed knockdown of STARD5 using a modified reverse transfection method (Thermo Fisher ‘Literature Code: 00189-08-C-01-U’). We mixed ON-TARGETplus SMARTpool siSTARD5 or ON-TARGETplus non-targeting pool (siSCR) purchased from Dharmacon Inc. (Lafayette, CO) with DharmaFECT1 (Dharmacon Inc.) as per manufacturer’s recommendations to create the transfection mix. We added complete media siSTARD5 or siSCR complex to produce 25 nm final concentrations of each, then added the mixture to a cell pellet such that the final concentration of cells was 6000 cells/100 μl volume and plated into the 96 well flat bottom tissue culture plates (Cell Star; Quality Biologicals Inc., Gaithersburg, MD). As a quality control check of the effect of siRNA on cell growth rates, we assayed cell viability using CellTiter-Glo 2.0 (Promega), which measures cellular ATP from 0 to 96 h in control wells. At 24 h, we replaced transfection media with media containing increasing concentrations of etoposide (5–100 μm). To determine cellular sensitivity to etoposide in the presence of siSTARD5 or siSCR, we incubated cells with drug for 72 and 96 h, followed by cell viability assays using CellTiter-Glo 2.0.
Quantitative reverse transcription-PCR analysis
At 0, 72 and 96 h post-drug treatment, we added trypsin to the wells of A549 cells (6000 cells/well) containing siSTARD5 or siSCR and combined, pelleted and stored the cells at −80°C. We extracted RNA using RNeasy Plus (Qiagen, Valencia, CA) and prepared cDNA from 500 ng RNA/sample with the high-capacity cDNA kit (Life Technologies). To determine STARD5 knockdown in A549 cells, we performed quantitative reverse transcription-PCR (qRT-PCR) for STARD5, Hs01075234_m1 and a control gene B2M, 4326319E (Life Technologies) using TaqMan Fast Gene Expression mix (Applied Biosystems, Foster City, CA). We ran each qRT-PCR in triplicate and determined gene expression levels using the relative standard curve method on the Viia7 (Life Technologies). We calculated percent knockdown by dividing the relative STARD5 expression levels in the siSTARD5 sample by the STARD5 expression in the non-targeting control (siSCR).
Supplementary Material
Acknowledgements
The authors thank Swarnali Banerjee, Stefan Kanzok, and members of the Wheeler Lab for helpful feedback during the development of this project.
Conflict of Interest statement. None declared.
Contributor Information
Ashley J Mulford, Department of Biology, Loyola University Chicago, Chicago, IL 60660, USA; Program in Bioinformatics, Loyola University Chicago, Chicago, IL 60660, USA.
Claudia Wing, Section of Hematology/Oncology, Department of Medicine, University of Chicago, Chicago, IL 60637, USA.
M Eileen Dolan, Section of Hematology/Oncology, Department of Medicine, University of Chicago, Chicago, IL 60637, USA.
Heather E Wheeler, Department of Biology, Loyola University Chicago, Chicago, IL 60660, USA; Program in Bioinformatics, Loyola University Chicago, Chicago, IL 60660, USA.
Funding
This work was supported by the National Institutes of Health National Human Genome Research Institute (grant number R15HG009569 to H.E.W.), the University of Chicago Comprehensive Cancer Center Women's Board (M.E.D.), and the Loyola University Chicago Biology Summer, Mulcahy, and Bioinformatics Graduate Research Assistant Fellowships (A.J.M.).
References
- 1. Torre, L.A., Siegel, R.L., Ward, E.M. and Jemal, A. (2016) Global cancer incidence and mortality rates and trends—an update. Cancer Epidemiol. Biomark. Prev., 25, 16–27. [DOI] [PubMed] [Google Scholar]
- 2. Galmarini, D., Galmarini, C.M. and Galmarini, F.C. (2012) Cancer chemotherapy: a critical analysis of its 60 years of history. Crit. Rev. Oncol. Hematol., 84, 181–199. [DOI] [PubMed] [Google Scholar]
- 3. Stordal, B., Hamon, M., McEneaney, V., Roche, S., Gillet, J., O’Leary, J.J., Gottesman, M. and Clynes, M. (2012) Resistance to paclitaxel in a cisplatin-resistant ovarian cancer cell line is mediated by P-glycoprotein. PLoS One, 7, e40717. [DOI] [PMC free article] [PubMed] [Google Scholar]
- 4. Marin, J.J.G., Romero, M.R., Blazquez, A.G., Herraez, E., Keck, E. and Briz, O. (2009) Importance and limitations of chemotherapy among the available treatments for gastrointestinal tumours. Anti Cancer Agents Med. Chem., 9, 162–184. [DOI] [PubMed] [Google Scholar]
- 5. Roy, P.S. and Saikia, B.J. (2016) Cancer and cure: a critical analysis. Indian J. Cancer, 53, 441–442. [DOI] [PubMed] [Google Scholar]
- 6. Jackson, S.E. and Chester, J.D. (2015) Personalised cancer medicine. Int. J. Cancer, 137, 262–266. [DOI] [PubMed] [Google Scholar]
- 7. Wheeler, H.E. and Dolan, M.E. (2012) Lymphoblastoid cell lines in pharmacogenomic discovery and clinical translation. Pharmacogenomics, 13, 55–70. [DOI] [PMC free article] [PubMed] [Google Scholar]
- 8. International Hap Map Consortium (2003) The international hap map project. Nature, 426, 789–796. [DOI] [PubMed] [Google Scholar]
- 9. 1000 Genomes Project Consortium, Auton, A., Brooks, L.D., Durbin, R.M., Garrison, E.P., Kang, H.M., Korbel, J.O., Marchini, J.L., McCarthy, S., McVean, G.A. and Abecasis, G.R. (2015) A global reference for human genetic variation. Nature, 526, 68–74. [DOI] [PMC free article] [PubMed] [Google Scholar]
- 10. Niu, N. and Wang, L. (2015) In vitro human cell line models to predict clinical response to anticancer drugs. Pharmacogenomics, 16, 273–285. [DOI] [PMC free article] [PubMed] [Google Scholar]
- 11. Huang, R.S., Duan, S., Bleibel, W.K., Kistner, E.O., Zhang, W., Clark, T.A., Chen, T.X., Schweitzer, A.C., Blume, J.E., Cox, N.J. and Dolan, M.E. (2007) A genome-wide approach to identify genetic variants that contribute to etoposide-induced cytotoxicity. Proc. Natl. Acad. Sci. U. S. A., 104, 9758–9763. [DOI] [PMC free article] [PubMed] [Google Scholar]
- 12. Wheeler, H.E., Gamazon, E.R., Stark, A.L., O'Donnell, P.H., Gorsic, L.K., Huang, R.S., Cox, N.J. and Dolan, M.E. (2013) Genome-wide meta-analysis identifies variants associated with platinating agent susceptibility across populations. Pharmacogenomics J., 13, 35–43. [DOI] [PMC free article] [PubMed] [Google Scholar]
- 13. Huang, R.S., Duan, S., Shukla, S.J., Kistner, E.O., Clark, T.A., Chen, T.X., Schweitzer, A.C., Blume, J.E. and Dolan, M.E. (2007) Identification of genetic variants contributing to cisplatin-induced cytotoxicity by use of a genomewide approach. Am. J. Hum. Genet., 81, 427–437. [DOI] [PMC free article] [PubMed] [Google Scholar]
- 14. Bleibel, W.K., Duan, S., Huang, R.S., Kistner, E.O., Shukla, S.J., Wu, X., Badner, J.A. and Dolan, M.E. (2009) Identification of genomic regions contributing to etoposide-induced cytotoxicity. Hum. Genet., 125, 173–180. [DOI] [PMC free article] [PubMed] [Google Scholar]
- 15. Huang, R.S., Duan, S., Kistner, E.O., Hartford, C.M. and Dolan, M.E. (2008) Genetic variants associated with carboplatin-induced cytotoxicity in cell lines derived from Africans. Mol. Cancer Ther., 7, 3038–3046. [DOI] [PMC free article] [PubMed] [Google Scholar]
- 16. Huang, R.S., Duan, S., Kistner, E.O., Bleibel, W.K., Delaney, S.M., Fackenthal, D.L., Das, S. and Dolan, M.E. (2008) Genetic variants contributing to daunorubicin-induced cytotoxicity. Cancer Res., 68, 3161–3168. [DOI] [PMC free article] [PubMed] [Google Scholar]
- 17. O'Donnell, P.H., Stark, A.L., Gamazon, E.R., Wheeler, H.E., McIlwee, B.E., Gorsic, L., Im, H.K., Huang, R.S., Cox, N.J. and Dolan, M.E. (2012) Identification of novel germline polymorphisms governing capecitabine sensitivity. Cancer, 118, 4063–4073. [DOI] [PMC free article] [PubMed] [Google Scholar]
- 18. Hartford, C.M., Duan, S., Delaney, S.M., Mi, S., Kistner, E.O., Lamba, J.K., Huang, R.S. and Dolan, M.E. (2009) Population-specific genetic variants important in susceptibility to cytarabine arabinoside cytotoxicity. Blood, 113, 2145–2153. [DOI] [PMC free article] [PubMed] [Google Scholar]
- 19. Hindorff, L.A., Bonham, V.L., Brody, L.C., Ginoza, M.E.C., Hutter, C.M., Manolio, T.A. and Green, E.D. (2018) Prioritizing diversity in human genomics research. Nat. Rev. Genet., 19, 175. [DOI] [PMC free article] [PubMed] [Google Scholar]
- 20. Park, S.L., Cheng, I. and Haiman, C.A. (2018) Genome-wide association studies of cancer in diverse populations. Cancer Epidemiol. Biomark. Prev., 27, 405–417. [DOI] [PMC free article] [PubMed] [Google Scholar]
- 21. Gamazon, E.R., Wheeler, H.E., Shah, K.P., Mozaffari, S.V., Aquino-Michaels, K., Carroll, R.J., Eyler, A.E., Denny, J.C., Consortium, G.T.E., Nicolae, D.L. et al. (2015) A gene-based association method for mapping traits using reference transcriptome data. Nat. Genet., 47, 1091–1098. [DOI] [PMC free article] [PubMed] [Google Scholar]
- 22. Barbeira, A.N., Pividori, M., Zheng, J., Wheeler, H.E., Nicolae, D.L. and Im, H.K. (2019) Integrating predicted transcriptome from multiple tissues improves association detection. PLoS Genet., 15, e1007889. [DOI] [PMC free article] [PubMed] [Google Scholar]
- 23. Mogil, L.S., Andaleon, A., Badalamenti, A., Dickinson, S.P., Guo, X., Rotter, J.I., Johnson, W.C., Im, H.K., Liu, Y. and Wheeler, H.E. (2018) Genetic architecture of gene expression traits across diverse populations. PLoS Genet., 14, e1007586. [DOI] [PMC free article] [PubMed] [Google Scholar]
- 24. Barbeira, A.N., Dickinson, S.P., Bonazzola, R., Zheng, J., Wheeler, H.E., Torres, J.M., Torstenson, E.S., Shah, K.P., Garcia, T., Edwards, T.L. et al. (2018) Exploring the phenotypic consequences of tissue specific gene expression variation inferred from GWAS summary statistics. Nat. Commun., 9, 1825. [DOI] [PMC free article] [PubMed] [Google Scholar]
- 25. Komatsu, M., Wheeler, H.E., Chung, S., Low, S.K., Wing, C., Delaney, S.M., Gorsic, L.K., Takahashi, A., Kubo, M., Kroetz, D.L. et al. (2015) Pharmacoethnicity in paclitaxel-induced sensory peripheral neuropathy. Clin. Cancer Res., 21, 4337–4346. [DOI] [PMC free article] [PubMed] [Google Scholar]
- 26. Gamazon, E.R., Lamba, J.K., Pounds, S., Stark, A.L., Wheeler, H.E., Cao, X., Im, H.K., Mitra, A.K., Rubnitz, J.E., Ribeiro, R.C. et al. (2013) Comprehensive genetic analysis of cytarabine sensitivity in a cell-based model identifies polymorphisms associated with outcome in AML patients. Blood, 121, 4366–4376. [DOI] [PMC free article] [PubMed] [Google Scholar]
- 27. Gamazon, E.R., Trendowski, M.R., Wen, Y., Wing, C., Delaney, S.M., Huh, W., Wong, S., Cox, N.J. and Dolan, M.E. (2018) Gene and Micro RNA perturbations of cellular response to pemetrexed implicate biological networks and enable imputation of response in lung adenocarcinoma. Sci. Rep., 8, 733. [DOI] [PMC free article] [PubMed] [Google Scholar]
- 28. Zhou, X. and Stephens, M. (2012) Genome-wide efficient mixed-model analysis for association studies. Nat. Genet., 44, 821–824. [DOI] [PMC free article] [PubMed] [Google Scholar]
- 29. MacArthur, J., Bowler, E., Cerezo, M., Gil, L., Hall, P., Hastings, E., Junkins, H., McMahon, A., Milano, A., Morales, J. et al. (2017) The new NHGRI-EBI Catalog of published genome-wide association studies (GWAS Catalog). Nucleic Acids Res., 45, D896–D901. [DOI] [PMC free article] [PubMed] [Google Scholar]
- 30. Watanabe, K., Taskesen, E., van Bochoven, A. and Posthuma, D. (2017) Functional mapping and annotation of genetic associations with FUMA. Nat. Commun., 8, 1826. [DOI] [PMC free article] [PubMed] [Google Scholar]
- 31. Ziegler, S., Röhrs, S., Tickenbrock, L., Möröy, T., Klein-Hitpass, L., Vetter, I.R. and Müller, O. (2005) Novel target genes of the Wnt pathway and statistical insights into Wnt target promoter regulation. FEBS J., 272, 1600–1615. [DOI] [PubMed] [Google Scholar]
- 32. Trendowski, M.R., El-Charif, O., Ratain, M.J., Monahan, P., Mu, Z., Wheeler, H.E., Dinh, P.C., Jr., Feldman, D.R., Ardeshir-Rouhani-Fard, S., Hamilton, R.J. et al. (2019) Clinical and genome-wide analysis of serum platinum levels after cisplatin-based chemotherapy. Clin. Cancer Res., 25, 5913–5924. [DOI] [PMC free article] [PubMed] [Google Scholar]
- 33. Trendowski, M.R., el Charif, O., Dinh, P.C., Jr., Travis, L.B. and Dolan, M.E. (2019) Genetic and modifiable risk factors contributing to cisplatin-induced toxicities. Clin. Cancer Res., 25, 1147–1155. [DOI] [PMC free article] [PubMed] [Google Scholar]
- 34. Subramanian, A., Tamayo, P., Mootha, V.K., Mukherjee, S., Ebert, B.L., Gillette, M.A., Paulovich, A., Pomeroy, S.L., Golub, T.R., Lander, E.S. and Mesirov, J.P. (2005) Gene set enrichment analysis: a knowledge-based approach for interpreting genome-wide expression profiles. Proc. Natl. Acad. Sci. U. S. A., 102, 15545–15550. [DOI] [PMC free article] [PubMed] [Google Scholar]
- 35. Qiu, Z., Lin, A., Li, K., Lin, W., Wang, Q., Wei, T., Zhu, W., Luo, P. and Zhang, J. (2019) A novel mutation panel for predicting etoposide resistance in small-cell lung cancer. Drug Des. Devel. Ther., 13, 2021–2041. [DOI] [PMC free article] [PubMed] [Google Scholar]
- 36. Hande, K.R. (1998) Etoposide: four decades of development of a topoisomerase II inhibitor. Eur. J. Cancer, 34, 1514–1521. [DOI] [PubMed] [Google Scholar]
- 37. Zucchetti, M., Pagani, O., Torri, V., Sessa, C., D'Incalci, M., de Fusco, M., de Jong, J., Gentili, D., Martinelli, G. and Tinazzi, A. (1995) Clinical pharmacology of chronic oral etoposide in patients with small cell and non-small cell lung cancer. Clin. Cancer Res., 1, 1517–1524. [PubMed] [Google Scholar]
- 38. Litwiniec, A., Gackowska, L., Helmin-Basa, A., Żuryń, A. and Grzanka, A. (2013) Low-dose etoposide-treatment induces endoreplication and cell death accompanied by cytoskeletal alterations in A549 cells: does the response involve senescence? The possible role of vimentin. Cancer Cell Int., 13, 9. [DOI] [PMC free article] [PubMed] [Google Scholar]
- 39. Huang, Y., Chan, A.M., Liu, Y., Wang, X. and Holbrook, N.J. (1997) Serum withdrawal and etoposide induce apoptosis in human lung carcinoma cell line A549 via distinct pathways. Apoptosis, 2, 199–206. [DOI] [PubMed] [Google Scholar]
- 40. Rodriguez-Agudo, D., Ren, S., Hylemon, P.B., Redford, K., Natarajan, R., Del Castillo, A., Gil, G. and Pandak, W.M. (2005) Human Star D5, a cytosolic StAR-related lipid binding protein. J. Lipid Res., 46, 1615–1623. [DOI] [PubMed] [Google Scholar]
- 41. Rodriguez-Agudo, D., Calderon-Dominguez, M., Medina, M.A., Ren, S., Gil, G. and Pandak, W.M. (2012) ER stress increases StarD5 expression by stabilizing its mRNA and leads to relocalization of its protein from the nucleus to the membranes. J. Lipid Res., 53, 2708–2715. [DOI] [PMC free article] [PubMed] [Google Scholar]
- 42. Wang, C., Zhang, F., Cao, Y., Zhang, M., Wang, A., Xu, M., Su, M., Zhang, M. and Zhuge, Y. (2016) Etoposide induces apoptosis in activated human hepatic stellate cells via ER stress. Sci. Rep., 6, 34330. [DOI] [PMC free article] [PubMed] [Google Scholar]
- 43. Rezen, T., Rozman, D., Pascussi, J.M. and Monostory, K. (2011) Interplay between cholesterol and drug metabolism. Biochim. Biophys. Acta, 1814, 146–160. [DOI] [PubMed] [Google Scholar]
- 44. Schuetz, E., Lan, L., Yasuda, K., Kim, R., Kocarek, T.A., Schuetz, J. and Strom, S. (2002) Development of a real-time in vivo transcription assay: application reveals pregnane X receptor-mediated induction of CYP3A4 by cancer chemotherapeutic agents. Mol. Pharmacol., 62, 439–445. [DOI] [PubMed] [Google Scholar]
- 45. Kawashiro, T., Yamashita, K., Zhao, X.J., Koyama, E., Tani, M., Chiba, K. and Ishizaki, T. (1998) A study on the metabolism of etoposide and possible interactions with antitumor or supporting agents by human liver microsomes. J. Pharmacol. Exp. Ther., 286, 1294–1300. [PubMed] [Google Scholar]
- 46. Zheng, T., Lu, M., Wang, T., Zhang, C. and Du, X. (2018) NRBE3 promotes metastasis of breast cancer by down-regulating E-cadherin expression. Biochim. Biophys. Acta Mol. Cell Res., 1865, 1869–1877. [DOI] [PubMed] [Google Scholar]
- 47. Yang, L., Zhao, J., Lü, W., Li, Y., Du, X., Ning, T., Lu, G. and Ke, Y. (2005) KIAA 0649, a 1A6/DRIM-interacting protein with the oncogenic potential. Biochem. Biophys. Res. Commun., 334, 884–890. [DOI] [PubMed] [Google Scholar]
- 48. Garcia, S.L., Lauritsen, J., Zhang, Z., Bandak, M., Dalgaard, M.D., Nielsen, R.L., Daugaard, G. and Gupta, R. (2020) Prediction of nephrotoxicity associated with cisplatin-based chemotherapy in testicular cancer patients. JNCI Cancer Spectr., 4, pkaa032. [DOI] [PMC free article] [PubMed] [Google Scholar]
- 49. Evenepoel, L., van Nederveen, F.H., Oudijk, L., Papathomas, T.G., Restuccia, D.F., Belt, E.J.T., de Herder, W.W., Feelders, R.A., Franssen, G.J.H., Hamoir, M. et al. (2018) Expression of contactin 4 is associated with malignant behavior in pheochromocytomas and paragangliomas. J. Clin. Endocrinol. Metab., 103, 46–55. [DOI] [PubMed] [Google Scholar]
- 50. Park, H., Lee, S., Shrestha, P., Kim, J., Park, J.A., Ko, Y., Ban, Y.H., Park, D.Y., Ha, S.J., Koh, G.Y. et al. (2015) AMIGO2, a novel membrane anchor of PDK1, controls cell survival and angiogenesis via Akt activation. J. Cell Biol., 211, 619–637. [DOI] [PMC free article] [PubMed] [Google Scholar]
- 51. Kanda, Y., Osaki, M., Onuma, K., Sonoda, A., Kobayashi, M., Hamada, J., Nicolson, G.L., Ochiya, T. and Okada, F. (2017) Amigo 2-upregulation in tumour cells facilitates their attachment to liver endothelial cells resulting in liver metastases. Sci. Rep., 7, 43567. [DOI] [PMC free article] [PubMed] [Google Scholar]
- 52. Goldberg, A.D., Talati, C., Desai, P., Famulare, C., Devlin, S.M., Farnoud, N., Sallman, D.A., Lancet, J.E., Roboz, G.J., Sweet, K.L. and Tallman, M.S. (2018) TP53 mutations predict poorer responses to CPX-351 in acute myeloid leukemia. Blood, 132, 1433–1433. [Google Scholar]
- 53. Ko, Y.C., Hu, C.Y., Liu, Z.H., Tien, H.F., Ou, D.L., Chien, H.F. and Lin, L.I. (2019) Cytarabine-resistant FLT3-ITD leukemia cells are associated with TP53 mutation and multiple pathway alterations—possible therapeutic efficacy of cabozantinib. Int. J. Mol. Sci., 20, 1230. [DOI] [PMC free article] [PubMed] [Google Scholar]
- 54. Giles, R.H., van Es, J.H. and Clevers, H. (2003) Caught up in a Wnt storm: Wnt signaling in cancer. Biochim. Biophys. Acta, 1653, 1–24. [DOI] [PubMed] [Google Scholar]
- 55. Bansal, A., Sanchez, D.J., Nimgaonkar, V., Sanchez, D., Riscal, R., Skuli, N. and Simon, M.C. (2019) Gamma-glutamyltransferase 1 promotes clear cell renal cell carcinoma initiation and progression. Mol. Cancer Res., 17, 1881–1892. [DOI] [PMC free article] [PubMed] [Google Scholar]
- 56. Landry, L.G., Ali, N., Williams, D.R., Rehm, H.L. and Bonham, V.L. (2018) Lack of diversity in genomic databases is a barrier to translating precision medicine research into practice. Health Aff., 37, 780–785. [DOI] [PubMed] [Google Scholar]
- 57. Browning, S.R. and Browning, B.L. (2007) Rapid and accurate haplotype phasing and missing-data inference for whole-genome association studies by use of localized haplotype clustering. Am. J. Hum. Genet., 81, 1084–1097. [DOI] [PMC free article] [PubMed] [Google Scholar]
- 58. 1000 Genomes Project Consortium, Abecasis, G.R., Auton, A., Brooks, L.D., DePristo, M., Durbin, R.M., Handsaker, R.E., Kang, H.M., Marth, G.T. and McVean, G. (2012) An integrated map of genetic variation from 1,092 human genomes. Nature, 491, 56–65. [DOI] [PMC free article] [PubMed] [Google Scholar]
- 59. Turner, S.D. (2014) qqman: an R package for visualizing GWAS results using QQ and manhattan plots. bioRxiv, doi: 10.1101/005165. [DOI]
- 60. Pruim, R.J., Welch, R.P., Sanna, S., Teslovich, T.M., Chines, P.S., Gliedt, T.P., Boehnke, M., Abecasis, G.R. and Willer, C.J. (2010) Locus zoom: regional visualization of genome-wide association scan results. Bioinformatics, 26, 2336–2337. [DOI] [PMC free article] [PubMed] [Google Scholar]
- 61. Manichaikul, A., Mychaleckyj, J.C., Rich, S.S., Daly, K., Sale, M. and Chen, W.M. (2010) Robust relationship inference in genome-wide association studies. Bioinformatics, 26, 2867–2873. [DOI] [PMC free article] [PubMed] [Google Scholar]
- 62. Purcell, S., Neale, B., Todd-Brown, K., Thomas, L., Ferreira, M.A., Bender, D., Maller, J., Sklar, P., de Bakker, P.I., Daly, M.J. and Sham, P.C. (2007) PLINK: a tool set for whole-genome association and population-based linkage analyses. Am. J. Hum. Genet., 81, 559–575. [DOI] [PMC free article] [PubMed] [Google Scholar]
- 63. Wickham, H. (2016) ggplot2: Elegant Graphics for Data Analysis. Springer, New York, NY. [Google Scholar]
Associated Data
This section collects any data citations, data availability statements, or supplementary materials included in this article.